 Triplex
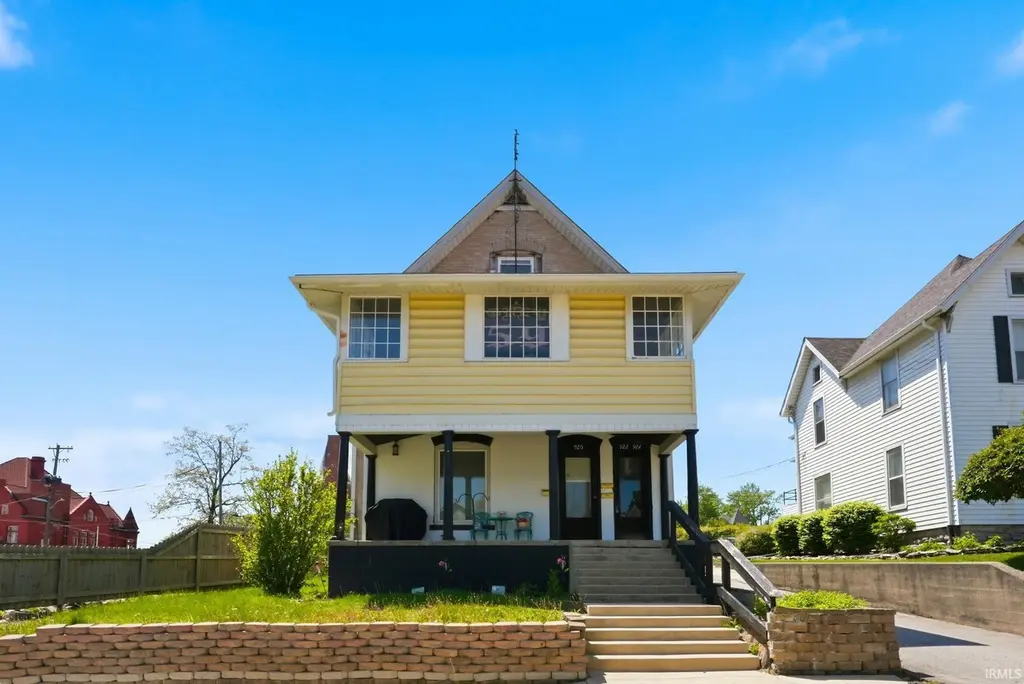
920 Warren St · Huntington, IN
Flood risk 1/10 · Minimal
- FEMA flood zone
- X (unshaded)
- Chance of flooding over 30 yrs
- 0.0%
- Est. flood insurance / yr
- $473 – $860
Fire risk 1/10 · Minimal
- Est. fire insurance / yr
- $717 – $1,331
Heat risk 3/10 · Minor
- Hot days now (above 101°F)
- 7 days/yr
- Hot days in 30 yrs
- 17 days/yr
Wind risk 2/10 · Minimal
- Chance of severe wind over 30 yrs
- —
Air-quality risk 3/10 · Minor
- Unhealthy air days now
- 1 days/yr
- Unhealthy air days in 30 yrs
- 3 days/yr
Risk factors via First Street. Map © Google.
Why this score? — see what drove the B- grade
The composite is a weighted blend of 9 inputs, each scored 0–100. Each bar is that input's sub-score; the figure is the points it added to the 100-point composite (weight × sub-score).
- Cash flow +30.0/30.0
- 1% rule +10.0/10.0
- DSCR +10.0/10.0
- ARV discount +7.5/15.0
- Livability +3.5/5.0
- Schools +3.1/10.0
- Rent growth +2.5/5.0
- Condition / age +2.5/5.0
- Appreciation +0.0/10.0
$175,000
🖨 Deal sheet (PDF) 📄 Offer letter ✓ Due diligence
Multi-family units
County records classify this as Multi-Family (2-4 Unit). Listing-text estimate: 3 units. confirmed
Listing remarks
This FULLY RENTED TRIPLEX offers a strong investment opportunity, generating $2,420 in monthly rental income. Each unit is responsible for its own electric and gas, with water billed through RUBS, helping streamline operating costs. Ideally located in the historic district of Huntington, the property is just 3 minutes from shopping and dining, making it an attractive option for tenants. With steady income, a convenient location, and efficient utility structure, this triplex is a solid addition to any investment portfolio. Very rare unit mix with 3 Bedroom, 2 Bedroom, and 1 Bedroom Units. Unit 924 (1 Bedroom) will move out 06/18/2026.
Key facts
- Convenient location
- Historic district
- 5,499 sq ft lot
Tags
Property features AI
Finance
- Other: Breed restrictions for pets
Exterior
- Parking: 3 off-street/open parking spaces; On-street parking available
- Utilities: Public water; Public sewer
- Home design: Residential income property (triplex); 3-story building; Entry level information not provided; Facing direction not provided
- Construction: Brick and vinyl siding exterior; Asphalt shingle roof; Has basement (crawl space, partial, unfinished)
- Exterior features: Covered patio/porch; Level lot
Interior
- Kitchen: Range; Refrigerator
- Flooring: Carpet
- Bathrooms: 3 full bathrooms; 6 main-level bathrooms
- Heating & cooling: Forced air heating; Natural gas heating
- Interior features: Vaulted ceilings; Eat-in kitchen; Entrance foyer
- Laundry & utility: Washer hookup; Dryer
Neighborhood map
What this means for you Summary
Snapshot
- This is a 1×1bd/1.0ba + 2×2bd/1.0ba units multifamily listed at $175k.
Deal economics
- At list price, monthly cash flow is $1k ($16k/yr) — positive. Per door: $443/mo.
- The deal already cash-flows at list — no discount required.
- Meets the 1% rule at list price ($3k rent vs $175k).
- Recommended offer: $170k (3.0% below list) — sets the bar for market timing.
- Cap rate 15.4% vs local median 4.3% in Huntington — top-decile yield for the area; either an underpriced asset or a hidden risk that comps aren't pricing in. Stress-test before assuming the spread holds.
Location & tenants
- Location reads 69/100 on livability (#193 in IN) — a middle-class / working-renter tenant base. Strengths: crime A+, cost of living A+, housing A+; Watch: health & safety C-, employment D, amenities F.
- Huntington County Community School Corporation (rural): math 34% / reading 39% proficiency, ranked #176 of 301 in IN (top 58%) — families likely to look elsewhere, expect single-tenant / working-renter base with shorter leases.
- Zoned schools: Flint Springs Elementary (math 35% / reading 38%, grade F, #571 of 994 statewide, top 58%, 461 students, 55% FRL); Crestview Middle School (math 28% / reading 38%, grade F, #180 of 330 statewide, top 56%, 606 students, 47% FRL); Huntington North High School (math 30% / reading 55%, grade F, #195 of 369 statewide, top 53%, 1,424 students, 42% FRL).
- Market conditions: 112 active listings in the ZIP; 79 units permitted in Huntington County in 2024 (0 in 5+ unit buildings).
Forward outlook
- Local home prices are declining (-3.0%/yr); year-one equity from $1k of loan paydown is wiped out by about $5k of value loss. Plan a longer hold.
- Huntington County population projected at -14% by 2050 — secular population decline; favor cash flow + early exit over multi-decade hold.
- At projected returns (-3.0% appreciation + 3.0% rent growth), your $49k cash investment doubles in ~4 years — after that, you're playing with house money.
Negotiation context
- It's been on market 45 days — a 3% lower offer ($170k) is reasonable based on typical stale-listing flexibility.
- 3 sale attempts since 3y ago; this cycle's ask has dropped $15k (8%) from the opening price — seller is motivated, your offer sets the floor, not the list.
Risks & watch-outs
- Watch-outs: built in 1929 — expect roof / HVAC / electrical / plumbing capex.
Questions for the listing agent
- It's been on market 45 days. Have you received any prior offers? Is the seller open to a 3% concession, seller financing, or rate buy-down credit?
- Can we see the unit-by-unit rent roll, current vacancy, and any below-market leases? What's the average tenancy length?
- What capital expenditures (roof, boiler, parking lot, exteriors) have been made in the last 5 years, and what's planned in the next 2?
- Built in 1929 — when were the roof, HVAC, electrical panel, plumbing, and water heater last replaced?
- Is there a deadline driving the sale (1031 exchange, divorce, estate, relocation)? That informs how much negotiation room exists.
- Schools are D-rated, which usually means shorter tenancies and higher turnover. Who's the typical renter profile here, and what's been the actual vacancy rate?
- What's the average days-on-market for RENTAL listings here right now (not sales)? A rising rental-DOM trend means longer vacancies and softer asking-rent achievability than the comps imply.
- What's the recent tenant-quality profile in this submarket — average credit score on applications, eviction rate, late-payment / NSF rate, and stable-employment percentage? A property-management company in the area should have these aggregated.
- How much new apartment / multifamily construction is in the pipeline within 1–3 miles? Heavy new supply (>2% of stock underway) typically softens rents 12–24 months out; light construction supports rent growth.
Investment metrics
- 1% rule
- 1.81% ✓
- Cap rate
- 15.42%
- Cash-on-cash
- 32.58%
- DSCR
- 2.45
- GRM
- 4.6
CMA / ARV
No comps found within radius.
Projected returns pro-forma
-3.0% appreciation · 3.0% rent growth · sell at horizon
- IRR
- 27.7%
- Equity multiple
- 2.15×
- Total profit
- $56,409
- Equity at exit
- $26,093
- IRR
- 35.2%
- Equity multiple
- 4.23×
- Total profit
- $158,341
- Equity at exit
- $15,131
Cash invested: $49,000 (down + closing). Projections, not guarantees.
Landlord ↔ Tenant lean methodology
- Overall (STATE)
- 90 Strongly Landlord-Friendly
- State Indiana
- 90 Strongly Landlord-Friendly · R+11
- County
- — inherits STATE
- City
- — inherits STATE
ZIP-level market 46750
- Home prices YoY
- -33.0%
- Active inventory
- 112
- Price-to-rent
- 13.4×
Monthly cashflow live
- Estimated rent
- $3,170 medium interval (Pro) →
- Mortgage (P&I)
- −$918
- Tax from tax record
- −$183 /mo · $2,198/yr
- Insurance
- −$73
- HOA
- −$0
- Vacancy / Maint / Mgmt
- −$666
- Net cashflow
- $1,330
Break-even live
Sensitivity live
| Price | -10% $1,430 | -5% $1,380 | +0% $1,330 | +5% $1,281 | +10% $1,231 |
|---|---|---|---|---|---|
| Rent | -10% $1,080 | -5% $1,205 | +0% $1,330 | +5% $1,456 | +10% $1,581 |
| Rate | -1.0pp $1,419 | -0.5pp $1,375 | base $1,330 | +0.5pp $1,285 | +1.0pp $1,239 |
3-unit breakdown (identical units grouped — click to expand)
| Units | Beds | Baths | Est. rent |
|---|---|---|---|
| 1× unit | 1 | 1 | $1,087 |
| 2× units | 2 | 1 | $2,084 |
| #2 | 2 | 1 | $1,042 |
| #3 | 2 | 1 | $1,042 |
| Total (3 units) | $3,170 | ||
UW: 25.0% down · 7.5% · 30yr · 1.5% tax · 5.0% vac · 8.0% maint · 8.0% mgmt
Financing live
Cash to close
- Down payment
- $43,750
- Closing costs
- $5,250
- Reserves months
- —
- Total cash needed
- —
Loan-product check · same deal, 3 products live
Conventional
25% down · 7.5% · 30yr
- Down + closing
- —
- Monthly P&I
- —
- Monthly cashflow
- —
- DSCR
- —
- Eligible?
- —
Personal DTI + credit; lowest rate.
DSCR
20% down · 8.5% · 30yr
- Down + closing
- —
- Monthly P&I
- —
- Monthly cashflow
- —
- DSCR
- —
- Eligible?
- —
No personal income docs; deal must DSCR.
Hard money
10% down · 12.0% · 12mo
- Down + closing
- —
- Monthly P&I
- —
- Monthly cashflow
- —
- DSCR
- —
- Eligible?
- —
Short-term bridge; refi at stabilization.
Listing history 27 events
-
2026-06-19days on market $175,000 Active 45 DOM
-
2026-06-18days on market $175,000 Active 44 DOM
-
2026-06-17days on market $175,000 Active 43 DOM
-
2026-06-16days on market $175,000 Active 42 DOM
-
2026-06-15days on market $175,000 Active 41 DOM
-
2026-06-14days on market $175,000 Active 39 DOM
-
2026-06-12days on market $175,000 Active 38 DOM
-
2026-06-09days on market $175,000 Active 35 DOM
-
2026-06-08pricedays on market $175,000 Active 34 DOM
-
2026-06-07days on market $189,900 Active 33 DOM
-
2026-06-05days on market $189,900 Active 30 DOM
-
2026-06-03days on market $189,900 Active 29 DOM
-
2026-06-02days on market $189,900 Active 28 DOM
-
2026-06-01days on market $189,900 Active 27 DOM
-
2026-05-31days on market $189,900 Active 26 DOM
-
2026-05-30days on market $189,900 Active 25 DOM
-
2026-05-21historical Active Under Contract
-
2026-05-05$189,900 Active
-
2025-03-09historical $825
-
2025-02-07price $825
-
2025-01-23price $850
-
2024-12-17price $895
-
2024-11-01$925
-
2023-11-29historical $650
-
2023-11-23price $650
-
2023-11-11price $675
-
2023-10-20$695
ⓘ Source: listings_history table (triggers on properties + properties_extension) + one-shot
backfill from property_details.listing_events for pre-trigger history.
Tax reassessment forecast IN · Partial reset (capped growth)
- Current annual tax
- $2,198 · $183/mo
- Projected year-2 tax
- $2,198 · $183/mo
- Expected delta
- $0/yr ($0/mo · 0.0%)
ⓘ Screening estimate from a state-policy table — verify with the county assessor before closing.
Climate risk First Street
- Flood 1/10 Low FEMA zone X (unshaded) · 0% chance over 30 yrs
- Wildfire 1/10 Low
- Heat 3/10 Moderate 7 d/yr ≥101°F today · 17 d/yr by 30 yrs out
- Wind 2/10 Low
- Air quality 3/10 Moderate 1 unhealthy d/yr today · 3 by 30 yrs out
Nearby sold comps map
Loading sold comps map…
Walkable amenities ~0.75 mi
Loading nearby amenities…
Taxation est. · year 1
- Rental income
- $38,040
- − Mortgage interest
- −$9,803
- − Property taxes
- −$2,198
- − Insurance
- −$875
- − Repairs & maintenance
- −$3,043
- − Management
- −$3,043
- − Depreciation
- −$5,091
- Taxable income
- $13,987
- Est. tax owed @ 24.0%
- −$3,357
- After-tax cash flow
- $12,609/yr
For passive investors: Depreciation is non-cash, so a rental often shows a tax loss while cash-flowing — sheltering income. Rental losses are passive: they offset passive income freely, and up to $25,000/yr can offset ordinary (W-2) income if you actively participate and your MAGI is under $100k (phasing out to $0 by $150k); unused losses carry forward. On sale, claimed depreciation is recaptured at up to 25%, and gains may owe capital-gains tax (a 1031 exchange can defer both). Figures are a year-1 estimate at your 24.0% rate — not tax advice; consult a CPA.
Schools (NCES district)
- District
- Huntington County Community School Corporation
- NCES district ID
- 1804710
- Math proficiency
- 34% ▼ -6.00%
- Reading proficiency
- 39% ▼ -10.00%
- Median HH income
- $47,010
- Composite
- 31.29/100
- National rank
- #6013
- State rank
- #176 of 301 in IN
Livability — Huntington
- Score
- 69/100
- State rank
- #193
- US rank
- #8771
Category grades
Schools grade is shown separately in the Schools card above.
Census & demographics
- Census place
- Huntington, IN
- City population
- 27,341
- Population (ZIP)
- 27,341
Population outlook (Huntington County) Hauer SSP2
- Today (2025)
- 35,613 people
- By 2030
- 34,759 · -2.4%
- By 2040
- 32,682 · -8.2%
- By 2050
- 30,495 · -14.4%
- By 2075
- 26,298 · -26.2%
- By 2100
- 22,653 · -36.4%
Race, ethnicity, and origin ACS 2023
- Neighborhood character
- Predominantly White (93%)
- Race & ethnicity
- White 93% Hispanic / Latino 3% Two or more races 2% Black 1%
- Common ancestry
- Italian 2% Slovak 2% Romanian 2%
- Foreign-born
- 2% · China, Canada
- Languages at home
- 96% English-only · Spanish 2% Chinese 1% German/W. Germanic 1%
Political lean MEDSL · Huntington
- 2024 margin
- Solid R (+48.4) · D 24.9% · R 73.3% · Other 1.8%
- 2008→2024 swing
- -21.2pp toward R · 2008: -27.2pp · 2024: -48.4pp
- All cycles
- 2024: R+48.4 2020: R+49.9 2016: R+51.0 2012: R+39.8 2008: R+27.2
Not yet ingested
- Civics
- —
Market trends
- HPI YoY
- ▼ -106.89%
- Current HPI
- 216.5969
- Rent YoY
- —
- Metro
- —
- State GDP YoY
- ▲ 2.90%
- F500 in state
- 18
Industry mix (Fortune 500 HQ in IN)
| Industry | F500 HQs | Revenue |
|---|---|---|
| Industrial Machinery | 2 | $37B |
|
||
| Healthcare | 1 | $177B |
|
||
| Pharmaceuticals | 1 | $45B |
|
||
| Metals / Steel | 1 | $18B |
|
||
| Agriculture | 1 | $17B |
|
||
| Packaging | 1 | $12B |
|
||
Price history
11 events — show timeline
- 2026-05-21 Contingent — IRMLS
- 2026-05-05 Listed $189,900 IRMLS
- 2025-03-09 Rental Removed $825 APPFOLIO
- 2025-02-07 Price Changed $825 APPFOLIO
- 2025-01-23 Price Changed $850 APPFOLIO
- 2024-12-17 Price Changed $895 APPFOLIO
- 2024-11-01 Listed for Rent $925 APPFOLIO
- 2023-11-29 Rental Removed $650 APPFOLIO
- 2023-11-23 Price Changed $650 APPFOLIO
- 2023-11-11 Price Changed $675 APPFOLIO
- 2023-10-20 Listed for Rent $695 APPFOLIO
Property tax history
-2.5%/yrLatest (2024): $2,198 · +0.0% YoY. Source: county tax records.
Cash-flow waterfall
monthlySold comps — $/sqft
last 12 mo · ≤1 miLoading sold comps…