1625 Letty Ln · Corpus Christi, TX
Flood risk No data
- FEMA flood zone
- —
- Chance of flooding over 30 yrs
- —
- Est. flood insurance / yr
- —
Fire risk No data
- Est. fire insurance / yr
- —
Heat risk No data
- Hot days now (above threshold)
- —
- Hot days in 30 yrs
- —
Wind risk No data
- Chance of severe wind over 30 yrs
- —
Air-quality risk No data
- Unhealthy air days now
- —
- Unhealthy air days in 30 yrs
- —
Risk factors via First Street. Map © Google.
Why this score? — see what drove the C+ grade
The composite is a weighted blend of 9 inputs, each scored 0–100. Each bar is that input's sub-score; the figure is the points it added to the 100-point composite (weight × sub-score).
- Cash flow +21.6/30.0
- ARV discount +15.0/15.0
- DSCR +6.9/10.0
- 1% rule +5.7/10.0
- Schools +5.0/10.0
- Livability +3.9/5.0
- Rent growth +2.4/5.0
- Condition / age +2.2/5.0
- Appreciation +0.0/10.0
$237,400
🖨 Deal sheet 📄 Offer letter ✓ Due diligence
Listing remarks
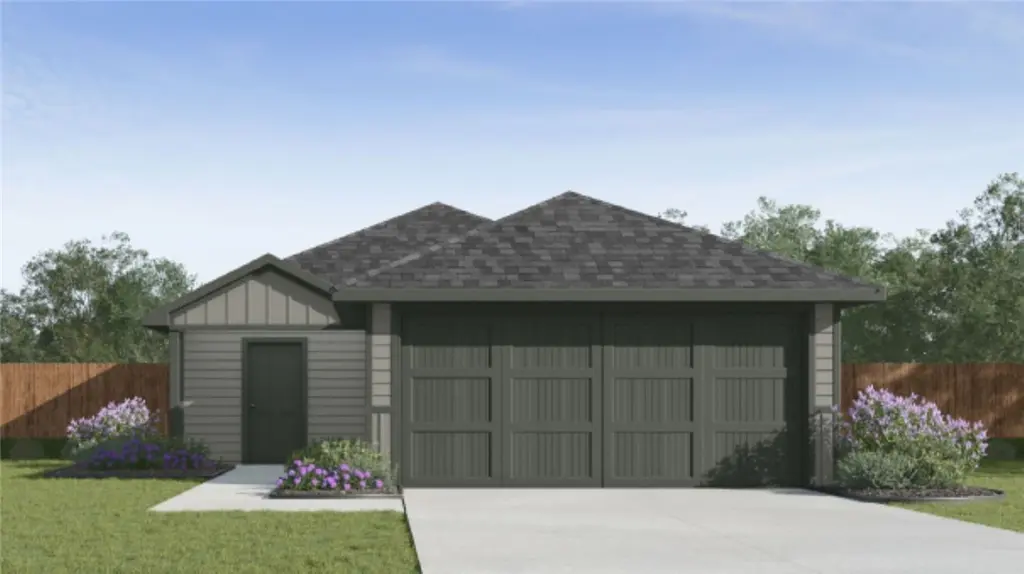
Welcome to the Atlanta, a home that features 2 classic front exteriors, this 3 bedroom, 2 bathroom home also offers 1156 square feet of living space and a 2-car garage. A front porch (per plan) welcomes you into the home and opens to the gourmet kitchen which includes granite counter tops, quality cabinets, stainless steel appliances and an open concept floorplan with the kitchen flowing seamlessly into the dining room and living room. The main bedroom has an attractive ensuite bathroom that features a granite vanity countertop and quality cabinetry. Enjoy additional storage with a spacious walk-in closet located off of the primary bathroom. Your secondary bedrooms all feature quality carpe
Key facts
- Gourmet kitchen
- Granite counter tops
- Quality cabinets
Tags
Property features AI
Exterior
- Parking: Attached 2-car garage; Concrete driveway/parking
- Utilities: Public water; Public sewer; Utilities available
- Home design: Single-story; Under construction
- Construction: HardiPlank exterior; Shingle roof; Slab foundation; Built recently (currently under construction)
- Exterior features: Wood fencing; No additional exterior features listed
Interior
- Kitchen: Dishwasher; Gas oven; Gas range; Microwave
- Flooring: Carpet; Vinyl
- Bathrooms: 2 full bathrooms
- Heating & cooling: Central heating (electric); Central air conditioning
- Interior features: Open floor plan; Kitchen island
- Laundry & utility: Washer hookup; Dryer hookup
Neighborhood map
What this means for you Summary
Snapshot
- This is a 3-bed/2.0-bath single-family listed at $237k. Condition is rated fair.
Deal economics
- At list price, monthly cash flow is $361 ($4k/yr) — positive.
- The deal already cash-flows at list — no discount required.
- Meets the 1% rule at list price ($3k rent vs $237k).
- Cap rate 8.1% vs local median 3.6% in Corpus Christi — top-decile yield for the area; either an underpriced asset or a hidden risk that comps aren't pricing in. Stress-test before assuming the spread holds.
Location & tenants
- Location reads 78/100 on livability (#66 in TX, #2,404 nationally) — a middle-class / working-renter tenant base. Strengths: commute A+, cost of living A+, housing A+; Watch: crime F.
- Market conditions: Rents soft (-0.6%/yr); 685 active listings in the ZIP; 4 comparable units currently listed for rent nearby; rentals at typical pace (median 21d on market — plan ~3-4 weeks tenant-placement turnaround); solid renter incomes; 1,397 units permitted in Nueces County in 2024 (47 in 5+ unit buildings).
- This rent runs 33% of the median local income ($92k/yr) — at the standard rent-burdened threshold; future hikes will face affordability resistance.
Forward outlook
- Local home prices are declining (-3.0%/yr); year-one equity from $2k of loan paydown is wiped out by about $7k of value loss. Plan a longer hold.
- Nueces County population projected at +36% by 2050 — long-run rental-demand tailwind backs the buy-and-hold thesis.
Negotiation context
- Only 14 days on market — expect competitive offers; lowballing is unlikely to land.
Questions for the listing agent
- Have any recent inspections been done? Can we get a copy of the seller's disclosures and any deferred-maintenance estimates?
- Is there a deadline driving the sale (1031 exchange, divorce, estate, relocation)? That informs how much negotiation room exists.
- Crime grade is F in this area — have there been break-ins, vandalism, or insurance claims at this property in the last 3 years? What carrier currently insures it and at what premium?
- What's the average days-on-market for RENTAL listings here right now (not sales)? A rising rental-DOM trend means longer vacancies and softer asking-rent achievability than the comps imply.
- What's the recent tenant-quality profile in this submarket — average credit score on applications, eviction rate, late-payment / NSF rate, and stable-employment percentage? A property-management company in the area should have these aggregated.
- How much new for-sale + rental construction is in the pipeline within 1–3 miles? Heavy new supply typically softens prices + rents 12–24 months out; constrained supply supports both.
Investment metrics
- 1% rule
- 1.07% ✓
- Cap rate
- 8.12%
- Cash-on-cash
- 6.52%
- DSCR
- 1.29
- GRM
- 7.8
CMA / ARV
- ARV (on-the-fly)
- $384,948
- Comps found
- 3
Show comp detail 3 sales within ~0.75 mi
| Address | Dist | Beds/Ba | Sqft | Sold | Price | $/sf | Match |
|---|---|---|---|---|---|---|---|
| 3538 Shore Dr | 0.61mi | 3/2.0 | 1,045 (-10%) | 4mo | $225,000 | $215 | 52 |
| 4017 Laguna Shrs | 0.73mi | 3/1.5 | 1,140 (-1%) | 22mo | $380,000 | $333 | 44 |
| 133 Clearview Dr | 0.63mi | 2/2.0 (-1) | 1,055 (-9%) | 14mo | $366,900 | $348 | 39 |
Match score weights: distance 35% · size 25% · config 20% · recency 20%. Top-matched comps best support the ARV.
Projected returns pro-forma
-3.0% appreciation · 0.0% rent growth · sell at horizon
- IRR
- -9.7%
- Equity multiple
- 0.66×
- Total profit
- $-22,844
- Equity at exit
- $35,397
- IRR
- -5.0%
- Equity multiple
- 0.72×
- Total profit
- $-18,804
- Equity at exit
- $20,526
Cash invested: $66,472 (down + closing). Projections, not guarantees.
Landlord ↔ Tenant lean methodology
- Overall (STATE)
- 87 Strongly Landlord-Friendly
- State Texas
- 87 Strongly Landlord-Friendly · R+5
- County
- — inherits STATE
- City
- — inherits STATE
ZIP-level market 78418
- Rents YoY
- -0.6%
- Active inventory
- 685
- Price-to-rent
- 7.8×
Monthly cashflow live
- Estimated rent
- $2,534 medium interval (Pro) →
- Mortgage (P&I)
- −$1,245
- Tax est. 1.5%
- −$297 /mo · $3,561/yr
- Insurance
- −$99
- HOA
- −$0
- Vacancy / Maint / Mgmt
- −$532
- Net cashflow
- $361
Break-even live
UW: 25.0% down · 7.5% · 30yr · 1.5% tax · 5.0% vac · 8.0% maint · 8.0% mgmt
Financing live
Cash to close
- Down payment
- $59,350
- Closing costs
- $7,122
- Reserves months
- —
- Total cash needed
- —
Loan-product check · same deal, 3 products live
Conventional
25% down · 7.5% · 30yr
- Down + closing
- —
- Monthly P&I
- —
- Monthly cashflow
- —
- DSCR
- —
- Eligible?
- —
Personal DTI + credit; lowest rate.
DSCR
20% down · 8.5% · 30yr
- Down + closing
- —
- Monthly P&I
- —
- Monthly cashflow
- —
- DSCR
- —
- Eligible?
- —
No personal income docs; deal must DSCR.
Hard money
10% down · 12.0% · 12mo
- Down + closing
- —
- Monthly P&I
- —
- Monthly cashflow
- —
- DSCR
- —
- Eligible?
- —
Short-term bridge; refi at stabilization.
Rent comps 4 comps
| Address | Beds | Baths | Sqft | Rent | $/sqft | DOM | Units | Dist |
|---|---|---|---|---|---|---|---|---|
| 3942 Laguna Shores Rd Corpus Christi, TX | 3.0 | 2.0 | 1500 | $3,800 | $2.53 | 13d | 1 | 0.73mi |
| 4141 Whiteley Dr Unit 1 Corpus Christi, TX | 2.0 | 1.5 | 900 | $1,295 | $1.44 | 21d | 1 | 0.92mi |
| 3021 Laguna Shores Rd Corpus Christi, TX | 2.0 | 2.0 | 1440 | $2,500 | $1.74 | 43d | 1 | 1.04mi |
| 557 Yorktown Blvd Corpus Christi, TX | 3.0–5.0 | 2.0 | 1714 | $2,337 | $1.36 | 13d | 1 | 1.35mi |
Listing history 11 events
-
2026-06-18days on market $237,400 Active 14 DOM
-
2026-06-17days on market $237,400 Active 13 DOM
-
2026-06-16days on market $237,400 Active 12 DOM
-
2026-06-15days on market $237,400 Active 11 DOM
-
2026-06-14days on market $237,400 Active 9 DOM
-
2026-06-13days on market $237,400 Active 8 DOM
-
2026-06-10days on market $237,400 Active 6 DOM
-
2026-06-09days on market $237,400 Active 5 DOM
-
2026-06-08days on market $237,400 Active 4 DOM
-
2026-06-07remarks 699-char remark
-
2026-06-07$237,400 Active 3 DOM
ⓘ Source: listings_history table (triggers on properties + properties_extension) + one-shot
backfill from property_details.listing_events for pre-trigger history.
Nearby sold comps map
Loading sold comps map…
Walkable amenities ~0.75 mi
Loading nearby amenities…
Taxation est. · year 1
- Rental income
- $30,409
- − Mortgage interest
- −$13,298
- − Property taxes
- −$3,561
- − Insurance
- −$1,187
- − Repairs & maintenance
- −$2,433
- − Management
- −$2,433
- − Depreciation
- −$6,906
- Taxable income
- $592
- Est. tax owed @ 24.0%
- −$142
- After-tax cash flow
- $4,194/yr
For passive investors: Depreciation is non-cash, so a rental often shows a tax loss while cash-flowing — sheltering income. Rental losses are passive: they offset passive income freely, and up to $25,000/yr can offset ordinary (W-2) income if you actively participate and your MAGI is under $100k (phasing out to $0 by $150k); unused losses carry forward. On sale, claimed depreciation is recaptured at up to 25%, and gains may owe capital-gains tax (a 1031 exchange can defer both). Figures are a year-1 estimate at your 24.0% rate — not tax advice; consult a CPA.
Condition & rehab AI · 8 photos
The home is in fair condition with some cosmetic repairs needed, such as painting the interior walls and maintaining the HVAC and mechanical systems. The home has a good exterior and roof, and the kitchen and bathrooms are in average condition.
Repairs flagged
- Minor Paint — The paint quality on the interior walls is not clear from the photos.
Value-add opportunities
- Resale Paint the interior walls — Painting the interior walls can improve the home's appearance and make it more appealing to potential buyers.
- Rental Inspect and clean the HVAC and mechanical systems — Maintaining the HVAC and mechanical systems can ensure the home is energy-efficient and reduce maintenance costs for potential renters.
Renovation cost estimate screening
| Repair item | Severity | Est. cost |
|---|---|---|
| Paint · The paint quality on the interior walls is not clear from the photos. | Minor | $500–3,000 |
| Total estimated repair cost · 1 items | $500–3,000 |
Value-add ROI direction
- Resale Paint the interior walls — Painting the interior walls can improve the home's appearance and make it more appealing to potential buyers. ↑
- Rental Inspect and clean the HVAC and mechanical systems — Maintaining the HVAC and mechanical systems can ensure the home is energy-efficient and reduce maintenance costs for potential renters. ↑
ⓘ Cost ranges are severity-bucket heuristics (US national rule-of-thumb). Get contractor quotes + a written scope before underwriting a rehab budget.
Schools (NCES district)
No district data.
Livability — Corpus Christi
- Score
- 78/100
- State rank
- #66
- US rank
- #2404
Category grades
Schools grade is shown separately in the Schools card above.
Census & demographics
- Census place
- Corpus Christi, TX
- County
- Nueces County · 296,836 people
- City population
- 296,836
- Metro
- Corpus Christi, TX
- Population (ZIP)
- 29,790
- Household income
- $92,445
- Rent vs Own
- Severe rent burden
- 808.0
Population outlook (Nueces County) Hauer SSP2
- Today (2025)
- 418,037 people
- By 2030
- 447,123 · +7.0%
- By 2040
- 505,911 · +21.0%
- By 2050
- 567,522 · +35.8%
- By 2075
- 729,686 · +74.6%
- By 2100
- 847,087 · +102.6%
Race, ethnicity, and origin ACS 2023
- Neighborhood character
- Majority White (61%)
- Race & ethnicity
- White 61% Hispanic / Latino 29% Two or more races 19% Asian 3% Black 3%
- Hispanic origin (detail)
- Mexican 25%
- Common ancestry
- Romanian 2% Lithuanian 2% Slovak 2%
- Foreign-born
- 7% · Canada, China
- Languages at home
- 83% English-only · Spanish 14% Tagalog/Filipino 2%
Political lean MEDSL · Nueces
- 2024 margin
- R (+11.5) · D 43.8% · R 55.3%
- 2008→2024 swing
- -7.1pp toward R · 2008: -4.4pp · 2024: -11.5pp
- All cycles
- 2024: R+11.5 2020: R+2.9 2016: R+1.5 2012: R+3.2 2008: R+4.4
Not yet ingested
- Civics
- —
Market trends
- HPI YoY
- ▼ -168.81%
- Current HPI
- 193.902
- Rent YoY
- ▼ -0.57%
- Metro
- Corpus Christi, TX
- State GDP YoY
- ▲ 3.95%
- F500 in state
- 110
Industry mix (Fortune 500 HQ in TX)
| Industry | F500 HQs | Revenue |
|---|---|---|
| Energy | 16 | $1,198B |
|
||
| Technology | 5 | $198B |
|
||
| Engineering / Construction | 4 | $72B |
|
||
| Energy Services | 3 | $60B |
|
||
| Utilities | 3 | $41B |
|
||
| Healthcare | 2 | $330B |
|
||
Price history
1 event — show timeline
- 2026-06-04 Listed $237,400 CBMLS
Cash-flow waterfall
monthlySold comps — $/sqft
last 12 mo · ≤1 miLoading sold comps…