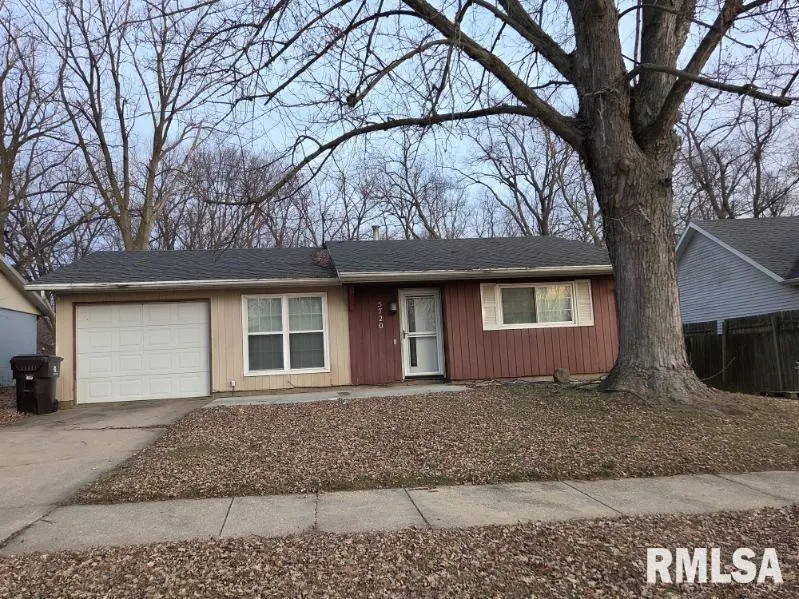
5720 N Frostwood Pkwy · Peoria, IL
Flood risk 1/10 · Minimal
- FEMA flood zone
- X
- Chance of flooding over 30 yrs
- 0.0%
- Est. flood insurance / yr
- $507 – $1,088
Fire risk 1/10 · Minimal
- Est. fire insurance / yr
- $804 – $1,492
Heat risk 3/10 · Minor
- Hot days now (above 104°F)
- 7 days/yr
- Hot days in 30 yrs
- 18 days/yr
Wind risk 2/10 · Minimal
- Chance of severe wind over 30 yrs
- 1.0%
Air-quality risk 2/10 · Minimal
- Unhealthy air days now
- 1 days/yr
- Unhealthy air days in 30 yrs
- 2 days/yr
Risk factors via First Street. Map © Google.
Why this score? — see what drove the C- grade
The composite is a weighted blend of 9 inputs, each scored 0–100. Each bar is that input's sub-score; the figure is the points it added to the 100-point composite (weight × sub-score).
- Cash flow +26.0/30.0
- DSCR +8.7/10.0
- 1% rule +7.4/10.0
- Livability +3.7/5.0
- Rent growth +2.5/5.0
- Condition / age +2.5/5.0
- Schools +1.1/10.0
- ARV discount +0.0/15.0
- Appreciation +0.0/10.0
$114,900
🖨 Deal sheet 📄 Offer letter ✓ Due diligence
Listing remarks MLS
This three-bedroom Ranch is perfect if you're looking for a low maintenance place. This home features a spacious living room, a kitchen with ample cabinet space, and a separate laundry room. One-car attached garage,large backyard and a shed for additional storage. Schedule your showing today. All measurements are approx.& not deemed reliable.
Key facts
- Large backyard
- Ample cabinet space
- Spacious living room
Tags
Neighborhood map
What this means for you Summary
Snapshot
- This is a 3-bed/1.0-bath single-family listed at $115k.
Deal economics
- At list price, monthly cash flow is $286 ($3k/yr) — positive.
- The deal already cash-flows at list — no discount required.
- Meets the 1% rule at list price ($1k rent vs $115k).
- Recommended offer: $101k (12.0% below list) — sets the bar for market timing.
- Cap rate 9.3% vs local median 5.6% in Peoria — top-decile yield for the area; either an underpriced asset or a hidden risk that comps aren't pricing in. Stress-test before assuming the spread holds.
Location & tenants
- Location reads 73/100 on livability (#270 in IL) — a middle-class / working-renter tenant base. Strengths: commute A+, cost of living A+, housing A+; Watch: employment D+, schools F, crime F.
- Peoria SD 150 (urban): math 11% / reading 14% proficiency, ranked #554 of 620 in IL (top 89%) — low school quality limits family demand, transient renter base, plan for 1-2y turnover; 70% free/reduced lunch — lower-income household profile, screen leases tightly.
- Market conditions: 127 active listings in the ZIP; 9 comparable units currently listed for rent nearby; rentals leasing fast (median 14d on market — plan ~1-2 weeks tenant-placement turnaround); solid renter incomes; 73 units permitted in Peoria County in 2024 (0 in 5+ unit buildings).
Forward outlook
- Local home prices are declining (-3.0%/yr); year-one equity from $794 of loan paydown is wiped out by about $3k of value loss. Plan a longer hold.
- Peoria County population projected at -11% by 2050 — secular population decline; favor cash flow + early exit over multi-decade hold.
Negotiation context
- It's been on market 132 days — a 12% lower offer ($101k) is reasonable based on typical stale-listing flexibility.
- 3 sale attempts since 17y ago with the ask held roughly flat each time — persistent listings suggest the price (not the market) is what's stuck; bring a comps-based counter.
- Current owner paid $60k; list at $115k implies a 90% gain — meaningful room to come down on a strong offer.
Questions for the listing agent
- It's been on market 132 days. Have you received any prior offers? Is the seller open to a 12% concession, seller financing, or rate buy-down credit?
- Built in 1972 — when were the roof, HVAC, electrical panel, plumbing, and water heater last replaced?
- Why hasn't it sold? Are there any deal-killer items the seller is aware of (foundation, flood, title, zoning, code violations)?
- Is there a deadline driving the sale (1031 exchange, divorce, estate, relocation)? That informs how much negotiation room exists.
- Schools are F-rated, which usually means shorter tenancies and higher turnover. Who's the typical renter profile here, and what's been the actual vacancy rate?
- Crime grade is F in this area — have there been break-ins, vandalism, or insurance claims at this property in the last 3 years? What carrier currently insures it and at what premium?
- What's the average days-on-market for RENTAL listings here right now (not sales)? A rising rental-DOM trend means longer vacancies and softer asking-rent achievability than the comps imply.
- What's the recent tenant-quality profile in this submarket — average credit score on applications, eviction rate, late-payment / NSF rate, and stable-employment percentage? A property-management company in the area should have these aggregated.
- How much new for-sale + rental construction is in the pipeline within 1–3 miles? Heavy new supply typically softens prices + rents 12–24 months out; constrained supply supports both.
Investment metrics
- 1% rule
- 1.24% ✓
- Cap rate
- 9.28%
- Cash-on-cash
- 10.66%
- DSCR
- 1.47
- GRM
- 6.7
CMA / ARV
- ARV (median comp)
- $89,773
- List price
- $114,900
- Delta
- 27.99%
- Verdict
- OVERPRICED
- Comps
- 13 within 1.0 mi
Show comp detail 12 sales within ~0.75 mi
| Address | Dist | Beds/Ba | Sqft | Sold | Price | $/sf | Match |
|---|---|---|---|---|---|---|---|
| 5820 N Frostwood Pkwy | 0.08mi | 3/1.0 | 919 (0%) | 2mo | $95,000 | $103 | 94 |
| 5807 N Andover Ct | 0.06mi | 3/1.0 | 919 (0%) | 9mo | $136,500 | $149 | 89 |
| 4020 W Virden Ct | 0.20mi | 3/1.0 | 942 (+2%) | 7mo | $99,900 | $106 | 81 |
| 4017 W Courtland St | 0.32mi | 3/1.0 | 903 (-2%) | 3mo | $112,000 | $124 | 80 |
| 4028 W Hillmont Rd | 0.35mi | 3/1.0 | 919 (0%) | 10mo | $114,000 | $124 | 76 |
| 4023 W Brighton Ave | 0.25mi | 3/1.0 | 875 (-5%) | 6mo | $80,000 | $91 | 75 |
| 6110 N Idlewhile Dr | 0.32mi | 3/1.0 | 929 (+1%) | 10mo | $129,900 | $140 | 75 |
| 3917 W Brighton Ave | 0.34mi | 3/1.0 | 949 (+3%) | 6mo | $92,000 | $97 | 74 |
| 3724 W Verner Dr | 0.45mi | 3/1.0 | 875 (-5%) | 0mo | $142,500 | $163 | 70 |
| 3703 W Verner Dr | 0.49mi | 3/1.0 | 875 (-5%) | 1mo | $150,000 | $171 | 68 |
| 5917 N Sedley St | 0.34mi | 2/1.0 (-1) | 825 (-10%) | 5mo | $63,000 | $76 | 58 |
| 4022 W Creighton Ter | 0.37mi | 3/1.0 | 1,025 (+12%) | 8mo | $145,900 | $142 | 57 |
Match score weights: distance 35% · size 25% · config 20% · recency 20%. Top-matched comps best support the ARV.
Projected returns pro-forma
-3.0% appreciation · 3.0% rent growth · sell at horizon
- IRR
- -0.3%
- Equity multiple
- 0.99×
- Total profit
- $-374
- Equity at exit
- $17,132
- IRR
- 9.4%
- Equity multiple
- 1.72×
- Total profit
- $23,306
- Equity at exit
- $9,934
Cash invested: $32,172 (down + closing). Projections, not guarantees.
Landlord ↔ Tenant lean methodology
- Overall (STATE)
- 43 Moderately Tenant-Leaning
- State Illinois
- 43 Moderately Tenant-Leaning · D+7
- County
- — inherits STATE
- City
- — inherits STATE
ZIP-level market 61615
- Home prices YoY
- -32.2%
- Active inventory
- 127
- Price-to-rent
- 6.7×
Monthly cashflow live
- Estimated rent
- $1,426 high interval (Pro) →
- Mortgage (P&I)
- −$603
- Tax from tax record
- −$190 /mo · $2,286/yr
- Insurance
- −$48
- HOA
- −$0
- Vacancy / Maint / Mgmt
- −$299
- Net cashflow
- $286
Break-even live
UW: 25.0% down · 7.5% · 30yr · 1.5% tax · 5.0% vac · 8.0% maint · 8.0% mgmt
Financing live
Cash to close
- Down payment
- $28,725
- Closing costs
- $3,447
- Reserves months
- —
- Total cash needed
- —
Loan-product check · same deal, 3 products live
Conventional
25% down · 7.5% · 30yr
- Down + closing
- —
- Monthly P&I
- —
- Monthly cashflow
- —
- DSCR
- —
- Eligible?
- —
Personal DTI + credit; lowest rate.
DSCR
20% down · 8.5% · 30yr
- Down + closing
- —
- Monthly P&I
- —
- Monthly cashflow
- —
- DSCR
- —
- Eligible?
- —
No personal income docs; deal must DSCR.
Hard money
10% down · 12.0% · 12mo
- Down + closing
- —
- Monthly P&I
- —
- Monthly cashflow
- —
- DSCR
- —
- Eligible?
- —
Short-term bridge; refi at stabilization.
Rent comps 9 comps
| Address | Beds | Baths | Sqft | Rent | $/sqft | DOM | Units | Dist |
|---|---|---|---|---|---|---|---|---|
| 5505 N Frostwood Pkwy Peoria, IL | 2.0 | 2.0 | 1030 | $1,490 | $1.45 | 13d | 1 | 0.25mi |
| 4105 W Hollow Creek Dr Peoria, IL | 2.0 | 2.0 | 1121 | $1,300 | $1.16 | 13d | 3 | 0.74mi |
| 6900 N Summershade Cir Peoria, IL | 1.0–2.0 | 1.0–2.0 | 832 | $1,340 | $1.61 | 13d | 3 | 1.06mi |
| 5605 N Withershin Pt Unit 1 Peoria, IL | 2.0 | 2.0 | 1000 | $1,335 | $1.33 | 13d | 1 | 1.08mi |
| 5605 N Withershin Pt Peoria, IL | 2.0 | 2.0 | 1000 | $1,335 | $1.33 | 13d | 1 | 1.08mi |
| 2979 W Cannes Dr Peoria, IL | 1.0–2.0 | 1.0–1.5 | 800 | $1,150 | $1.44 | 13d | 1 | 1.11mi |
| 5711 W Ridgecrest Dr Peoria, IL | 1.0–2.0 | 1.0–2.0 | 875 | $1,095 | $1.25 | 13d | 8 | 1.12mi |
| 2913 W Cannes Dr Unit C Peoria, IL | 2.0 | 2.0 | 884 | $1,150 | $1.30 | 43d | 1 | 1.17mi |
| 2800 W War Memorial Dr Peoria, IL | 2.0 | 1.5 | 950 | $949 | $1.00 | 13d | 3 | 1.25mi |
Listing history 6 events
-
2026-03-31price $114,900 348-char remark
Show marketing remark (348 chars)
This three-bedroom Ranch is perfect if you're looking for a low maintenance place. This home features a spacious living room, a kitchen with ample cabinet space, and a separate laundry room. One-car attached garage,large backyard and a shed for additional storage. Schedule your showing today. All measurements are approx.& not deemed reliable.
-
2026-01-09$119,900 Active 348-char remark
Show marketing remark (348 chars)
This three-bedroom Ranch is perfect if you're looking for a low maintenance place. This home features a spacious living room, a kitchen with ample cabinet space, and a separate laundry room. One-car attached garage,large backyard and a shed for additional storage. Schedule your showing today. All measurements are approx.& not deemed reliable.
-
2016-06-24soldstatus $60,500 341-char remark
Show marketing remark (341 chars)
Nice 3 bedroom low maintenance ranch style home in Richwoods School District, convenient location close to shopping, Shoppes of Grand Prairie, restaurants, easy access to interstate, hospitals. New since 2009: Kitchen cabinets, front door, all interior doors, windows. Shed new 2015. Travertine kitchen floor; garage door & opener- 2010.
-
2016-04-27$69,900 341-char remark
Show marketing remark (341 chars)
Nice 3 bedroom low maintenance ranch style home in Richwoods School District, convenient location close to shopping, Shoppes of Grand Prairie, restaurants, easy access to interstate, hospitals. New since 2009: Kitchen cabinets, front door, all interior doors, windows. Shed new 2015. Travertine kitchen floor; garage door & opener- 2010.
-
2009-10-29soldstatus $45,900
-
2009-08-14$44,900
ⓘ Source: listings_history table (triggers on properties + properties_extension) + one-shot
backfill from property_details.listing_events for pre-trigger history.
Tax reassessment forecast IL · Partial reset (capped growth)
- Current annual tax
- $2,286 · $190/mo
- Projected year-2 tax
- $2,447 · $204/mo
- Expected delta
- +$161/yr (+$13/mo · 7.1%)
ⓘ Screening estimate from a state-policy table — verify with the county assessor before closing.
Climate risk First Street
- Flood 1/10 Low FEMA zone X · 0% chance over 30 yrs
- Wildfire 1/10 Low
- Heat 3/10 Moderate 7 d/yr ≥104°F today · 18 d/yr by 30 yrs out
- Wind 2/10 Low 100% chance of damaging wind over 30 yrs
- Air quality 2/10 Low 1 unhealthy d/yr today · 2 by 30 yrs out
Nearby sold comps map
Loading sold comps map…
Walkable amenities ~0.75 mi
Loading nearby amenities…
Taxation est. · year 1
- Rental income
- $17,112
- − Mortgage interest
- −$6,436
- − Property taxes
- −$2,286
- − Insurance
- −$574
- − Repairs & maintenance
- −$1,369
- − Management
- −$1,369
- − Depreciation
- −$3,343
- Taxable income
- $1,735
- Est. tax owed @ 24.0%
- −$417
- After-tax cash flow
- $3,011/yr
For passive investors: Depreciation is non-cash, so a rental often shows a tax loss while cash-flowing — sheltering income. Rental losses are passive: they offset passive income freely, and up to $25,000/yr can offset ordinary (W-2) income if you actively participate and your MAGI is under $100k (phasing out to $0 by $150k); unused losses carry forward. On sale, claimed depreciation is recaptured at up to 25%, and gains may owe capital-gains tax (a 1031 exchange can defer both). Figures are a year-1 estimate at your 24.0% rate — not tax advice; consult a CPA.
Schools (NCES district)
- District
- Peoria SD 150
- NCES district ID
- 1731230
- Math proficiency
- 11% ▼ -5.00%
- Reading proficiency
- 14% ▼ -4.00%
- Median HH income
- $41,951
- Composite
- 10.92/100
- National rank
- #9751
- State rank
- #554 of 620 in IL
Livability — Peoria
- Score
- 73/100
- State rank
- #270
- US rank
- #5096
Category grades
Schools grade is shown separately in the Schools card above.
Census & demographics
- Census place
- Peoria, IL
- County
- Peoria County · 120,495 people
- City population
- 114,670
- Metro
- Peoria, IL
- Population (ZIP)
- 23,523
- Household income
- $79,817
- Rent vs Own
- Severe rent burden
- 833.0
Population outlook (Peoria County) Hauer SSP2
- Today (2025)
- 183,007 people
- By 2030
- 179,643 · -1.8%
- By 2040
- 171,782 · -6.1%
- By 2050
- 163,508 · -10.7%
- By 2075
- 140,178 · -23.4%
- By 2100
- 114,493 · -37.4%
Race, ethnicity, and origin ACS 2023
- Neighborhood character
- Predominantly White (72%)
- Race & ethnicity
- White 72% Asian 10% Black 8% Hispanic / Latino 7% Two or more races 5%
- Hispanic origin (detail)
- Mexican 5%
- Common ancestry
- Italian 3% Romanian 3% Lithuanian 2%
- Foreign-born
- 13% · China, Canada, Jamaica
- Languages at home
- 83% English-only · Other Indo-European 4% Spanish 4% Chinese 3%
Political lean MEDSL · Peoria
- 2024 margin
- Toss-up / Even · D 51.5% · R 46.9% · Other 1.6%
- 2008→2024 swing
- -9.2pp toward R · 2008: 13.9pp · 2024: 4.7pp
- All cycles
- 2024: D+4.7 2020: D+6.3 2016: D+2.8 2012: D+4.4 2008: D+13.9
Not yet ingested
- Civics
- —
Market trends
- HPI YoY
- ▼ -79.30%
- Current HPI
- 166.9745
- Rent YoY
- —
- Metro
- Peoria, IL
- State GDP YoY
- ▲ 1.59%
- F500 in state
- 60
Industry mix (Fortune 500 HQ in IL)
| Industry | F500 HQs | Revenue |
|---|---|---|
| Insurance | 4 | $201B |
|
||
| Consumer Goods | 4 | $87B |
|
||
| Industrial Machinery | 3 | $64B |
|
||
| Healthcare | 2 | $55B |
|
||
| Retail / Pharmacy | 1 | $148B |
|
||
| Agriculture / Food | 1 | $86B |
|
||
Price history
+155.9% since first listed6 events — show timeline
- 2026-03-31 Price Changed $114,900 RMLSA as Distributed by MLS Grid
- 2026-01-09 Listed $119,900 RMLSA as Distributed by MLS Grid
- 2016-06-24 Sold (MLS) $60,500 RMLSA as Distributed by MLS Grid
- 2016-04-27 Listed $69,900 RMLSA as Distributed by MLS Grid
- 2009-10-29 Sold (MLS) $45,900 RMLSA as Distributed by MLS Grid
- 2009-08-14 Listed $44,900 RMLSA as Distributed by MLS Grid
Property tax history
+3.4%/yrLatest (2024): $2,286 · +4.8% YoY. Source: county tax records.
Cash-flow waterfall
monthlySold comps — $/sqft
last 12 mo · ≤1 miLoading sold comps…