 Duplex
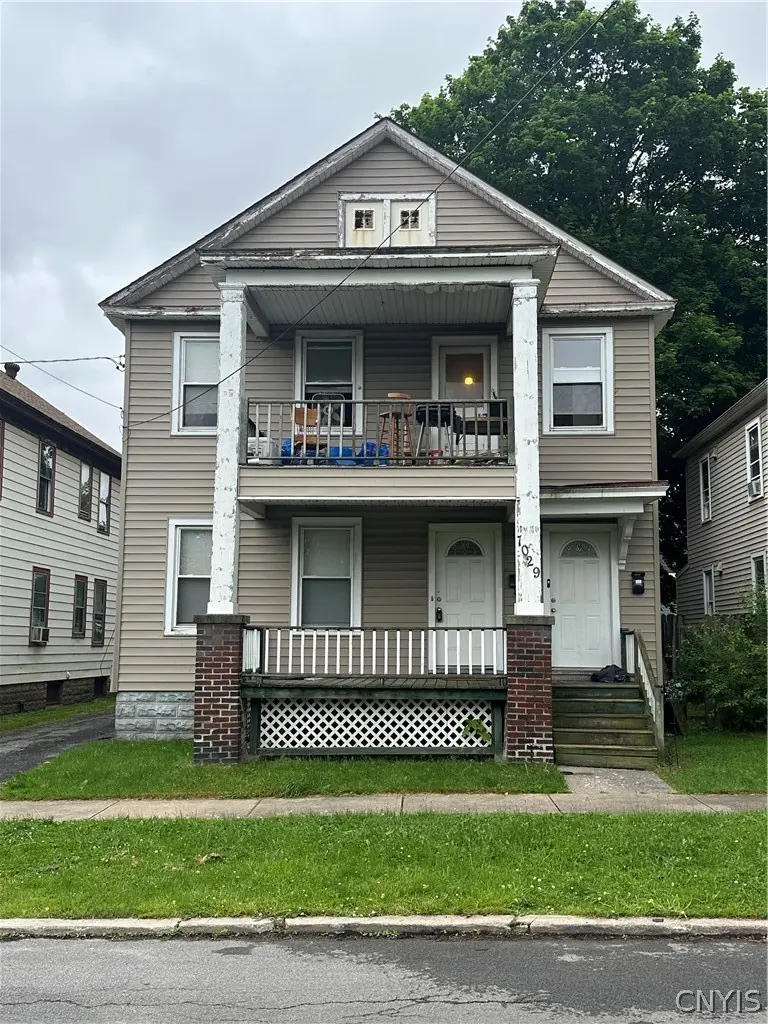
1029 Kellogg Ave · Utica, NY
Flood risk 1/10 · Minimal
- FEMA flood zone
- X (unshaded)
- Chance of flooding over 30 yrs
- 0.0%
- Est. flood insurance / yr
- $473 – $860
Fire risk 3/10 · Minor
- Est. fire insurance / yr
- $691 – $1,283
Heat risk 3/10 · Minor
- Hot days now (above 95°F)
- 7 days/yr
- Hot days in 30 yrs
- 16 days/yr
Wind risk 2/10 · Minimal
- Chance of severe wind over 30 yrs
- 1.0%
Air-quality risk 2/10 · Minimal
- Unhealthy air days now
- 0 days/yr
- Unhealthy air days in 30 yrs
- 2 days/yr
Risk factors via First Street. Map © Google.
Why this score? — see what drove the B grade
The composite is a weighted blend of 9 inputs, each scored 0–100. Each bar is that input's sub-score; the figure is the points it added to the 100-point composite (weight × sub-score).
- Cash flow +30.0/30.0
- 1% rule +10.0/10.0
- DSCR +10.0/10.0
- ARV discount +8.8/15.0
- Livability +4.0/5.0
- Schools +2.9/10.0
- Rent growth +2.5/5.0
- Condition / age +2.5/5.0
- Appreciation +0.0/10.0
$169,000
🖨 Deal sheet 📄 Offer letter ✓ Due diligence
Multi-family units
County records classify this as Multi-Family (2-4 Unit). Listing-text estimate: 2 units. confirmed
Listing remarks
West Utica two family looking for a new owner - come check out this 2 unit with all separate utilities except for water. Landlord owned appliance are currently installed in each unit as well as washer and dryer in the basement. Second floor is fully rented and first floor is ready for you or your new tenant. In addition to beautiful hardwoods some updates include first floor bath, replacement windows and first floor furnace is less than 5 years old. Located close to Utica College and all the amenities of Yorkville and Whitestown just to the west.
Key facts
- 3,793 sq ft lot
- 2 parking spots
- Built 1920
Property features AI
Finance
- Other: Two total units with separate gas and electric meters for each unit
- Financial info: Owner pays water; Rent includes water; Operating expenses include insurance and maintenance
Exterior
- Parking: Paved parking with two or more spaces
- Utilities: Cable available; Public water (connected); Sewer connected
- Home design: 2-story residential building; Residential 2-unit zoning
- Construction: Brick, block, concrete and vinyl siding construction; Asphalt shingle roof; Block foundation; Existing (previously built)
- Exterior features: Private yard; Partial fence; Fenced (partial); See remarks
Interior
- Flooring: Carpet; Hardwood; Laminate; Varied flooring
- Bathrooms: 2 full bathrooms
- Heating & cooling: Gas forced air heating
- Interior features: Accessible doors; Programmable thermostat
- Laundry & utility: Gas water heater
Neighborhood map
What this means for you Summary
Snapshot
- This is a 2 × 3-bed/1.0-bath units multifamily listed at $169k.
Deal economics
- At list price, monthly cash flow is $1k ($17k/yr) — positive. Per door: $727/mo.
- The deal already cash-flows at list — no discount required.
- Meets the 1% rule at list price ($3k rent vs $169k).
- Cap rate 16.6% vs local median 7.7% in Utica — top-decile yield for the area; either an underpriced asset or a hidden risk that comps aren't pricing in. Stress-test before assuming the spread holds.
Location & tenants
- Location reads 80/100 on livability (#104 in NY, #1,589 nationally) — a professional / high-income tenant draw. Strengths: commute A+, cost of living A+, housing A+; Watch: employment D, schools D-, crime F.
- Utica City School District (urban): math 33% / reading 38% proficiency, ranked #562 of 590 in NY (top 95%) — families likely to look elsewhere, expect single-tenant / working-renter base with shorter leases; 71% free/reduced lunch — lower-income household profile, screen leases tightly.
- Market conditions: 150 active listings in the ZIP; 204 units permitted in Oneida County in 2024 (68 in 5+ unit buildings).
- At $3,202/mo this rent would consume 66% of the median local household income ($58k/yr) (locally 1604% of renters already pay >50% of income on rent) — very limited rent-growth headroom before tenants either downsize or default.
Forward outlook
- Local home prices are declining (-3.0%/yr); year-one equity from $1k of loan paydown is wiped out by about $5k of value loss. Plan a longer hold.
- Oneida County population projected at -12% by 2050 — secular population decline; favor cash flow + early exit over multi-decade hold.
- At projected returns (-3.0% appreciation + 3.0% rent growth), your $47k cash investment doubles in ~4 years — after that, you're playing with house money.
Negotiation context
- Only 9 days on market — expect competitive offers; lowballing is unlikely to land.
- 2 sale attempts since 17y ago with the ask held roughly flat each time — persistent listings suggest the price (not the market) is what's stuck; bring a comps-based counter.
- Current owner paid $36k; list at $169k implies a 363% gain — meaningful room to come down on a strong offer.
Risks & watch-outs
- Watch-outs: built in 1920 — expect roof / HVAC / electrical / plumbing capex.
Questions for the listing agent
- Can we see the unit-by-unit rent roll, current vacancy, and any below-market leases? What's the average tenancy length?
- What capital expenditures (roof, boiler, parking lot, exteriors) have been made in the last 5 years, and what's planned in the next 2?
- Built in 1920 — when were the roof, HVAC, electrical panel, plumbing, and water heater last replaced?
- Is there a deadline driving the sale (1031 exchange, divorce, estate, relocation)? That informs how much negotiation room exists.
- Schools are D-rated, which usually means shorter tenancies and higher turnover. Who's the typical renter profile here, and what's been the actual vacancy rate?
- Crime grade is F in this area — have there been break-ins, vandalism, or insurance claims at this property in the last 3 years? What carrier currently insures it and at what premium?
- What's the average days-on-market for RENTAL listings here right now (not sales)? A rising rental-DOM trend means longer vacancies and softer asking-rent achievability than the comps imply.
- What's the recent tenant-quality profile in this submarket — average credit score on applications, eviction rate, late-payment / NSF rate, and stable-employment percentage? A property-management company in the area should have these aggregated.
- How much new apartment / multifamily construction is in the pipeline within 1–3 miles? Heavy new supply (>2% of stock underway) typically softens rents 12–24 months out; light construction supports rent growth.
Investment metrics
- 1% rule
- 1.89% ✓
- Cap rate
- 16.62%
- Cash-on-cash
- 36.88%
- DSCR
- 2.64
- GRM
- 4.4
CMA / ARV
- ARV (on-the-fly)
- $173,900
- Comps found
- 12
Show comp detail 12 sales within ~0.75 mi
| Address | Dist | Beds/Ba | Sqft | Sold | Price | $/sf | Match |
|---|---|---|---|---|---|---|---|
| 1200 Churchill Ave | 0.21mi | 6/2.0 | 2,304 (-2%) | 15mo | $174,900 | $76 | 75 |
| 1911 Noyes St | 0.24mi | 6/2.0 | 2,288 (-3%) | 12mo | $199,800 | $87 | 74 |
| 1206 Mathews Ave | 0.19mi | 6/2.0 | 2,500 (+6%) | 8mo | $185,000 | $74 | 74 |
| 2116 Highland Ave | 0.13mi | 6/3.0 | 2,300 (-2%) | 15mo | $215,000 | $93 | 74 |
| 1217 York St | 0.52mi | 6/2.0 | 2,350 (0%) | 10mo | $170,000 | $72 | 68 |
| 922 Mathews Ave #920 | 0.18mi | 6/2.0 | 2,110 (-10%) | 11mo | $195,000 | $92 | 65 |
| 1211 York St | 0.52mi | 6/2.0 | 2,444 (+4%) | 6mo | $211,000 | $86 | 64 |
| 1109 York St | 0.54mi | 5/2.0 (-1) | 2,406 (+2%) | 5mo | $118,000 | $49 | 62 |
| 1218 City St | 0.65mi | 6/2.0 | 2,288 (-3%) | 10mo | $90,000 | $39 | 57 |
| 1511 Whitesboro St | 0.40mi | 6/3.0 | 2,666 (+13%) | 6mo | $105,000 | $39 | 50 |
| 935 Lenox Ave | 0.72mi | 6/2.0 | 2,180 (-7%) | 12mo | $130,000 | $60 | 44 |
| 15 Dewitt St | 0.74mi | 6/2.0 | 2,618 (+11%) | 16mo | $85,000 | $32 | 34 |
Match score weights: distance 35% · size 25% · config 20% · recency 20%. Top-matched comps best support the ARV.
Projected returns pro-forma
-3.0% appreciation · 3.0% rent growth · sell at horizon
- IRR
- 32.7%
- Equity multiple
- 2.38×
- Total profit
- $65,224
- Equity at exit
- $25,198
- IRR
- 39.7%
- Equity multiple
- 4.72×
- Total profit
- $176,021
- Equity at exit
- $14,612
Cash invested: $47,320 (down + closing). Projections, not guarantees.
Landlord ↔ Tenant lean methodology
- Overall (STATE)
- 15 Strongly Tenant-Friendly
- State New York
- 15 Strongly Tenant-Friendly · D+10
- County
- — inherits STATE
- City
- — inherits STATE
ZIP-level market 13502
- Home prices YoY
- -12.1%
- Active inventory
- 150
- Price-to-rent
- 8.8×
Monthly cashflow live
- Estimated rent
- $3,202 medium interval (Pro) →
- Mortgage (P&I)
- −$886
- Tax from tax record
- −$119 /mo · $1,425/yr
- Insurance
- −$70
- HOA
- −$0
- Vacancy / Maint / Mgmt
- −$672
- Net cashflow
- $1,454
Break-even live
2-unit breakdown (identical units grouped — click to expand)
| Units | Beds | Baths | Est. rent |
|---|---|---|---|
| 2× units | 3 | 1 | $3,202 |
| #1 | 3 | 1 | $1,601 |
| #2 | 3 | 1 | $1,601 |
| Total (2 units) | $3,202 | ||
UW: 25.0% down · 7.5% · 30yr · 1.5% tax · 5.0% vac · 8.0% maint · 8.0% mgmt
Financing live
Cash to close
- Down payment
- $42,250
- Closing costs
- $5,070
- Reserves months
- —
- Total cash needed
- —
Loan-product check · same deal, 3 products live
Conventional
25% down · 7.5% · 30yr
- Down + closing
- —
- Monthly P&I
- —
- Monthly cashflow
- —
- DSCR
- —
- Eligible?
- —
Personal DTI + credit; lowest rate.
DSCR
20% down · 8.5% · 30yr
- Down + closing
- —
- Monthly P&I
- —
- Monthly cashflow
- —
- DSCR
- —
- Eligible?
- —
No personal income docs; deal must DSCR.
Hard money
10% down · 12.0% · 12mo
- Down + closing
- —
- Monthly P&I
- —
- Monthly cashflow
- —
- DSCR
- —
- Eligible?
- —
Short-term bridge; refi at stabilization.
Listing history 8 events
-
2026-06-19days on market $169,000 Active 9 DOM
-
2026-06-18days on market $169,000 Active 8 DOM
-
2026-06-17days on market $169,000 Active 7 DOM
-
2026-06-16days on market $169,000 Active 6 DOM
-
2026-06-15days on market $169,000 Active 5 DOM
-
2026-06-14days on market $169,000 Active 3 DOM
-
2026-06-13remarks 552-char remark
-
2026-06-13$169,000 Active 2 DOM
ⓘ Source: listings_history table (triggers on properties + properties_extension) + one-shot
backfill from property_details.listing_events for pre-trigger history.
Tax reassessment forecast NY · Partial reset (capped growth)
- Current annual tax
- $1,425 · $119/mo
- Projected year-2 tax
- $2,140 · $178/mo
- Expected delta
- +$716/yr (+$60/mo · 50.2%)
ⓘ Screening estimate from a state-policy table — verify with the county assessor before closing.
Climate risk First Street
- Flood 1/10 Low FEMA zone X (unshaded) · 0% chance over 30 yrs
- Wildfire 3/10 Moderate
- Heat 3/10 Moderate 7 d/yr ≥95°F today · 16 d/yr by 30 yrs out
- Wind 2/10 Low 100% chance of damaging wind over 30 yrs
- Air quality 2/10 Low 0 unhealthy d/yr today · 2 by 30 yrs out
Nearby sold comps map
Loading sold comps map…
Walkable amenities ~0.75 mi
Loading nearby amenities…
Taxation est. · year 1
- Rental income
- $38,424
- − Mortgage interest
- −$9,467
- − Property taxes
- −$1,425
- − Insurance
- −$845
- − Repairs & maintenance
- −$3,074
- − Management
- −$3,074
- − Depreciation
- −$4,916
- Taxable income
- $15,623
- Est. tax owed @ 24.0%
- −$3,750
- After-tax cash flow
- $13,701/yr
For passive investors: Depreciation is non-cash, so a rental often shows a tax loss while cash-flowing — sheltering income. Rental losses are passive: they offset passive income freely, and up to $25,000/yr can offset ordinary (W-2) income if you actively participate and your MAGI is under $100k (phasing out to $0 by $150k); unused losses carry forward. On sale, claimed depreciation is recaptured at up to 25%, and gains may owe capital-gains tax (a 1031 exchange can defer both). Figures are a year-1 estimate at your 24.0% rate — not tax advice; consult a CPA.
Schools (NCES district)
- District
- Utica City School District
- NCES district ID
- 3629370
- Math proficiency
- 33% ▼ -7.00%
- Reading proficiency
- 38% ▲ 2.00%
- Median HH income
- $31,834
- Composite
- 29.01/100
- National rank
- #6613
- State rank
- #562 of 590 in NY
Livability — Utica
- Score
- 80/100
- State rank
- #104
- US rank
- #1589
Category grades
Schools grade is shown separately in the Schools card above.
Census & demographics
- Census place
- Utica, NY
- County
- Oneida County · 89,710 people
- City population
- 72,968
- Metro
- Utica-Rome, NY
- Population (ZIP)
- 34,037
- Household income
- $57,835
- Rent vs Own
- Severe rent burden
- 1604.0
Population outlook (Oneida County) Hauer SSP2
- Today (2025)
- 225,223 people
- By 2030
- 220,384 · -2.1%
- By 2040
- 209,071 · -7.2%
- By 2050
- 197,920 · -12.1%
- By 2075
- 175,541 · -22.1%
- By 2100
- 148,491 · -34.1%
Race, ethnicity, and origin ACS 2023
- Neighborhood character
- Predominantly White (71%)
- Race & ethnicity
- White 71% Hispanic / Latino 11% Black 9% Two or more races 7% Asian 5%
- Hispanic origin (detail)
- Mexican 2% Puerto Rican 5% Dominican 2%
- Common ancestry
- Romanian 11% Lithuanian 3% American 2%
- Foreign-born
- 12% · Canada, Philippines, China
- Languages at home
- 81% English-only · Spanish 7% Russian/Polish/Slavic 4% Other Asian/Pacific 3%
Political lean MEDSL · Oneida
- 2024 margin
- Strong R (+21.3) · D 39.4% · R 60.6%
- 2008→2024 swing
- -15.2pp toward R · 2008: -6.1pp · 2024: -21.3pp
- All cycles
- 2024: R+21.3 2020: R+15.5 2016: R+21.1 2012: R+5.3 2008: R+6.1
Not yet ingested
- Civics
- —
Market trends
- HPI YoY
- ▼ -50.76%
- Current HPI
- 368.3955
- Rent YoY
- —
- Metro
- Utica-Rome, NY
- State GDP YoY
- ▲ 2.60%
- F500 in state
- 92
Industry mix (Fortune 500 HQ in NY)
| Industry | F500 HQs | Revenue |
|---|---|---|
| Financial Services | 10 | $950B |
|
||
| Consumer Goods | 9 | $162B |
|
||
| Insurance | 4 | $225B |
|
||
| Telecommunications | 2 | $144B |
|
||
| Pharmaceuticals | 2 | $112B |
|
||
| Media / Entertainment | 2 | $69B |
|
||
Price history
+322.5% since first listed4 events — show timeline
- 2026-06-10 Listed $169,000 CNYIS
- 2009-03-18 Listed $74,900 CNYIS
- 2002-03-15 Sold (Public Records) $36,500 Public Records
- 1995-10-06 Sold (Public Records) $40,000 Public Records
Property tax history
-0.3%/yrLatest (2025): $1,425 · -33.5% YoY. Source: county tax records.
Cash-flow waterfall
monthlySold comps — $/sqft
last 12 mo · ≤1 miLoading sold comps…