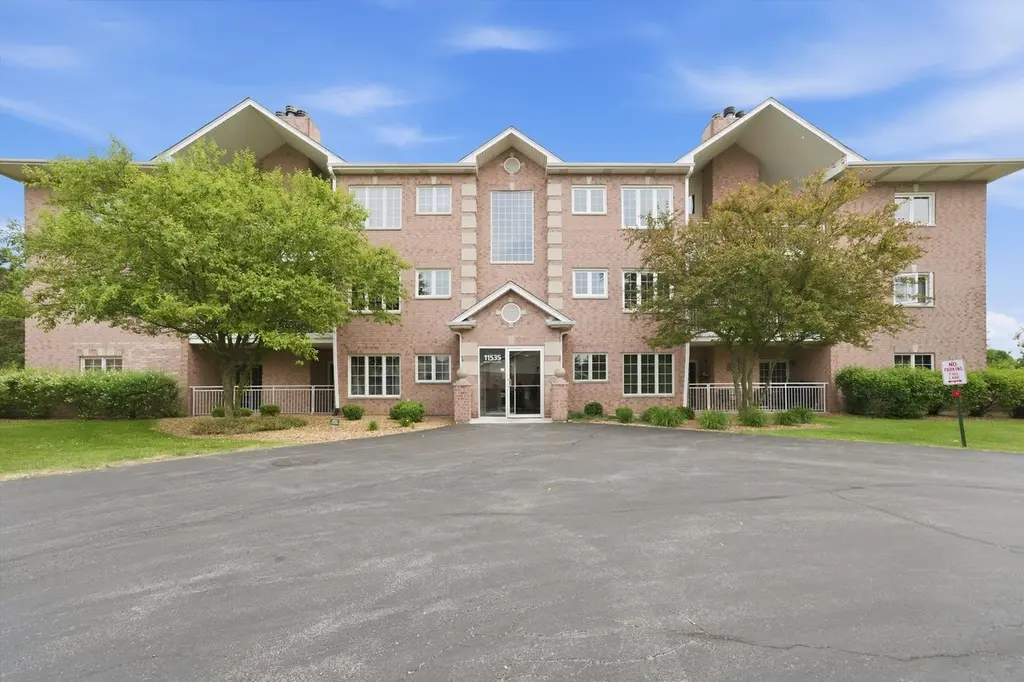
11535 Settlers Pond Way Unit 8-1B · Orland Park, IL
Flood risk 1/10 · Minimal
- FEMA flood zone
- X (unshaded)
- Chance of flooding over 30 yrs
- 0.0%
- Est. flood insurance / yr
- $507 – $1,088
Fire risk 1/10 · Minimal
- Est. fire insurance / yr
- $804 – $1,492
Heat risk 3/10 · Minor
- Hot days now (above 102°F)
- 7 days/yr
- Hot days in 30 yrs
- 15 days/yr
Wind risk 2/10 · Minimal
- Chance of severe wind over 30 yrs
- —
Air-quality risk 2/10 · Minimal
- Unhealthy air days now
- 1 days/yr
- Unhealthy air days in 30 yrs
- 1 days/yr
Risk factors via First Street. Map © Google.
Why this score? — see what drove the D- grade
The composite is a weighted blend of 9 inputs, each scored 0–100. Each bar is that input's sub-score; the figure is the points it added to the 100-point composite (weight × sub-score).
- Cash flow +10.8/30.0
- ARV discount +7.5/15.0
- 1% rule +5.0/10.0
- Livability +4.2/5.0
- Schools +3.4/10.0
- DSCR +3.1/10.0
- Rent growth +2.5/5.0
- Condition / age +2.5/5.0
- Appreciation +0.0/10.0
$289,900
🖨 Deal sheet 📄 Offer letter ✓ Due diligence
Listing remarks MLS
Sought after 1st floor unit in a secure flexicore building with sprinklers. Boasting an open floor plan and plenty of natural light. 2 bedroom, 2 full baths. Formal dining room. Large eat-in kitchen with plenty of counter space, cabinetry & pantry. Family room w/ gas fireplace flanked by sliding glass doors to patio & yard. Laundry room with built-in cabinets. Spacious master suite with walk-in closet and private whirlpool tub, walk-in shower & double vanity. Sit and relax or entertain on your patio. 1 car garage just steps away. Set in the Preserves of Marley Creek with a community walking path to METRA, Jewel, Starbucks, & McDonalds! One of the largest neighborhood parks includes pond, walking paths, basketball court, even a small sled hill!
Key facts
- Cozy gas fireplace
- Open floor plan
- Large eat-in kitchen
Tags
Property features AI
Finance
- Other: Community offers school bus service, commuter bus and train access, nearby interstate access
- HOA & community: Monthly association fee of $300; Association covers insurance, exterior maintenance, lawn care, scavenger and snow removal; Manager off-site; Association amenities include a park; Pets allowed (cats and dogs), large maximum pet weight allowed
Exterior
- Parking: Detached garage (garage owned) with garage door opener; Asphalt parking; Total 1 parking space / 1 garage space
- Utilities: Water source: Lake Michigan; Public sewer; Electric with circuit breakers
- Home design: Attached single condo; Condo ownership; Entry level: 1; Model: CONDO; 12-unit building; Not currently leased
- Construction: Brick construction; Concrete perimeter foundation; Age: approximately 21–25 years
- Exterior features: Balcony; Common landscaped grounds; Pond on property
Interior
- Kitchen: Range; Microwave; Dishwasher; Refrigerator; Kitchen with eating area/table space and pantry (15 x 15)
- Bedrooms: Master bedroom on main level (17 x 14) with full bath; Second bedroom on main level (12 x 11); Additional bedrooms noted (labels for Bedroom 3 and Bedroom 4)
- Flooring: Other (balcony/porch flooring listed as Other in room detail)
- Bathrooms: 2 full bathrooms; Whirlpool tub and separate shower in bath
- Heating & cooling: Natural gas forced-air heating; Central air conditioning
- Interior features: Elevator; First-floor bedroom; First-floor full bathroom; Storage; Flexicore construction; 5 total rooms
- Laundry & utility: Main-level laundry room (9 x 9); Washer hookup in unit; Washer and dryer included
Neighborhood map
What this means for you Summary
Snapshot
- This is a 2-bed/2.0-bath condo listed at $290k.
Deal economics
- At list price, monthly cash flow is $-133 ($-2k/yr) — negative.
- To cash-flow at today's rent, offer at most $266k (8.1% below list).
- Meets the 1% rule at list price ($3k rent vs $290k).
- Recommended offer: $266k (8.1% below list) — sets the bar for cash-flow.
- Cap rate 5.7% vs local median 4.3% in Orland Park — top-decile yield for the area; either an underpriced asset or a hidden risk that comps aren't pricing in. Stress-test before assuming the spread holds.
Location & tenants
- Location reads 85/100 on livability (#29 in IL, #529 nationally) — a professional / high-income tenant draw. Strengths: crime A+, amenities A+, commute A+.
- Cons Hsd 230 (suburban): math 35% / reading 39% proficiency, ranked #146 of 620 in IL (top 24%) — families likely to look elsewhere, expect single-tenant / working-renter base with shorter leases.
- Market conditions: 119 active listings in the ZIP; 6,272 units permitted in Cook County in 2024 (4,658 in 5+ unit buildings).
Forward outlook
- Local home prices are declining (-3.0%/yr); year-one equity from $2k of loan paydown is wiped out by about $9k of value loss. Plan a longer hold.
Negotiation context
- It's been on market 16 days — a 2% lower offer ($286k) is reasonable based on typical stale-listing flexibility.
- 2 sale attempts since 7y ago; this cycle's ask is 53% above the opening price — seller raised mid-cycle; expect resistance to lowballs.
- Current owner paid $184k; list at $290k implies a 58% gain — meaningful room to come down on a strong offer.
Questions for the listing agent
- What do current leases actually rent for vs. the listed asking? Can we see a recent rent roll and the last 12 months of T-12 income?
- What does the HOA fee cover, when was the last increase, and are there any pending special assessments or reserve-fund shortfalls?
- Any open or pending special assessments — roof, HVAC, plumbing, elevator, façade? What's the per-unit balance and payoff schedule, and is the seller paying it off at close or rolling it to the buyer?
- Is there a deadline driving the sale (1031 exchange, divorce, estate, relocation)? That informs how much negotiation room exists.
- The area grade is low — what's the realistic commute time and amenity access for the typical tenant pool here? Any planned neighborhood developments (good or bad) we should know about?
- What's the average days-on-market for RENTAL listings here right now (not sales)? A rising rental-DOM trend means longer vacancies and softer asking-rent achievability than the comps imply.
- What's the recent tenant-quality profile in this submarket — average credit score on applications, eviction rate, late-payment / NSF rate, and stable-employment percentage? A property-management company in the area should have these aggregated.
- How much new apartment / multifamily construction is in the pipeline within 1–3 miles? Heavy new supply (>2% of stock underway) typically softens rents 12–24 months out; light construction supports rent growth.
Investment metrics
- 1% rule
- 1.00% ✓
- Cap rate
- 5.74%
- Cash-on-cash
- -1.97%
- DSCR
- 0.91
- GRM
- 8.3
CMA / ARV
No comps found within radius.
Projected returns pro-forma
-3.0% appreciation · 3.0% rent growth · sell at horizon
- IRR
- -19.4%
- Equity multiple
- 0.32×
- Total profit
- $-55,155
- Equity at exit
- $43,225
- IRR
- -11.9%
- Equity multiple
- 0.29×
- Total profit
- $-57,705
- Equity at exit
- $25,065
Cash invested: $81,172 (down + closing). Projections, not guarantees.
Landlord ↔ Tenant lean methodology
- Overall (STATE)
- 43 Moderately Tenant-Leaning
- State Illinois
- 43 Moderately Tenant-Leaning · D+7
- County
- — inherits STATE
- City
- — inherits STATE
ZIP-level market 60467
- Home prices YoY
- -30.4%
- Active inventory
- 119
- Price-to-rent
- 8.3×
Monthly cashflow live
- Estimated rent
- $2,911 medium interval (Pro) →
- Mortgage (P&I)
- −$1,520
- Tax from tax record
- −$492 /mo · $5,906/yr
- Insurance
- −$121
- HOA
- −$300
- Vacancy / Maint / Mgmt
- −$611
- Net cashflow
- $-133
Break-even live
UW: 25.0% down · 7.5% · 30yr · 1.5% tax · 5.0% vac · 8.0% maint · 8.0% mgmt
Financing live
Cash to close
- Down payment
- $72,475
- Closing costs
- $8,697
- Reserves months
- —
- Total cash needed
- —
Loan-product check · same deal, 3 products live
Conventional
25% down · 7.5% · 30yr
- Down + closing
- —
- Monthly P&I
- —
- Monthly cashflow
- —
- DSCR
- —
- Eligible?
- —
Personal DTI + credit; lowest rate.
DSCR
20% down · 8.5% · 30yr
- Down + closing
- —
- Monthly P&I
- —
- Monthly cashflow
- —
- DSCR
- —
- Eligible?
- —
No personal income docs; deal must DSCR.
Hard money
10% down · 12.0% · 12mo
- Down + closing
- —
- Monthly P&I
- —
- Monthly cashflow
- —
- DSCR
- —
- Eligible?
- —
Short-term bridge; refi at stabilization.
HOA detail condo
- Monthly dues
- $300 · $3,600/yr
- Likely covers
- gaspool
- Assessments
- None detected in remarks — confirm with the listing agent.
Listing history 10 events
-
2026-06-18days on market $289,900 Active 16 DOM
-
2026-06-17days on market $289,900 Active 15 DOM
-
2026-06-16days on market $289,900 Active 14 DOM
-
2026-06-15days on market $289,900 Active 13 DOM
-
2026-06-13days on market $289,900 Active 11 DOM
-
2026-06-09days on market $289,900 Active 7 DOM
-
2026-06-08days on market $289,900 Active 6 DOM
-
2026-06-07days on market $289,900 Active 5 DOM
-
2026-06-04days on market $289,900 Active 2 DOM
-
2026-06-02$289,900 Active 1 DOM
ⓘ Source: listings_history table (triggers on properties + properties_extension) + one-shot
backfill from property_details.listing_events for pre-trigger history.
Tax reassessment forecast IL · Partial reset (capped growth)
- Current annual tax
- $5,906 · $492/mo
- Projected year-2 tax
- $6,243 · $520/mo
- Expected delta
- +$337/yr (+$28/mo · 5.7%)
ⓘ Screening estimate from a state-policy table — verify with the county assessor before closing.
Climate risk First Street
- Flood 1/10 Low FEMA zone X (unshaded) · 0% chance over 30 yrs
- Wildfire 1/10 Low
- Heat 3/10 Moderate 7 d/yr ≥102°F today · 15 d/yr by 30 yrs out
- Wind 2/10 Low
- Air quality 2/10 Low 1 unhealthy d/yr today · 1 by 30 yrs out
Nearby sold comps map
Loading sold comps map…
Walkable amenities ~0.75 mi
Loading nearby amenities…
Taxation est. · year 1
- Rental income
- $34,936
- − Mortgage interest
- −$16,239
- − Property taxes
- −$5,906
- − Insurance
- −$1,450
- − Repairs & maintenance
- −$2,795
- − Management
- −$2,795
- − HOA
- −$3,600
- − Depreciation
- −$8,433
- Taxable loss
- −$6,281
- Est. tax savings @ 24.0%
- +$1,508
- After-tax cash flow
- $-92/yr
For passive investors: Depreciation is non-cash, so a rental often shows a tax loss while cash-flowing — sheltering income. Rental losses are passive: they offset passive income freely, and up to $25,000/yr can offset ordinary (W-2) income if you actively participate and your MAGI is under $100k (phasing out to $0 by $150k); unused losses carry forward. On sale, claimed depreciation is recaptured at up to 25%, and gains may owe capital-gains tax (a 1031 exchange can defer both). Figures are a year-1 estimate at your 24.0% rate — not tax advice; consult a CPA.
Schools (NCES district)
- District
- Cons Hsd 230
- NCES district ID
- 1708400
- Math proficiency
- 35% ▼ -8.00%
- Reading proficiency
- 39% ▼ -6.00%
- Median HH income
- $73,953
- Composite
- 34.29/100
- National rank
- #5244
- State rank
- #146 of 620 in IL
Livability — Orland Park
- Score
- 85/100
- State rank
- #29
- US rank
- #529
Category grades
Schools grade is shown separately in the Schools card above.
Census & demographics
- Census place
- Orland Park, IL
- City population
- 41,456
- Population (ZIP)
- 24,952
Population outlook (Cook County) Hauer SSP2
- Today (2025)
- 5,347,519 people
- By 2030
- 5,357,703 · +0.2%
- By 2040
- 5,324,924 · -0.4%
- By 2050
- 5,230,762 · -2.2%
- By 2075
- 4,785,735 · -10.5%
- By 2100
- 4,188,836 · -21.7%
Race, ethnicity, and origin ACS 2023
- Neighborhood character
- Predominantly White (83%)
- Race & ethnicity
- White 83% Hispanic / Latino 6% Asian 5% Two or more races 4% Black 4%
- Hispanic origin (detail)
- Mexican 5%
- Common ancestry
- Romanian 15% Armenian 2% Iranian 2%
- Foreign-born
- 14% · Canada, South Korea, China
- Languages at home
- 78% English-only · Arabic 9% Russian/Polish/Slavic 4% Other Indo-European 4%
Political lean MEDSL · Cook
- 2024 margin
- Solid D (+42.0) · D 70.4% · R 28.4% · Other 1.2%
- 2008→2024 swing
- -11.4pp toward R · 2008: 53.4pp · 2024: 42.0pp
- All cycles
- 2024: D+42.0 2020: D+50.3 2016: D+53.0 2012: D+49.4 2008: D+53.4
Not yet ingested
- Civics
- —
Market trends
- HPI YoY
- ▼ -82.13%
- Current HPI
- 188.3676
- Rent YoY
- —
- Metro
- —
- State GDP YoY
- ▲ 1.59%
- F500 in state
- 60
Industry mix (Fortune 500 HQ in IL)
| Industry | F500 HQs | Revenue |
|---|---|---|
| Insurance | 4 | $201B |
|
||
| Consumer Goods | 4 | $87B |
|
||
| Industrial Machinery | 3 | $64B |
|
||
| Healthcare | 2 | $55B |
|
||
| Retail / Pharmacy | 1 | $148B |
|
||
| Agriculture / Food | 1 | $86B |
|
||
Price history
-2.6% since first listed10 events — show timeline
- 2026-06-02 Listing Removed — MRED as Distributed by MLS Grid
- 2020-07-16 Sold (Public Records) $184,000 Public Records
- 2020-06-02 Sold (MLS) $184,000 MRED as Distributed by MLS Grid
- 2020-04-29 Pending — MRED as Distributed by MLS Grid
- 2020-04-04 Price Changed $189,000 MRED as Distributed by MLS Grid
- 2020-04-02 Relisted — MRED as Distributed by MLS Grid
- 2020-02-29 Contingent — MRED as Distributed by MLS Grid
- 2020-02-22 Price Changed $179,000 MRED as Distributed by MLS Grid
- 2020-02-05 Price Changed $184,000 MRED as Distributed by MLS Grid
- 2019-11-09 Listed $189,000 MRED as Distributed by MLS Grid
Property tax history
+5.1%/yrLatest (2023): $5,906 · +15.4% YoY. Source: county tax records.
Cash-flow waterfall
monthlySold comps — $/sqft
last 12 mo · ≤1 miLoading sold comps…