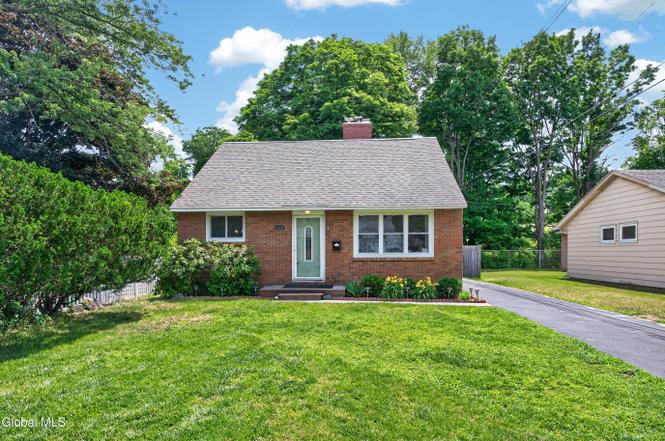
111 Daytona Ave · Albany, NY
Flood risk 1/10 · Minimal
- FEMA flood zone
- X (unshaded)
- Chance of flooding over 30 yrs
- 0.0%
- Est. flood insurance / yr
- $473 – $860
Fire risk 1/10 · Minimal
- Est. fire insurance / yr
- $691 – $1,283
Heat risk 4/10 · Minor
- Hot days now (above 98°F)
- 7 days/yr
- Hot days in 30 yrs
- 16 days/yr
Wind risk 3/10 · Minor
- Chance of severe wind over 30 yrs
- 7.0%
Air-quality risk 1/10 · Minimal
- Unhealthy air days now
- 0 days/yr
- Unhealthy air days in 30 yrs
- 0 days/yr
Risk factors via First Street. Map © Google.
Why this score? — see what drove the D grade
The composite is a weighted blend of 9 inputs, each scored 0–100. Each bar is that input's sub-score; the figure is the points it added to the 100-point composite (weight × sub-score).
- ARV discount +13.0/15.0
- Cash flow +9.6/30.0
- 1% rule +4.0/10.0
- Livability +4.0/5.0
- Schools +3.2/10.0
- Rent growth +3.0/5.0
- DSCR +2.7/10.0
- Condition / age +2.5/5.0
- Appreciation +0.0/10.0
$289,000
🖨 Deal sheet (PDF) 📄 Offer letter ✓ Due diligence
Listing remarks MLS
New flr plan opened up between kitch & LR. Totally redone! This 4 BR, 1 1/2 bath brick & vinyl salt box is close to everything -campus, all hwys, shopping, bus line. It has LR, DR, eat-in kitchen and FR/rec room (in basement). New vinyl plank flooring in LR, DR, kitchen and halls. New w/w in remaining rooms. New kitchen (new frig & range) & full bath, remodeled 1/2 bath. New roof, furnace w/CA & bilco door. Repl doors & windows. Incl 1yr home warranty. Nothing to do here for yrs, immed possession! Excellent Condition
Key facts
- Laminate flooring
- Formal dining room
- Ceiling fans
Tags
Property features AI
Exterior
- Parking: Off-street paved parking; Driveway; Total of 2 parking spaces
- Security: Smoke detectors; Carbon monoxide detectors
- Utilities: Public water; Public sewer; 220-volt electric with circuit breakers; Cable available
- Home design: Single family residence; Updated/remodeled condition; Level lot
- Construction: Block foundation; Construction includes block, brick, drywall, and vinyl siding; Rubber and asphalt roof
- Exterior features: Patio; Paved driveway; Garden; Outdoor lighting; Outdoor bar; Shed(s) and workshop; Wood and chain-link fencing with gate; Drive-paved yard
Interior
- Kitchen: Electric oven; Range; Microwave; Dishwasher; Refrigerator
- Bedrooms: One bedroom on the first floor; Three bedrooms on the second floor
- Flooring: Laminate flooring
- Bathrooms: One full bathroom (first floor); One half bathroom (second floor)
- Heating & cooling: Forced air heating; Wood heating option; Central air conditioning
- Interior features: Walk-in closet(s); Storm door(s); Screens and curtain rods on windows; Double-pane windows; Finished, heated basement with interior entry and Bilco doors; Wood-burning fireplace with insert in family room
- Laundry & utility: Washer and dryer hookups; Washer/Dryer listed as included; Electric dryer hookup located in basement
Neighborhood map
What this means for you Summary
Snapshot
- This is a 4-bed/1.5-bath single-family listed at $289k.
Deal economics
- At list price, monthly cash flow is $-196 ($-2k/yr) — negative.
- To cash-flow at today's rent, offer at most $254k (12.0% below list).
- To meet the 1% rule (rent ≥ 1% of price), the offer needs to be $259k (10.4% below list).
- Recommended offer: $254k (12.0% below list) — sets the bar for cash-flow.
Location & tenants
- Location reads 79/100 on livability (#129 in NY, #2,083 nationally) — a middle-class / working-renter tenant base. Strengths: amenities A+, commute A+, housing A+; Watch: employment C-, crime F.
- Albany City School District (urban): math 37% / reading 40% proficiency, ranked #543 of 590 in NY (top 92%) — families likely to look elsewhere, expect single-tenant / working-renter base with shorter leases; 66% free/reduced lunch — lower-income household profile, screen leases tightly.
- Zoned schools: Albany High School (math 74% / reading 67%, grade B+, #710 of 1,100 statewide, top 65%, 2,676 students, 69% FRL) — zoned schools at 69% FRL track the district average.
- Zoned-school proficiency averages 70% at this address vs 38% district-wide (+32 pts) — the actual schools serving this property are materially stronger than the Albany City School District average implies; a family-tenant draw the district grade alone would hide.
- Market conditions: Rents rising (+1.9%/yr); 127 active listings in the ZIP; 14 comparable units currently listed for rent nearby; rentals at typical pace (median 25d on market — plan ~3-4 weeks tenant-placement turnaround); 43% of comp listings sitting > 30 days — soft ceiling on asking rent; solid renter incomes; 675 units permitted in Albany County in 2024 (451 in 5+ unit buildings).
- This rent runs 37% of the median local income ($83k/yr) — at the standard rent-burdened threshold; future hikes will face affordability resistance.
Forward outlook
- Local home prices are declining (-3.0%/yr); year-one equity from $2k of loan paydown is wiped out by about $9k of value loss. Plan a longer hold.
- Albany County population projected at +9% by 2050 — modest demand growth; plan on rents tracking national, not racing it.
Negotiation context
- Only 2 days on market — expect competitive offers; lowballing is unlikely to land.
- 3 sale attempts since 16y ago with the ask held roughly flat each time — persistent listings suggest the price (not the market) is what's stuck; bring a comps-based counter.
- Current owner paid $188k; list at $289k implies a 54% gain — meaningful room to come down on a strong offer.
Risks & watch-outs
- Watch-outs: property tax is 2.5% of price; built in 1952 — expect roof / HVAC / electrical / plumbing capex.
Questions for the listing agent
- What do current leases actually rent for vs. the listed asking? Can we see a recent rent roll and the last 12 months of T-12 income?
- Built in 1952 — when were the roof, HVAC, electrical panel, plumbing, and water heater last replaced?
- Property tax is high relative to price — has the assessment been appealed recently, and will the sale trigger a re-assessment?
- Is there a deadline driving the sale (1031 exchange, divorce, estate, relocation)? That informs how much negotiation room exists.
- Crime grade is F in this area — have there been break-ins, vandalism, or insurance claims at this property in the last 3 years? What carrier currently insures it and at what premium?
- The area grade is low — what's the realistic commute time and amenity access for the typical tenant pool here? Any planned neighborhood developments (good or bad) we should know about?
- What's the average days-on-market for RENTAL listings here right now (not sales)? A rising rental-DOM trend means longer vacancies and softer asking-rent achievability than the comps imply.
- What's the recent tenant-quality profile in this submarket — average credit score on applications, eviction rate, late-payment / NSF rate, and stable-employment percentage? A property-management company in the area should have these aggregated.
- How much new for-sale + rental construction is in the pipeline within 1–3 miles? Heavy new supply typically softens prices + rents 12–24 months out; constrained supply supports both.
Investment metrics
- 1% rule
- 0.90% ✗
- Cap rate
- 5.48%
- Cash-on-cash
- -2.90%
- DSCR
- 0.87
- GRM
- 9.3
CMA / ARV
- ARV (on-the-fly)
- $329,280
- Comps found
- 12
Show comp detail 12 sales within ~0.75 mi
| Address | Dist | Beds/Ba | Sqft | Sold | Price | $/sf | Match |
|---|---|---|---|---|---|---|---|
| 178 Ormond St | 0.16mi | 4/2.5 | 1,503 (+2%) | 1mo | $446,000 | $297 | 84 |
| 43 Oliver Ave | 0.34mi | 3/1.5 (-1) | 1,456 (-1%) | 6mo | $375,000 | $258 | 72 |
| 87 Ormond St | 0.20mi | 3/2.0 (-1) | 1,562 (+6%) | 2mo | $349,900 | $224 | 72 |
| 123 Daytona Ave | 0.07mi | 3/2.5 (-1) | 1,595 (+8%) | 2mo | $404,000 | $253 | 72 |
| 188 Tampa Ave | 0.17mi | 3/2.0 (-1) | 1,354 (-8%) | 5mo | $294,000 | $217 | 68 |
| 16 Aspen Cir | 0.36mi | 3/2.0 (-1) | 1,498 (+2%) | 6mo | $395,000 | $264 | 68 |
| 32 Eileen St | 0.64mi | 4/1.5 | 1,532 (+4%) | 1mo | $290,000 | $189 | 62 |
| 19 Pleasantview Ave | 0.51mi | 3/2.0 (-1) | 1,380 (-6%) | 1mo | $278,000 | $201 | 58 |
| 41 Crescent Dr | 0.65mi | 3/1.5 (-1) | 1,500 (+2%) | 6mo | $330,000 | $220 | 57 |
| 37 Briar Ave | 0.36mi | 3/1.0 (-1) | 1,269 (-14%) | 4mo | $270,000 | $213 | 50 |
| 18 Fairlawn Ave | 0.74mi | 4/2.0 | 1,352 (-8%) | 1mo | $315,000 | $233 | 50 |
| 7 Clarendon Rd | 0.60mi | 3/1.5 (-1) | 1,620 (+10%) | 4mo | $333,000 | $206 | 47 |
Match score weights: distance 35% · size 25% · config 20% · recency 20%. Top-matched comps best support the ARV.
Projected returns pro-forma
-3.0% appreciation · 1.85% rent growth · sell at horizon
- IRR
- -22.5%
- Equity multiple
- 0.23×
- Total profit
- $-62,067
- Equity at exit
- $43,091
- IRR
- -20.1%
- Equity multiple
- -0.00×
- Total profit
- $-81,206
- Equity at exit
- $24,987
Cash invested: $80,920 (down + closing). Projections, not guarantees.
Landlord ↔ Tenant lean methodology
- Overall (STATE)
- 15 Strongly Tenant-Friendly
- State New York
- 15 Strongly Tenant-Friendly · D+10
- County
- — inherits STATE
- City
- — inherits STATE
ZIP-level market 12203
- Home prices YoY
- -31.0%
- Rents YoY
- 1.9%
- Active inventory
- 127
- Price-to-rent
- 9.3×
Monthly cashflow live
- Estimated rent
- $2,591 high interval (Pro) →
- Mortgage (P&I)
- −$1,516
- Tax from tax record
- −$606 /mo · $7,275/yr
- Insurance
- −$120
- HOA
- −$0
- Vacancy / Maint / Mgmt
- −$544
- Net cashflow
- $-196
Break-even live
Sensitivity live
| Price | -10% $-32 | -5% $-114 | +0% $-196 | +5% $-277 | +10% $-359 |
|---|---|---|---|---|---|
| Rent | -10% $-400 | -5% $-298 | +0% $-196 | +5% $-93 | +10% $9 |
| Rate | -1.0pp $-50 | -0.5pp $-122 | base $-196 | +0.5pp $-271 | +1.0pp $-347 |
UW: 25.0% down · 7.5% · 30yr · 1.5% tax · 5.0% vac · 8.0% maint · 8.0% mgmt
Financing live
Cash to close
- Down payment
- $72,250
- Closing costs
- $8,670
- Reserves months
- —
- Total cash needed
- —
Loan-product check · same deal, 3 products live
Conventional
25% down · 7.5% · 30yr
- Down + closing
- —
- Monthly P&I
- —
- Monthly cashflow
- —
- DSCR
- —
- Eligible?
- —
Personal DTI + credit; lowest rate.
DSCR
20% down · 8.5% · 30yr
- Down + closing
- —
- Monthly P&I
- —
- Monthly cashflow
- —
- DSCR
- —
- Eligible?
- —
No personal income docs; deal must DSCR.
Hard money
10% down · 12.0% · 12mo
- Down + closing
- —
- Monthly P&I
- —
- Monthly cashflow
- —
- DSCR
- —
- Eligible?
- —
Short-term bridge; refi at stabilization.
Rent comps 14 comps
| Address | Beds | Baths | Sqft | Rent | $/sqft | DOM | Units | Dist |
|---|---|---|---|---|---|---|---|---|
| 830 Western Ave Albany, NY | 4.0 | 2.5 | 1600 | $2,700 | $1.69 | 16d | 1 | 0.42mi |
| 2 Friebel Rd Albany, NY | 3.0 | 2.0 | 1392 | $2,200 | $1.58 | 15d | 1 | 0.56mi |
| 32 Moreland Ave Unit NA Albany, NY | 3.0 | 1.5 | 1500 | $2,300 | $1.53 | 23d | 1 | 0.63mi |
| 53 Greenway N Albany, NY | 3.0 | 2.0 | 1500 | $2,600 | $1.73 | 25d | 1 | 0.67mi |
| 786 New Scotland Ave Albany, NY | 5.0 | 2.5 | 1209 | $3,000 | $2.48 | 45d | 1 | 0.67mi |
| 62 Homestead St Albany, NY | 4.0 | 2.0 | 1600 | $2,600 | $1.62 | 45d | 1 | 0.71mi |
| 78 S Pine Ave Unit 2 Albany, NY | 3.0 | 1.5 | 1541 | $2,350 | $1.52 | 16d | 1 | 0.94mi |
| 135 Winthrop Ave Albany, NY | 3.0 | 2.0 | 1788 | $3,500 | $1.96 | 45d | 1 | 1.09mi |
| 255 Patroon Creek Blvd Albany, NY | 1.0–3.0 | 1.0–2.0 | 1080 | $2,559 | $2.37 | 16d | 22 | 1.11mi |
| 104 S Main Ave Unit 1 Albany, NY | 3.0 | 1.0 | 1300 | $2,600 | $2.00 | 45d | 1 | 1.19mi |
| 32 Peyster St Unit 2nd Albany, NY | 3.0 | 2.0 | 1500 | $2,300 | $1.53 | 45d | 1 | 1.28mi |
| 30 Cardinal Ave Albany, NY | 4.0 | 1.0 | 1529 | $2,800 | $1.83 | 46d | 1 | 1.32mi |
| 38 W Erie St Albany, NY | 4.0 | 2.0 | 1440 | $2,800 | $1.94 | 25d | 1 | 1.32mi |
| 602 Morris St Albany, NY | 3.0 | 1.0 | 1270 | $1,850 | $1.46 | 16d | 1 | 1.38mi |
Listing history 2 events
-
2026-06-21remarks 699-char remark
-
2026-06-21$289,000 Active 2 DOM
ⓘ Source: listings_history table (triggers on properties + properties_extension) + one-shot
backfill from property_details.listing_events for pre-trigger history.
Tax reassessment forecast NY · Partial reset (capped growth)
- Current annual tax
- $7,275 · $606/mo
- Projected year-2 tax
- $7,275 · $606/mo
- Expected delta
- $0/yr ($0/mo · 0.0%)
ⓘ Screening estimate from a state-policy table — verify with the county assessor before closing.
Climate risk First Street
- Flood 1/10 Low FEMA zone X (unshaded) · 0% chance over 30 yrs
- Wildfire 1/10 Low
- Heat 4/10 Moderate 7 d/yr ≥98°F today · 16 d/yr by 30 yrs out
- Wind 3/10 Moderate 7% chance of damaging wind over 30 yrs
- Air quality 1/10 Low 0 unhealthy d/yr today · 0 by 30 yrs out
Nearby sold comps map
Loading sold comps map…
Walkable amenities ~0.75 mi
Loading nearby amenities…
Taxation est. · year 1
- Rental income
- $31,087
- − Mortgage interest
- −$16,188
- − Property taxes
- −$7,275
- − Insurance
- −$1,445
- − Repairs & maintenance
- −$2,487
- − Management
- −$2,487
- − Depreciation
- −$8,407
- Taxable loss
- −$7,203
- Est. tax savings @ 24.0%
- +$1,729
- After-tax cash flow
- $-619/yr
For passive investors: Depreciation is non-cash, so a rental often shows a tax loss while cash-flowing — sheltering income. Rental losses are passive: they offset passive income freely, and up to $25,000/yr can offset ordinary (W-2) income if you actively participate and your MAGI is under $100k (phasing out to $0 by $150k); unused losses carry forward. On sale, claimed depreciation is recaptured at up to 25%, and gains may owe capital-gains tax (a 1031 exchange can defer both). Figures are a year-1 estimate at your 24.0% rate — not tax advice; consult a CPA.
Schools (NCES district)
- District
- Albany City School District
- NCES district ID
- 3602460
- Math proficiency
- 37% ▲ 6.00%
- Reading proficiency
- 40% ▲ 7.00%
- Median HH income
- $40,568
- Composite
- 32.34/100
- National rank
- #5744
- State rank
- #543 of 590 in NY
Livability — Albany
- Score
- 79/100
- State rank
- #129
- US rank
- #2083
Category grades
Schools grade is shown separately in the Schools card above.
Census & demographics
- Census place
- Albany, NY
- County
- Albany County · 196,626 people
- City population
- 116,921
- Metro
- Albany-Schenectady-Troy, NY
- Population (ZIP)
- 30,771
- Household income
- $83,147
- Rent vs Own
- Severe rent burden
- 1704.0
Population outlook (Albany County) Hauer SSP2
- Today (2025)
- 320,794 people
- By 2030
- 327,401 · +2.1%
- By 2040
- 338,218 · +5.4%
- By 2050
- 348,467 · +8.6%
- By 2075
- 381,693 · +19.0%
- By 2100
- 393,809 · +22.8%
Race, ethnicity, and origin ACS 2023
- Neighborhood character
- Predominantly White (69%)
- Race & ethnicity
- White 69% Black 10% Asian 8% Hispanic / Latino 7% Two or more races 7%
- Hispanic origin (detail)
- Mexican 2% Puerto Rican 2%
- Common ancestry
- Romanian 5% Lithuanian 3% Slovak 2%
- Foreign-born
- 16% · Canada, China, South Korea
- Languages at home
- 82% English-only · Other Indo-European 6% Spanish 3% Russian/Polish/Slavic 2%
Political lean MEDSL · Albany
- 2024 margin
- Strong D (+25.8) · D 62.9% · R 37.1%
- 2008→2024 swing
- -3.6pp toward R · 2008: 29.4pp · 2024: 25.8pp
- All cycles
- 2024: D+25.8 2020: D+31.4 2016: D+24.3 2012: D+31.0 2008: D+29.4
Not yet ingested
- Civics
- —
Market trends
- HPI YoY
- ▼ -133.05%
- Current HPI
- 296.0467
- Rent YoY
- ▲ 1.85%
- Metro
- Albany-Schenectady-Troy, NY
- State GDP YoY
- ▲ 2.60%
- F500 in state
- 92
Industry mix (Fortune 500 HQ in NY)
| Industry | F500 HQs | Revenue |
|---|---|---|
| Financial Services | 10 | $950B |
|
||
| Consumer Goods | 9 | $162B |
|
||
| Insurance | 4 | $225B |
|
||
| Telecommunications | 2 | $144B |
|
||
| Pharmaceuticals | 2 | $112B |
|
||
| Media / Entertainment | 2 | $69B |
|
||
Price history
+41.0% since first listed10 events — show timeline
- 2026-06-19 Listed $289,000 Global MLS
- 2019-02-28 Sold (MLS) $188,000 Global MLS
- 2019-02-28 Sold (MLS) $188,000 Global MLS
- 2019-01-06 Pending — Global MLS
- 2018-12-28 Price Changed $191,900 Global MLS
- 2018-12-04 Price Changed $193,900 Global MLS
- 2018-10-18 Price Changed $195,900 Global MLS
- 2018-09-18 Listed $199,777 Global MLS
- 2011-01-16 Listing Removed — Global MLS
- 2010-10-18 Listed $205,000 Global MLS
Property tax history
+1.4%/yrLatest (2025): $7,275 · +1.3% YoY. Source: county tax records.
Cash-flow waterfall
monthlySold comps — $/sqft
last 12 mo · ≤1 miLoading sold comps…