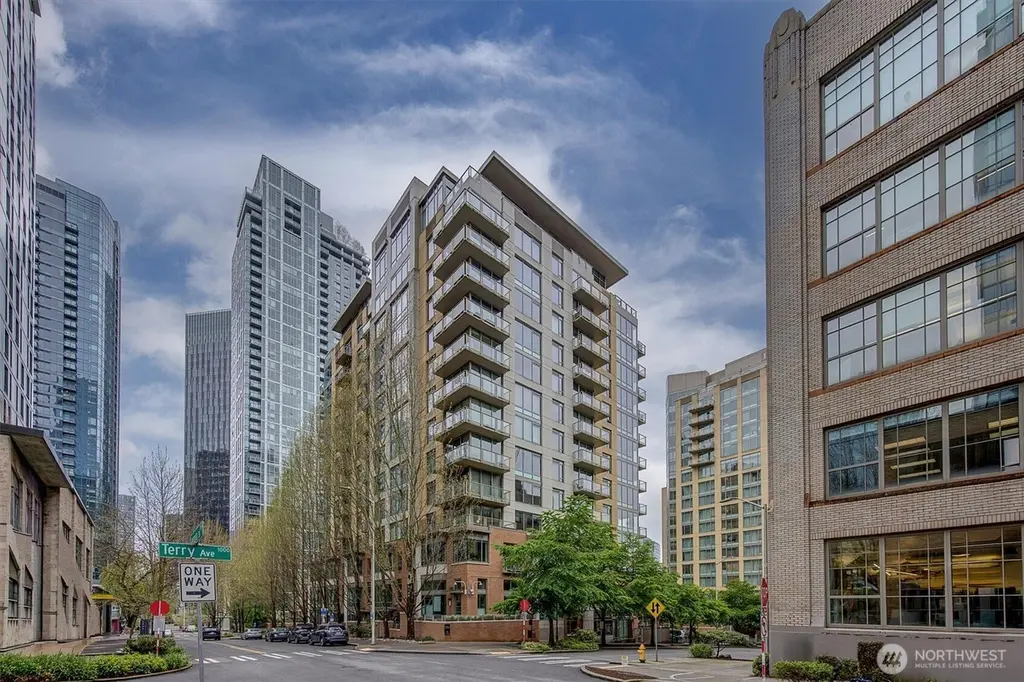
910 Lenora St Unit S1004 · Seattle, WA
Flood risk 1/10 · Minimal
- FEMA flood zone
- X (unshaded)
- Chance of flooding over 30 yrs
- 0.0%
- Est. flood insurance / yr
- $507 – $1,088
Fire risk 1/10 · Minimal
- Est. fire insurance / yr
- $604 – $1,122
Heat risk 3/10 · Minor
- Hot days now (above 86°F)
- 7 days/yr
- Hot days in 30 yrs
- 15 days/yr
Wind risk 1/10 · Minimal
- Chance of severe wind over 30 yrs
- —
Air-quality risk 7/10 · Major
- Unhealthy air days now
- 11 days/yr
- Unhealthy air days in 30 yrs
- 11 days/yr
Risk factors via First Street. Map © Google.
Why this score? — see what drove the D grade
The composite is a weighted blend of 9 inputs, each scored 0–100. Each bar is that input's sub-score; the figure is the points it added to the 100-point composite (weight × sub-score).
- ARV discount +15.0/15.0
- Schools +6.1/10.0
- Appreciation +4.6/10.0
- Cash flow +4.5/30.0
- Livability +3.8/5.0
- 1% rule +3.4/10.0
- Rent growth +2.5/5.0
- Condition / age +2.5/5.0
- DSCR +0.0/10.0
$356,000
🖨 Deal sheet (PDF) 📄 Offer letter ✓ Due diligence
Listing remarks
Stylish 1-bed/1-bath condo in the heart of South Lake Union at 2200 Westlake. Unbeatable location with easy access to Whole Foods, Amazon, Denny Park, the newly renovated Hotel 1 across the street and so much more. Benefit from a walk score of 99 & transit score 100 while still having the convenience of secure garage parking and storage. Inside, you'll find hardwood floors, a sleek modern kitchen w/ gas cooktop, a convenient built-in desk, in-unit washer & dryer and large windows showcasing city views. Impressive building amenities include fitness center, private theatre, game room, event/party room, conference room, guest suite & secure bike storage room. Friendly and hel
Key facts
- Transit score 100
- Walk score of 99
- $828 HOA
Tags
Property features AI
Finance
- Other: Bus routes nearby (40, C line); Directions note: short-term parking above Whole Foods retail lot; longer parking in Whole Foods garage or on-street
- Financial info: Listing terms: cash or conventional
- HOA & community: Monthly HOA dues (includes central hot water, common area maintenance, concierge, earthquake insurance, gas, security, sewer, water); Building amenities: clubhouse, elevator, exercise room, game/rec room, gated entry, lobby entrance, rooftop deck; Pets allowed (cats and dogs, see remarks); Building has 150 units; community has 260 units; Association contact: CWD
Exterior
- Parking: Common garage with 1 covered space (assigned parking number 291)
- Security: Security gate; Security service; Fire sprinklers
- Utilities: Electric and natural gas energy sources; Seattle City Light power; HOA-managed water and sewer; Central boiler water heater
- Home design: Attached condominium; One level unit; Southeast-facing; Rooftop deck and unit views
- Construction: Cement construction; Flat roof; Built in 2006; Condominium structure
- Exterior features: Cement/concrete exterior; Curbs, paved, sidewalk
Interior
- Kitchen: Dishwasher; Garbage disposal; Microwave; Refrigerator; Stove/Range
- Bedrooms: 1 bedroom (main level)
- Flooring: Ceramic tile; Hardwood; Carpet
- Bathrooms: 1 full bathroom with bathtub and shower (main level)
- Heating & cooling: Forced air heating; Central air conditioning; Forced air cooling
- Interior features: Gas cooking; Water heater; Insulated windows
- Laundry & utility: Washer hookup; Electric dryer hookup; Washer included; Dryer included
Neighborhood map
What this means for you Summary
Snapshot
- This is a 1-bed/1.0-bath condo listed at $356k.
Deal economics
- At list price, monthly cash flow is $-915 ($-11k/yr) — negative.
- To cash-flow at today's rent, offer at most $224k (37.2% below list).
- To meet the 1% rule (rent ≥ 1% of price), the offer needs to be $300k (15.6% below list).
- Recommended offer: $224k (37.2% below list) — sets the bar for cash-flow.
- Cap rate 3.2% vs local median 1.6% in Seattle — top-decile yield for the area; either an underpriced asset or a hidden risk that comps aren't pricing in. Stress-test before assuming the spread holds.
Location & tenants
- Location reads 75/100 on livability (#166 in WA, #4,033 nationally) — a middle-class / working-renter tenant base. Strengths: amenities A+, commute A+, employment A+; Watch: crime F, cost of living F.
- Seattle Public Schools (urban): math 64% / reading 72% proficiency, ranked #19 of 291 in WA (top 6%) — acceptable for families but not a draw, mixed tenant base, ~2y average lease.
- Zoned schools: Lowell Elementary School (331 students, 70% FRL); Mcclure Middle School (429 students, 19% FRL); Garfield High School (1,642 students, 40% FRL).
- Market conditions: Rents flat; 231 active listings in the ZIP; 40 comparable units currently listed for rent nearby; rentals leasing fast (median 0d on market — plan ~1-2 weeks tenant-placement turnaround); high-income renter base; 10,555 units permitted in King County in 2024 (7,119 in 5+ unit buildings).
Forward outlook
- Local home prices are declining (-0.8%/yr); year-one equity from $2k of loan paydown is wiped out by about $3k of value loss. Plan a longer hold.
- King County population projected at +44% by 2050 — long-run rental-demand tailwind backs the buy-and-hold thesis.
Negotiation context
- Only 11 days on market — expect competitive offers; lowballing is unlikely to land.
- 4 sale attempts since 15y ago with the ask held roughly flat each time — persistent listings suggest the price (not the market) is what's stuck; bring a comps-based counter.
- Current owner paid $208k; list at $356k implies a 71% gain — meaningful room to come down on a strong offer.
Risks & watch-outs
- Watch-outs: HOA is 28% of rent.
Questions for the listing agent
- What do current leases actually rent for vs. the listed asking? Can we see a recent rent roll and the last 12 months of T-12 income?
- What does the HOA fee cover, when was the last increase, and are there any pending special assessments or reserve-fund shortfalls?
- Any open or pending special assessments — roof, HVAC, plumbing, elevator, façade? What's the per-unit balance and payoff schedule, and is the seller paying it off at close or rolling it to the buyer?
- Is there a deadline driving the sale (1031 exchange, divorce, estate, relocation)? That informs how much negotiation room exists.
- Schools are A-rated — typically a magnet for longer-tenancy family renters. What's the average tenant stay here, and is there a school-zone premium baked into asking?
- Crime grade is F in this area — have there been break-ins, vandalism, or insurance claims at this property in the last 3 years? What carrier currently insures it and at what premium?
- The area grade is low — what's the realistic commute time and amenity access for the typical tenant pool here? Any planned neighborhood developments (good or bad) we should know about?
- What's the average days-on-market for RENTAL listings here right now (not sales)? A rising rental-DOM trend means longer vacancies and softer asking-rent achievability than the comps imply.
- What's the recent tenant-quality profile in this submarket — average credit score on applications, eviction rate, late-payment / NSF rate, and stable-employment percentage? A property-management company in the area should have these aggregated.
- How much new apartment / multifamily construction is in the pipeline within 1–3 miles? Heavy new supply (>2% of stock underway) typically softens rents 12–24 months out; light construction supports rent growth.
Investment metrics
- 1% rule
- 0.84% ✗
- Cap rate
- 3.21%
- Cash-on-cash
- -11.02%
- DSCR
- 0.51
- GRM
- 9.9
CMA / ARV
- ARV (median comp)
- $463,558
- List price
- $356,000
- Delta
- -19.10%
- Verdict
- UNDERPRICED
- Comps
- 20 within 2.0 mi
Projected returns pro-forma
-0.81% appreciation · 0.05% rent growth · sell at horizon
- IRR
- -21.6%
- Equity multiple
- 0.10×
- Total profit
- $-90,206
- Equity at exit
- $89,123
- IRR
- -18.7%
- Equity multiple
- -0.53×
- Total profit
- $-152,745
- Equity at exit
- $96,331
Cash invested: $99,680 (down + closing). Projections, not guarantees.
Landlord ↔ Tenant lean methodology
- Overall (CITY)
- 0 Strongly Tenant-Friendly
- State Washington
- 28 Tenant-Leaning · D+8
- County
- — inherits STATE
- City Seattle
- 0 Strongly Tenant-Friendly · D+52
ZIP-level market 98121
- Home prices YoY
- -0.5%
- Rents YoY
- 0.1%
- Active inventory
- 231
- Price-to-rent
- 9.9×
Monthly cashflow live
- Estimated rent
- $3,004 high interval (Pro) →
- Mortgage (P&I)
- −$1,867
- Tax est. 1.5%
- −$445 /mo · $5,340/yr
- Insurance
- −$148
- HOA
- −$828
- Vacancy / Maint / Mgmt
- −$631
- Net cashflow
- $-915
Break-even live
Sensitivity live
| Price | -10% $-669 | -5% $-792 | +0% $-915 | +5% $-1,038 | +10% $-1,161 |
|---|---|---|---|---|---|
| Rent | -10% $-1,153 | -5% $-1,034 | +0% $-915 | +5% $-797 | +10% $-678 |
| Rate | -1.0pp $-736 | -0.5pp $-825 | base $-915 | +0.5pp $-1,007 | +1.0pp $-1,101 |
UW: 25.0% down · 7.5% · 30yr · 1.5% tax · 5.0% vac · 8.0% maint · 8.0% mgmt
Financing live
Cash to close
- Down payment
- $89,000
- Closing costs
- $10,680
- Reserves months
- —
- Total cash needed
- —
Loan-product check · same deal, 3 products live
Conventional
25% down · 7.5% · 30yr
- Down + closing
- —
- Monthly P&I
- —
- Monthly cashflow
- —
- DSCR
- —
- Eligible?
- —
Personal DTI + credit; lowest rate.
DSCR
20% down · 8.5% · 30yr
- Down + closing
- —
- Monthly P&I
- —
- Monthly cashflow
- —
- DSCR
- —
- Eligible?
- —
No personal income docs; deal must DSCR.
Hard money
10% down · 12.0% · 12mo
- Down + closing
- —
- Monthly P&I
- —
- Monthly cashflow
- —
- DSCR
- —
- Eligible?
- —
Short-term bridge; refi at stabilization.
Rent comps 40 comps
| Address | Beds | Baths | Sqft | Rent | $/sqft | DOM | Units | Dist |
|---|---|---|---|---|---|---|---|---|
| 900 Lenora St #1004 Seattle, WA | 1.0 | 1.0 | 741 | $2,950 | $3.98 | 0d | 1 | 0.02mi |
| 111 Terry Ave N Seattle, WA | 2.0 | 1.0–2.0 | 821 | $4,086 | $4.97 | 0d | 28 | 0.07mi |
| 820 Lenora St Seattle, WA | 1.0–2.0 | 1.0–2.0 | 931 | $2,493 | $2.68 | 0d | 23 | 0.07mi |
| 2019 Boren Ave Seattle, WA | 3.0 | 1.0–3.0 | 1420 | $7,752 | $5.46 | 0d | 15 | 0.08mi |
| 120 Westlake Ave N Seattle, WA | 1.0–2.0 | 1.0–2.0 | 1155 | $2,623 | $2.27 | 0d | 14 | 0.10mi |
| 2010 Terry Ave Seattle, WA | 2.0 | 1.0–2.5 | 1415 | $10,184 | $7.20 | 0d | 26 | 0.11mi |
| 2030 8th Ave Seattle, WA | 2.0 | 1.0–2.0 | 882 | $3,585 | $4.06 | 0d | 16 | 0.11mi |
| 2202 8th Ave Seattle, WA | 2.0 | 1.0–2.0 | 733 | $3,402 | $4.64 | 0d | 24 | 0.11mi |
| 975 John St Seattle, WA | 1.0 | 1.0 | 457 | $2,651 | $5.80 | 0d | 16 | 0.11mi |
| 112 Boren Ave N Seattle, WA | 1.0–3.0 | 1.0–3.0 | 1058 | $2,867 | $2.71 | 0d | 52 | 0.12mi |
| 819 Virginia St #2109 Seattle, WA | 1.0 | 1.0 | 719 | $2,250 | $3.13 | 6d | 1 | 0.14mi |
| 819 Virginia St Seattle, WA | 1.0 | 1.0 | 719 | $2,250 | $3.13 | 3d | 1 | 0.14mi |
| 2014 Fairview Ave Seattle, WA | 1.0–2.0 | 1.0–2.0 | 742 | $2,862 | $3.85 | 0d | 15 | 0.15mi |
| 910 John St Seattle, WA | 1.0 | 1.0 | 677 | $2,714 | $4.01 | 0d | 6 | 0.18mi |
| 1823 Terry Ave Seattle, WA | 2.0 | 1.0–2.0 | 893 | $3,050 | $3.41 | 0d | 25 | 0.22mi |
| 210 8th Ave N Seattle, WA | 2.0 | 1.0–2.0 | 772 | $3,866 | $5.01 | 0d | 21 | 0.23mi |
| 122 Pontius Ave N Seattle, WA | 1.0 | 1.0 | 500 | $1,473 | $2.95 | 0d | 7 | 0.23mi |
| 1942 Westlake Ave Seattle, WA | 2.0 | 1.0–2.0 | 872 | $3,585 | $4.11 | 0d | 11 | 0.23mi |
| 221 Minor Ave N Seattle, WA | 2.0 | 1.0–2.0 | 795 | $2,426 | $3.05 | 0d | 17 | 0.24mi |
| 2121 6th Ave Seattle, WA | 1.0 | 1.0 | 649 | $3,019 | $4.65 | 0d | 15 | 0.24mi |
| 2101 6th Ave Unit 1506175P Seattle, WA | 1.0 | 1.0 | 635 | $6,174 | $9.72 | 1d | 1 | 0.25mi |
| 230 8th Ave N Seattle, WA | 1.0 | 1.0 | 486 | $1,702 | $3.50 | 0d | 6 | 0.26mi |
| 1823 Minor Ave Seattle, WA | 2.0 | 1.0–2.0 | 1083 | $4,502 | $4.16 | 0d | 28 | 0.26mi |
| 1820 Minor Ave Seattle, WA | — | 1.0 | 386 | $1,540 | $3.99 | 0d | 36 | 0.26mi |
| 2132 5th Ave #9 Seattle, WA | 1.0 | 1.0 | 680 | $2,050 | $3.01 | 0d | 1 | 0.27mi |
| 285 8th Ave N Seattle, WA | 2.0 | 1.0–2.0 | 782 | $3,046 | $3.89 | 0d | 15 | 0.28mi |
| 109 Dexter Ave N Seattle, WA | 1.0–2.0 | 1.0–2.0 | 768 | $1,895 | $2.47 | 0d | 2 | 0.28mi |
| 1800 Boren Ave Seattle, WA | 2.0 | 1.0–2.0 | 912 | $4,441 | $4.87 | 0d | 30 | 0.28mi |
| 301 Minor Ave N Seattle, WA | 2.0 | 1.0–2.0 | 848 | $2,854 | $3.37 | 0d | 14 | 0.29mi |
| 757 Thomas St Seattle, WA | 3.0 | 1.0–3.0 | 953 | $3,457 | $3.63 | 0d | 27 | 0.29mi |
| 757 Thomas St Unit 1202 Seattle, WA | — | 1.0 | 450 | $2,334 | $5.19 | 12d | 1 | 0.30mi |
| 1808 Minor Ave Seattle, WA | 1.0 | 1.0 | 476 | $2,750 | $5.78 | 0d | 5 | 0.30mi |
| 1808 Minor Ave Seattle, WA | 2.0 | 1.0–2.0 | 679 | $2,888 | $4.25 | 45d | 7 | 0.30mi |
| 224 Pontius Ave N Seattle, WA | 5.0 | 1.0–3.0 | 2938 | $4,221 | $1.44 | 0d | 130 | 0.30mi |
| 241 Yale Ave N Seattle, WA | 1.0 | 1.0–1.5 | 631 | $3,140 | $4.97 | 0d | 11 | 0.31mi |
| 2105 5th Ave Seattle, WA | 2.0 | 1.0–2.0 | 837 | $3,428 | $4.10 | 0d | 6 | 0.31mi |
| 2133 5th Ave Seattle, WA | — | 1.0 | 472 | $1,510 | $3.20 | 0d | 2 | 0.31mi |
| 1146 Harrison St Seattle, WA | 2.0 | 1.0–2.0 | 833 | $3,318 | $3.98 | 0d | 8 | 0.31mi |
| 737 Olive Way Seattle, WA | 1.0 | 1.0 | 690 | $2,850 | $4.13 | 21d | 1 | 0.31mi |
| 400 Boren Ave N Seattle, WA | 1.0–2.0 | 1.0–2.0 | 856 | $2,103 | $2.46 | 0d | 19 | 0.33mi |
HOA detail condo
- Monthly dues
- $828 · $9,936/yr
- Likely covers
- gasgym
- Assessments
- None detected in remarks — confirm with the listing agent.
Listing history 33 events
-
2026-06-22days on market $356,000 Active 11 DOM
-
2026-06-21days on market $356,000 Active 10 DOM
-
2026-06-21days on market $356,000 Active 9 DOM
-
2026-06-19days on market $356,000 Active 8 DOM
-
2026-06-18days on market $356,000 Active 7 DOM
-
2026-06-17days on market $356,000 Active 6 DOM
-
2026-06-16days on market $356,000 Active 5 DOM
-
2026-06-15days on market $356,000 Active 4 DOM
-
2026-06-15days on market $356,000 Active 3 DOM
-
2026-06-13days on market $356,000 Active 2 DOM
-
2026-06-12pricedays on market $356,000 Active 1 DOM
-
2026-06-10days on market $375,000 Active 47 DOM
-
2026-06-09days on market $375,000 Active 46 DOM
-
2026-06-08days on market $375,000 Active 45 DOM
-
2026-06-07days on market $375,000 Active 44 DOM
-
2026-06-07days on market $375,000 Active 43 DOM
-
2026-06-04days on market $375,000 Active 41 DOM
-
2026-06-03days on market $375,000 Active 40 DOM
-
2026-06-02days on market $375,000 Active 39 DOM
-
2026-06-01days on market $375,000 Active 38 DOM
-
2026-05-31days on market $375,000 Active 37 DOM
-
2026-04-24$375,000 Active
-
2012-01-05historical
-
2011-12-29soldstatus $208,000 Sold
-
2011-12-01status Pending
-
2011-11-18price $218,000 Active
-
2011-11-18status Active
-
2011-10-14status Pending - Backup Offer Requested
-
2011-10-13status Pending
-
2011-10-04status Pending Inspection
-
2011-09-15price $222,000
-
2011-09-01price $242,000
-
2011-08-19$262,000 Active
ⓘ Source: listings_history table (triggers on properties + properties_extension) + one-shot
backfill from property_details.listing_events for pre-trigger history.
Climate risk First Street
- Flood 1/10 Low FEMA zone X (unshaded) · 0% chance over 30 yrs
- Wildfire 1/10 Low
- Heat 3/10 Moderate 7 d/yr ≥86°F today · 15 d/yr by 30 yrs out
- Wind 1/10 Low
- Air quality 7/10 Severe 11 unhealthy d/yr today · 11 by 30 yrs out
Nearby sold comps map
Loading sold comps map…
Walkable amenities ~0.75 mi
Loading nearby amenities…
Taxation est. · year 1
- Rental income
- $36,046
- − Mortgage interest
- −$19,942
- − Property taxes
- −$5,340
- − Insurance
- −$1,780
- − Repairs & maintenance
- −$2,884
- − Management
- −$2,884
- − HOA
- −$9,936
- − Depreciation
- −$10,356
- Taxable loss
- −$17,076
- Est. tax savings @ 24.0%
- +$4,098
- After-tax cash flow
- $-6,885/yr
For passive investors: Depreciation is non-cash, so a rental often shows a tax loss while cash-flowing — sheltering income. Rental losses are passive: they offset passive income freely, and up to $25,000/yr can offset ordinary (W-2) income if you actively participate and your MAGI is under $100k (phasing out to $0 by $150k); unused losses carry forward. On sale, claimed depreciation is recaptured at up to 25%, and gains may owe capital-gains tax (a 1031 exchange can defer both). Figures are a year-1 estimate at your 24.0% rate — not tax advice; consult a CPA.
Schools (NCES district)
- District
- Seattle Public Schools
- NCES district ID
- 5307710
- Math proficiency
- 64% ▼ -1.00%
- Reading proficiency
- 72% ▬ 0.00%
- Median HH income
- $68,695
- Composite
- 60.76/100
- National rank
- #1649
- State rank
- #19 of 291 in WA
Livability — Seattle
- Score
- 75/100
- State rank
- #166
- US rank
- #4033
Category grades
Schools grade is shown separately in the Schools card above.
Census & demographics
- Census place
- Seattle, WA
- County
- King County · 2,251,916 people
- City population
- 706,262
- Metro
- Seattle-Tacoma-Bellevue, WA
- Population (ZIP)
- 21,166
- Household income
- $152,019
- Rent vs Own
- Severe rent burden
- 1835.0
Population outlook (King County) Hauer SSP2
- Today (2025)
- 2,576,485 people
- By 2030
- 2,803,316 · +8.8%
- By 2040
- 3,255,921 · +26.4%
- By 2050
- 3,706,444 · +43.9%
- By 2075
- 4,746,063 · +84.2%
- By 2100
- 5,407,730 · +109.9%
Race, ethnicity, and origin ACS 2023
- Neighborhood character
- Diverse neighborhood (Simpson 0.65)
- Race & ethnicity
- White 47% Asian 34% Two or more races 9% Hispanic / Latino 8% Black 3%
- Hispanic origin (detail)
- Mexican 6%
- Common ancestry
- Portuguese 3% Italian 3% Slovak 2%
- Foreign-born
- 40% · China, Canada, South Korea
- Languages at home
- 59% English-only · Other Indo-European 13% Chinese 10% Spanish 5%
Political lean MEDSL · King
- 2024 margin
- Solid D (+51.7) · D 74.2% · R 22.5% · Other 3.4%
- 2008→2024 swing
- +9.6pp toward D · 2008: 42.1pp · 2024: 51.7pp
- All cycles
- 2024: D+51.7 2020: D+52.7 2016: D+50.4 2012: D+39.9 2008: D+42.1
Not yet ingested
- Civics
- —
Market trends
- HPI YoY
- ▼ -0.81%
- Current HPI
- 165.0124
- Rent YoY
- ▬ 0.05%
- Metro
- Seattle-Tacoma-Bellevue, WA
- State GDP YoY
- ▲ 4.65%
- F500 in state
- 22
Industry mix (Fortune 500 HQ in WA)
| Industry | F500 HQs | Revenue |
|---|---|---|
| Retail | 2 | $269B |
|
||
| Technology / Retail | 1 | $638B |
|
||
| Technology | 1 | $245B |
|
||
| Telecommunications | 1 | $38B |
|
||
| Food / Beverage | 1 | $36B |
|
||
| Automotive / Trucks | 1 | $34B |
|
||
Price history
+35.9% since first listed13 events — show timeline
- 2026-06-11 Listed $356,000 NWMLS as Distributed by MLS Grid
- 2026-06-11 Listed $356,000 NWMLS as Distributed by MLS Grid
- 2012-01-05 Delisted — NWMLS as Distributed by MLS Grid
- 2011-12-29 Sold (MLS) $208,000 NWMLS as Distributed by MLS Grid
- 2011-12-01 Pending — NWMLS as Distributed by MLS Grid
- 2011-11-18 Relisted — NWMLS as Distributed by MLS Grid
- 2011-11-18 Price Changed $218,000 NWMLS as Distributed by MLS Grid
- 2011-10-14 Pending — NWMLS as Distributed by MLS Grid
- 2011-10-13 Pending — NWMLS as Distributed by MLS Grid
- 2011-10-04 Pending — NWMLS as Distributed by MLS Grid
- 2011-09-15 Price Changed $222,000 NWMLS as Distributed by MLS Grid
- 2011-09-01 Price Changed $242,000 NWMLS as Distributed by MLS Grid
- 2011-08-19 Listed $262,000 NWMLS as Distributed by MLS Grid
Cash-flow waterfall
monthlySold comps — $/sqft
last 12 mo · ≤1 miLoading sold comps…