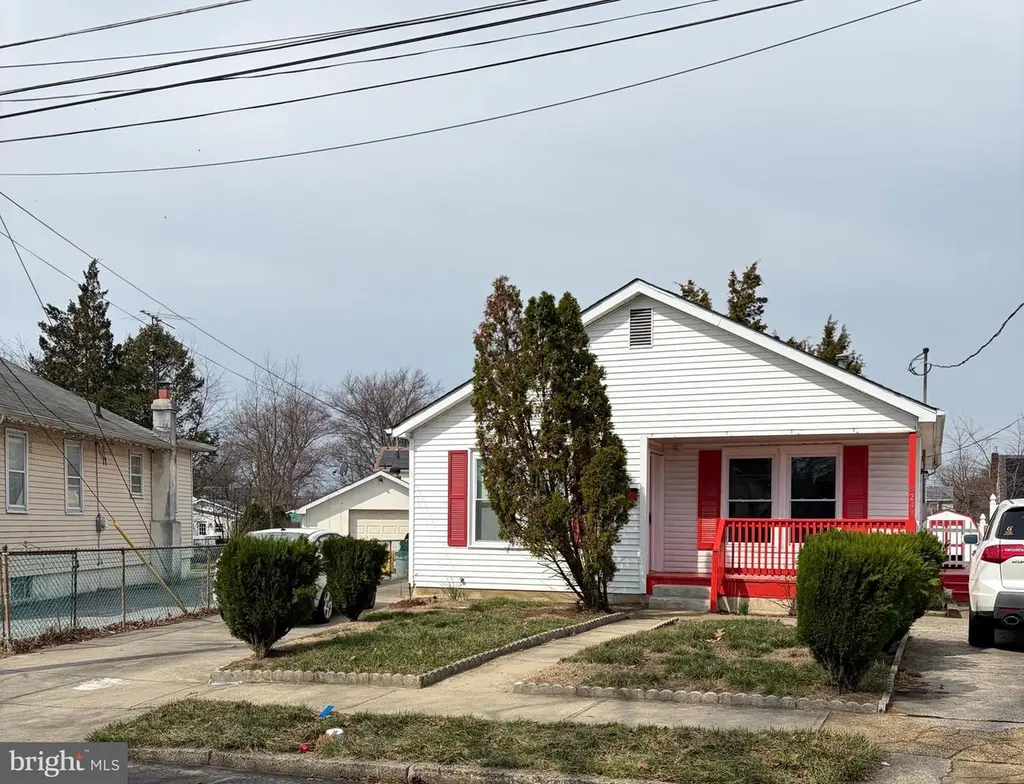
8249 Eden Ln · Palmyra, NJ
Flood risk 1/10 · Minimal
- FEMA flood zone
- X (unshaded)
- Chance of flooding over 30 yrs
- 0.0%
- Est. flood insurance / yr
- $507 – $1,088
Fire risk 1/10 · Minimal
- Est. fire insurance / yr
- $526 – $976
Heat risk 7/10 · Major
- Hot days now (above 104°F)
- 7 days/yr
- Hot days in 30 yrs
- 15 days/yr
Wind risk 6/10 · Moderate
- Chance of severe wind over 30 yrs
- 27.0%
Air-quality risk 4/10 · Minor
- Unhealthy air days now
- 5 days/yr
- Unhealthy air days in 30 yrs
- 7 days/yr
Risk factors via First Street. Map © Google.
Why this score? — see what drove the D+ grade
The composite is a weighted blend of 9 inputs, each scored 0–100. Each bar is that input's sub-score; the figure is the points it added to the 100-point composite (weight × sub-score).
- Cash flow +14.8/30.0
- ARV discount +12.6/15.0
- 1% rule +4.8/10.0
- DSCR +4.5/10.0
- Livability +3.6/5.0
- Rent growth +2.5/5.0
- Condition / age +2.5/5.0
- Schools +2.0/10.0
- Appreciation +0.0/10.0
$275,000
🖨 Deal sheet (PDF) 📄 Offer letter ✓ Due diligence
Listing remarks
Come check out this beautiful and recently updated property in the heart of Pennsauken, NJ. The property offers comfort and modern touches, just minutes away from Philadelphia. As you step inside a spacious living room and kitchen, 3 bedrooms, and 2 full bathrooms. The property has 2 driveways that can fit up to 2 cars each, a big backyard, and so much more. Schedule your appointment today.
Key facts
- Big backyard
- 2 driveways
- Spacious living room
Tags
Property features AI
Finance
- Financial info: Ownership is fee simple
Exterior
- Parking: Driveway
- Utilities: Public sewer
- Home design: Detached structure; Above-grade finished living area reported as 1,236 (assessor)
- Construction: Frame construction; Slab foundation; Above-grade and below-grade structures noted; Year built recorded by assessor
- Exterior features: Lot dimensions approximately 61.00 x 0.00; No tidal water
Interior
- Bedrooms: 3 bedrooms on the main level
- Bathrooms: 2 full bathrooms (both on the main level)
- Heating & cooling: Forced air heating fueled by natural gas; Central air conditioning (central A/C) with natural gas cooling fuel; Natural gas hot water
- Interior features: No basement; Living area recorded from assessor
Neighborhood map
What this means for you Summary
Snapshot
- This is a 3-bed/2.0-bath single-family listed at $275k.
Deal economics
- At list price, monthly cash flow is $77 ($927/yr) — positive.
- The deal already cash-flows at list — no discount required.
- To meet the 1% rule (rent ≥ 1% of price), the offer needs to be $270k (2.0% below list).
- Recommended offer: $258k (6.0% below list) — sets the bar for market timing.
- Cap rate 6.6% vs local median 3.6% in Palmyra — top-decile yield for the area; either an underpriced asset or a hidden risk that comps aren't pricing in. Stress-test before assuming the spread holds.
Location & tenants
- Location reads 72/100 on livability (#204 in NJ) — a middle-class / working-renter tenant base. Strengths: housing A+, employment A-, crime B+; Watch: cost of living D+, amenities F, health & safety D-.
- Pennsauken Township Board Of Education School District (suburban): math 12% / reading 32% proficiency, ranked #410 of 472 in NJ (top 87%) — low school quality limits family demand, transient renter base, plan for 1-2y turnover.
- Zoned schools: Delair Elementary School (math 8% / reading 17%, grade F, #1,172 of 1,303 statewide, top 91%, 285 students, 47% FRL); Howard M. Phifer Middle School (math 14% / reading 37%, grade F, #359 of 431 statewide, top 84%, 1,045 students, 43% FRL); Pennsauken High School (math 8% / reading 45%, grade F, #319 of 399 statewide, top 80%, 1,530 students, 37% FRL).
- Market conditions: 61 active listings in the ZIP; 3 comparable units currently listed for rent nearby; rentals leasing fast (median 8d on market — plan ~1-2 weeks tenant-placement turnaround); solid renter incomes; 1,018 units permitted in Camden County in 2024 (509 in 5+ unit buildings).
- This rent runs 39% of the median local income ($84k/yr) — at the standard rent-burdened threshold; future hikes will face affordability resistance.
Forward outlook
- Local home prices are declining (-3.0%/yr); year-one equity from $2k of loan paydown is wiped out by about $8k of value loss. Plan a longer hold.
- Camden County population projected to shrink 8% by 2050 — rents likely to lag national; underwrite the cash flow, not the appreciation.
Negotiation context
- It's been on market 66 days — a 6% lower offer ($258k) is reasonable based on typical stale-listing flexibility.
- 2 sale attempts; this cycle's ask has dropped $23k (8%) from the opening price — seller is motivated, your offer sets the floor, not the list.
- Current owner paid $75k; list at $275k implies a 267% gain — meaningful room to come down on a strong offer.
Risks & watch-outs
- Climate carrying-cost: major wind risk, 27% chance of damaging wind over 30y; extreme-heat days projected 7→15/yr by 2055 (HVAC capex compounding) — expect insurance premiums to compound above CPI over the hold.
Questions for the listing agent
- It's been on market 66 days. Have you received any prior offers? Is the seller open to a 6% concession, seller financing, or rate buy-down credit?
- Why hasn't it sold? Are there any deal-killer items the seller is aware of (foundation, flood, title, zoning, code violations)?
- Is there a deadline driving the sale (1031 exchange, divorce, estate, relocation)? That informs how much negotiation room exists.
- The area grade is low — what's the realistic commute time and amenity access for the typical tenant pool here? Any planned neighborhood developments (good or bad) we should know about?
- What's the average days-on-market for RENTAL listings here right now (not sales)? A rising rental-DOM trend means longer vacancies and softer asking-rent achievability than the comps imply.
- What's the recent tenant-quality profile in this submarket — average credit score on applications, eviction rate, late-payment / NSF rate, and stable-employment percentage? A property-management company in the area should have these aggregated.
- How much new for-sale + rental construction is in the pipeline within 1–3 miles? Heavy new supply typically softens prices + rents 12–24 months out; constrained supply supports both.
Investment metrics
- 1% rule
- 0.98% ✗
- Cap rate
- 6.63%
- Cash-on-cash
- 1.20%
- DSCR
- 1.05
- GRM
- 8.5
CMA / ARV
- ARV (on-the-fly)
- $310,236
- Comps found
- 12
Show comp detail 12 sales within ~0.75 mi
| Address | Dist | Beds/Ba | Sqft | Sold | Price | $/sf | Match |
|---|---|---|---|---|---|---|---|
| 8412 Bannard Ave | 0.26mi | 3/1.5 | 1,216 (-2%) | 6mo | $195,000 | $160 | 78 |
| 8455 Balfour Rd | 0.18mi | 3/1.5 | 1,199 (-3%) | 11mo | $285,000 | $238 | 76 |
| 8220 Stow Rd | 0.24mi | 3/1.5 | 1,272 (+3%) | 14mo | $320,000 | $252 | 70 |
| 8461 Holman Ave | 0.19mi | 3/2.5 | 1,296 (+5%) | 15mo | $305,000 | $235 | 68 |
| 8337 Bannard Ave | 0.28mi | 3/2.0 | 1,144 (-7%) | 16mo | $300,000 | $262 | 61 |
| 8453 Sheppard Rd | 0.17mi | 3/1.0 | 1,400 (+13%) | 9mo | $260,000 | $186 | 59 |
| 7924 River Rd | 0.31mi | 4/1.0 (+1) | 1,356 (+10%) | 6mo | $160,000 | $118 | 55 |
| 1556 Velde Ave | 0.56mi | 3/1.5 | 1,344 (+9%) | 8mo | $350,000 | $260 | 50 |
| 7318 Zimmerman Ave | 0.74mi | 3/2.0 | 1,321 (+7%) | 8mo | $360,000 | $273 | 48 |
| 7929 Stow Rd | 0.37mi | 3/1.0 | 1,056 (-15%) | 12mo | $265,000 | $251 | 44 |
| 7325 Remington Ave | 0.63mi | 3/2.0 | 1,132 (-8%) | 15mo | $302,000 | $267 | 44 |
| 525 Derousse Ave | 0.68mi | 4/1.0 (+1) | 1,074 (-13%) | 12mo | $160,000 | $149 | 27 |
Match score weights: distance 35% · size 25% · config 20% · recency 20%. Top-matched comps best support the ARV.
Projected returns pro-forma
-3.0% appreciation · 3.0% rent growth · sell at horizon
- IRR
- -14.3%
- Equity multiple
- 0.49×
- Total profit
- $-39,507
- Equity at exit
- $41,003
- IRR
- -5.5%
- Equity multiple
- 0.64×
- Total profit
- $-27,521
- Equity at exit
- $23,777
Cash invested: $77,000 (down + closing). Projections, not guarantees.
Landlord ↔ Tenant lean methodology
- Overall (STATE)
- 21 Tenant-Leaning
- State New Jersey
- 21 Tenant-Leaning · D+6
- County
- — inherits STATE
- City
- — inherits STATE
ZIP-level market 08110
- Home prices YoY
- -10.9%
- Active inventory
- 61
- Price-to-rent
- 8.5×
Monthly cashflow live
- Estimated rent
- $2,696 medium interval (Pro) →
- Mortgage (P&I)
- −$1,442
- Tax from tax record
- −$495 /mo · $5,946/yr
- Insurance
- −$115
- HOA
- −$0
- Vacancy / Maint / Mgmt
- −$566
- Net cashflow
- $77
Break-even live
Sensitivity live
| Price | -10% $233 | -5% $155 | +0% $77 | +5% $-1 | +10% $-78 |
|---|---|---|---|---|---|
| Rent | -10% $-136 | -5% $-29 | +0% $77 | +5% $184 | +10% $290 |
| Rate | -1.0pp $216 | -0.5pp $147 | base $77 | +0.5pp $6 | +1.0pp $-66 |
UW: 25.0% down · 7.5% · 30yr · 1.5% tax · 5.0% vac · 8.0% maint · 8.0% mgmt
Financing live
Cash to close
- Down payment
- $68,750
- Closing costs
- $8,250
- Reserves months
- —
- Total cash needed
- —
Loan-product check · same deal, 3 products live
Conventional
25% down · 7.5% · 30yr
- Down + closing
- —
- Monthly P&I
- —
- Monthly cashflow
- —
- DSCR
- —
- Eligible?
- —
Personal DTI + credit; lowest rate.
DSCR
20% down · 8.5% · 30yr
- Down + closing
- —
- Monthly P&I
- —
- Monthly cashflow
- —
- DSCR
- —
- Eligible?
- —
No personal income docs; deal must DSCR.
Hard money
10% down · 12.0% · 12mo
- Down + closing
- —
- Monthly P&I
- —
- Monthly cashflow
- —
- DSCR
- —
- Eligible?
- —
Short-term bridge; refi at stabilization.
Rent comps 3 comps
| Address | Beds | Baths | Sqft | Rent | $/sqft | DOM | Units | Dist |
|---|---|---|---|---|---|---|---|---|
| 8117 Stow Rd Pennsauken, NJ | 3.0 | 1.0 | 1056 | $2,450 | $2.32 | 7d | 1 | 0.36mi |
| 7406 Jackson Ave Pennsauken, NJ | 3.0 | 2.0 | 1344 | $2,900 | $2.16 | 19d | 1 | 0.96mi |
| 2100 Haddonfield Rd Pennsauken, NJ | 1.0–2.0 | 1.0–2.0 | 904 | $2,833 | $3.13 | 0d | 33 | 1.44mi |
Listing history 17 events
-
2026-06-21days on market $275,000 Active 66 DOM
-
2026-06-18days on market $275,000 Active 63 DOM
-
2026-06-17days on market $275,000 Active 62 DOM
-
2026-06-16days on market $275,000 Active 61 DOM
-
2026-06-15days on market $275,000 Active 60 DOM
-
2026-06-13days on market $275,000 Active 58 DOM
-
2026-06-13pricestatusdays on market $275,000 Active 57 DOM
-
2026-05-07historical Active Under Contract
-
2026-04-27price $285,000
-
2026-04-17price $293,000
-
2026-04-15price $293,999
-
2026-03-13$298,000 Active
-
2026-02-21historical
-
2026-01-14price $299,000
-
2025-10-08$329,000 Active
-
1998-05-29soldstatus $75,000
-
1996-11-14soldstatus $87,000
ⓘ Source: listings_history table (triggers on properties + properties_extension) + one-shot
backfill from property_details.listing_events for pre-trigger history.
Tax reassessment forecast NJ · Partial reset (capped growth)
- Current annual tax
- $5,946 · $495/mo
- Projected year-2 tax
- $6,397 · $533/mo
- Expected delta
- +$451/yr (+$38/mo · 7.6%)
ⓘ Screening estimate from a state-policy table — verify with the county assessor before closing.
Climate risk First Street
- Flood 1/10 Low FEMA zone X (unshaded) · 0% chance over 30 yrs
- Wildfire 1/10 Low
- Heat 7/10 Severe 7 d/yr ≥104°F today · 15 d/yr by 30 yrs out
- Wind 6/10 Major 27% chance of damaging wind over 30 yrs
- Air quality 4/10 Moderate 5 unhealthy d/yr today · 7 by 30 yrs out
Nearby sold comps map
Loading sold comps map…
Walkable amenities ~0.75 mi
Loading nearby amenities…
Taxation est. · year 1
- Rental income
- $32,346
- − Mortgage interest
- −$15,404
- − Property taxes
- −$5,946
- − Insurance
- −$1,375
- − Repairs & maintenance
- −$2,588
- − Management
- −$2,588
- − Depreciation
- −$8,000
- Taxable loss
- −$3,554
- Est. tax savings @ 24.0%
- +$853
- After-tax cash flow
- $1,780/yr
For passive investors: Depreciation is non-cash, so a rental often shows a tax loss while cash-flowing — sheltering income. Rental losses are passive: they offset passive income freely, and up to $25,000/yr can offset ordinary (W-2) income if you actively participate and your MAGI is under $100k (phasing out to $0 by $150k); unused losses carry forward. On sale, claimed depreciation is recaptured at up to 25%, and gains may owe capital-gains tax (a 1031 exchange can defer both). Figures are a year-1 estimate at your 24.0% rate — not tax advice; consult a CPA.
Schools (NCES district)
- District
- Pennsauken Township Board Of Education School District
- NCES district ID
- 3412870
- Math proficiency
- 12% ▼ -16.00%
- Reading proficiency
- 32% ▼ -3.00%
- Median HH income
- $60,336
- Composite
- 20.48/100
- National rank
- #8573
- State rank
- #410 of 472 in NJ
Livability — Palmyra
- Score
- 72/100
- State rank
- #204
- US rank
- #5735
Category grades
Schools grade is shown separately in the Schools card above.
Census & demographics
- County
- Camden County · 407,624 people
- City population
- 7,447
- Metro
- Philadelphia-Camden-Wilmington, PA-NJ-DE-MD
- Population (ZIP)
- 19,158
- Household income
- $83,729
- Rent vs Own
- Severe rent burden
- 404.0
Population outlook (Camden County) Hauer SSP2
- Today (2025)
- 507,964 people
- By 2030
- 502,182 · -1.1%
- By 2040
- 485,602 · -4.4%
- By 2050
- 465,630 · -8.3%
- By 2075
- 419,986 · -17.3%
- By 2100
- 369,492 · -27.3%
Race, ethnicity, and origin ACS 2023
- Neighborhood character
- Diverse neighborhood (Simpson 0.67)
- Race & ethnicity
- Hispanic / Latino 46% Black 30% White 14% Two or more races 13% Asian 7% Native American 2%
- Hispanic origin (detail)
- Mexican 5% Puerto Rican 17% Dominican 16%
- Common ancestry
- Romanian 2% Hispanic 1% Iranian 1%
- Foreign-born
- 28% · Canada, Vietnam, Jamaica
- Languages at home
- 52% English-only · Spanish 35% Vietnamese 4% French/Haitian/Cajun 1%
Political lean MEDSL · Camden
- 2024 margin
- Strong D (+27.4) · D 63.0% · R 35.5% · Other 1.5%
- 2008→2024 swing
- -8.8pp toward R · 2008: 36.2pp · 2024: 27.4pp
- All cycles
- 2024: D+27.4 2020: D+33.5 2016: D+32.4 2012: D+36.6 2008: D+36.2
Not yet ingested
- Civics
- —
Market trends
- HPI YoY
- ▼ -53.44%
- Current HPI
- 436.2879
- Rent YoY
- —
- Metro
- Philadelphia-Camden-Wilmington, PA-NJ-DE-MD
- State GDP YoY
- ▲ 2.05%
- F500 in state
- 34
Industry mix (Fortune 500 HQ in NJ)
| Industry | F500 HQs | Revenue |
|---|---|---|
| Consumer Goods | 3 | $31B |
|
||
| Pharmaceuticals | 2 | $153B |
|
||
| Technology | 2 | $21B |
|
||
| Insurance | 2 | $20B |
|
||
| Healthcare | 2 | $19B |
|
||
| Financial Services | 1 | $70B |
|
||
Price history
+227.6% since first listed10 events — show timeline
- 2026-05-07 Contingent — BRIGHT MLS
- 2026-04-27 Price Changed $285,000 BRIGHT MLS
- 2026-04-17 Price Changed $293,000 BRIGHT MLS
- 2026-04-15 Price Changed $293,999 BRIGHT MLS
- 2026-03-13 Listed $298,000 BRIGHT MLS
- 2026-02-21 Listing Removed — BRIGHT MLS
- 2026-01-14 Price Changed $299,000 BRIGHT MLS
- 2025-10-08 Listed $329,000 BRIGHT MLS
- 1998-05-29 Sold (Public Records) $75,000 Public Records
- 1996-11-14 Sold (Public Records) $87,000 Public Records
Property tax history
+2.3%/yrLatest (2025): $5,946 · +6.2% YoY. Source: county tax records.
Cash-flow waterfall
monthlySold comps — $/sqft
last 12 mo · ≤1 miLoading sold comps…