426 1st Ave · Harvey, LA
Flood risk 8/10 · Major
- FEMA flood zone
- X
- Chance of flooding over 30 yrs
- 0.6%
- Est. flood insurance / yr
- $507 – $1,088
Fire risk 1/10 · Minimal
- Est. fire insurance / yr
- $1,269 – $2,357
Heat risk 10/10 · Severe
- Hot days now (above 108°F)
- 7 days/yr
- Hot days in 30 yrs
- 21 days/yr
Wind risk 10/10 · Severe
- Chance of severe wind over 30 yrs
- 99.0%
Air-quality risk 3/10 · Minor
- Unhealthy air days now
- 3 days/yr
- Unhealthy air days in 30 yrs
- 4 days/yr
Risk factors via First Street. Map © Google.
Why this score? — see what drove the C grade
The composite is a weighted blend of 9 inputs, each scored 0–100. Each bar is that input's sub-score; the figure is the points it added to the 100-point composite (weight × sub-score).
- Cash flow +23.2/30.0
- ARV discount +10.0/15.0
- DSCR +7.4/10.0
- 1% rule +4.9/10.0
- Livability +3.2/5.0
- Schools +2.5/10.0
- Condition / age +2.5/5.0
- Rent growth +1.5/5.0
- Appreciation +0.0/10.0
$289,000
🖨 Deal sheet 📄 Offer letter ✓ Due diligence
Listing remarks MLS
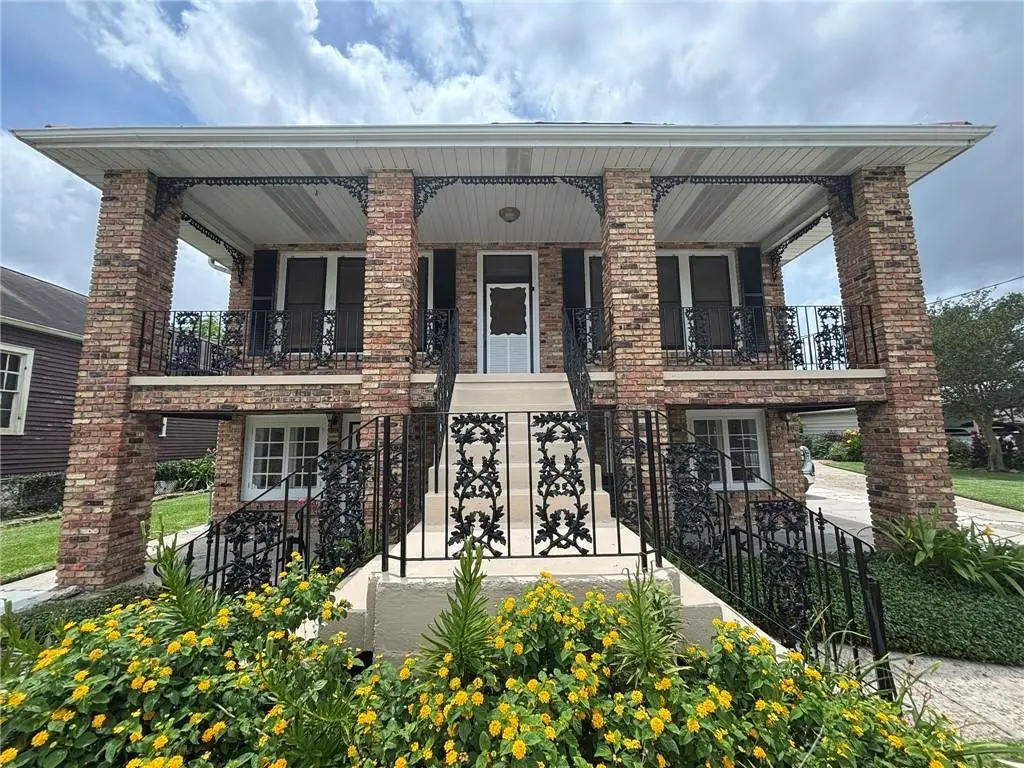
Step back in time and experience the charm and character of this stunning home! You'll be captivated by the exceptional curb appeal featuring an elegant iron fence, lush gardens, and timeless architectural details. Inside, the home's historic beauty shines through with graceful archways, soaring ceilings, and original glass chandeliers that add warmth and sophistication throughout. Rich in character and craftsmanship, this unique property offers a rare opportunity to own a piece of Harvey's history while enjoying all the charm of a bygone era. One of the home's most impressive features is its expansive front porch space, offering both upper and lower covered porches that provide the perfect setting for relaxing, entertaining, or simply enjoying the peaceful surroundings. The generous outdoor living spaces continue throughout the property, creating multiple areas to gather and unwind while taking in the beauty of the grounds.Additional features include a separate 2-car garage, ample outdoor space, and a park-like setting rarely found today. Rich in history, character, and timeless appeal, this exceptional property offers a unique opportunity to own a true architectural treasure while enjoying the beauty and tranquility of its expansive grounds. Whether you're drawn to historic architecture, intricate details, or simply appreciate homes with a story to tell, this one is sure to impress.
Key facts
- Soaring ceilings
- Iron fence
- Lush gardens
Tags
Property features AI
Exterior
- Parking: Driveway; Detached garage; Garage; Boat parking; RV access/parking
- Utilities: Public water; Public sewer
- Home design: 3 stories; Brick construction; Shingle roof; Raised and slab foundation; Property in very good condition; City lot on an oversized parcel (approx. 96 x 125)
- Construction: Built with brick; Shingle roof; Raised and slab foundation
- Exterior features: Courtyard; Patio; Brick and concrete patio; Apartment (additional structure)
Interior
- Kitchen: Oven; Range; Refrigerator
- Bathrooms: 3 full bathrooms
- Heating & cooling: Central heating; Window unit(s) for cooling
- Interior features: Ceiling fan(s); Guest accommodations
- Laundry & utility: Washer hookup; Dryer hookup; Washer; Dryer
Neighborhood map
What this means for you Summary
Snapshot
- This is a 3-bed/3.0-bath single-family listed at $289k.
Deal economics
- At list price, monthly cash flow is $456 ($5k/yr) — positive.
- The deal already cash-flows at list — no discount required.
- To meet the 1% rule (rent ≥ 1% of price), the offer needs to be $285k (1.5% below list).
- Recommended offer: $285k (1.5% below list) — sets the bar for market timing.
- Cap rate 8.5% vs local median 4.8% in Harvey — top-decile yield for the area; either an underpriced asset or a hidden risk that comps aren't pricing in. Stress-test before assuming the spread holds.
Location & tenants
- Location reads 64/100 on livability (#166 in LA) — a middle-class / working-renter tenant base. Strengths: cost of living A+, housing A+; Watch: schools D+, crime F, amenities F.
- Jefferson Parish (suburban): math 24% / reading 34% proficiency, ranked #44 of 98 in LA (top 45%) — low school quality limits family demand, transient renter base, plan for 1-2y turnover; 70% free/reduced lunch — lower-income household profile, screen leases tightly.
- Market conditions: Rents falling (-3.9%/yr); 187 active listings in the ZIP; 13 comparable units currently listed for rent nearby; rentals lingering (median 44d on market — plan ~5-8 weeks vacancy on turnover, expect pricing pressure); 54% of comp listings sitting > 30 days — soft ceiling on asking rent; 518 units permitted in Jefferson Parish in 2024 (43 in 5+ unit buildings).
- At $2,847/mo this rent would consume 55% of the median local household income ($62k/yr) (locally 1992% of renters already pay >50% of income on rent) — very limited rent-growth headroom before tenants either downsize or default.
Forward outlook
- Local home prices are declining (-3.0%/yr); year-one equity from $2k of loan paydown is wiped out by about $9k of value loss. Plan a longer hold.
Negotiation context
- It's been on market 17 days — a 2% lower offer ($285k) is reasonable based on typical stale-listing flexibility.
- 2 sale attempts with the ask held roughly flat each time — persistent listings suggest the price (not the market) is what's stuck; bring a comps-based counter.
Risks & watch-outs
- Watch-outs: flood insurance adds $66/mo; built in 1924 — expect roof / HVAC / electrical / plumbing capex.
- Climate carrying-cost: severe flood risk; severe wind risk, 99% chance of damaging wind over 30y; extreme-heat days projected 7→21/yr by 2055 (HVAC capex compounding) — expect insurance premiums to compound above CPI over the hold.
Questions for the listing agent
- Built in 1924 — when were the roof, HVAC, electrical panel, plumbing, and water heater last replaced?
- What's the actual annual flood-insurance premium (NFIP or private), and is the property in a SFHA with mandatory coverage?
- Is there a deadline driving the sale (1031 exchange, divorce, estate, relocation)? That informs how much negotiation room exists.
- Schools are D-rated, which usually means shorter tenancies and higher turnover. Who's the typical renter profile here, and what's been the actual vacancy rate?
- Crime grade is F in this area — have there been break-ins, vandalism, or insurance claims at this property in the last 3 years? What carrier currently insures it and at what premium?
- What's the average days-on-market for RENTAL listings here right now (not sales)? A rising rental-DOM trend means longer vacancies and softer asking-rent achievability than the comps imply.
- What's the recent tenant-quality profile in this submarket — average credit score on applications, eviction rate, late-payment / NSF rate, and stable-employment percentage? A property-management company in the area should have these aggregated.
- How much new for-sale + rental construction is in the pipeline within 1–3 miles? Heavy new supply typically softens prices + rents 12–24 months out; constrained supply supports both.
Investment metrics
- 1% rule
- 0.99% ✗
- Cap rate
- 8.46%
- Cash-on-cash
- 7.75%
- DSCR
- 1.34
- GRM
- 8.5
CMA / ARV
- ARV (on-the-fly)
- $305,730
- Comps found
- 1
Show comp detail 1 sale within ~0.75 mi
| Address | Dist | Beds/Ba | Sqft | Sold | Price | $/sf | Match |
|---|---|---|---|---|---|---|---|
| 527 Gaudet Dr | 0.48mi | 4/2.0 (+1) | 2,061 (-13%) | 20mo | $265,000 | $129 | 30 |
Match score weights: distance 35% · size 25% · config 20% · recency 20%. Top-matched comps best support the ARV.
Projected returns pro-forma
-3.0% appreciation · 0.0% rent growth · sell at horizon
- IRR
- -9.1%
- Equity multiple
- 0.68×
- Total profit
- $-26,193
- Equity at exit
- $43,091
- IRR
- -3.8%
- Equity multiple
- 0.78×
- Total profit
- $-17,965
- Equity at exit
- $24,987
Cash invested: $80,920 (down + closing). Projections, not guarantees.
Landlord ↔ Tenant lean methodology
- Overall (STATE)
- 90 Strongly Landlord-Friendly
- State Louisiana
- 90 Strongly Landlord-Friendly · R+12
- County
- — inherits STATE
- City
- — inherits STATE
ZIP-level market 70058
- Rents YoY
- -3.9%
- Active inventory
- 187
- Price-to-rent
- 8.5×
Monthly cashflow live
- Estimated rent
- $2,847 high interval (Pro) →
- Mortgage (P&I)
- −$1,516
- Tax from tax record
- −$91 /mo · $1,086/yr
- Insurance
- −$120
- Flood insurance flood zone
- −$66 /mo · $798/yr
- HOA
- −$0
- Vacancy / Maint / Mgmt
- −$598
- Net cashflow
- $456
Break-even live
UW: 25.0% down · 7.5% · 30yr · 1.5% tax · 5.0% vac · 8.0% maint · 8.0% mgmt
Financing live
Cash to close
- Down payment
- $72,250
- Closing costs
- $8,670
- Reserves months
- —
- Total cash needed
- —
Loan-product check · same deal, 3 products live
Conventional
25% down · 7.5% · 30yr
- Down + closing
- —
- Monthly P&I
- —
- Monthly cashflow
- —
- DSCR
- —
- Eligible?
- —
Personal DTI + credit; lowest rate.
DSCR
20% down · 8.5% · 30yr
- Down + closing
- —
- Monthly P&I
- —
- Monthly cashflow
- —
- DSCR
- —
- Eligible?
- —
No personal income docs; deal must DSCR.
Hard money
10% down · 12.0% · 12mo
- Down + closing
- —
- Monthly P&I
- —
- Monthly cashflow
- —
- DSCR
- —
- Eligible?
- —
Short-term bridge; refi at stabilization.
Rent comps 13 comps
| Address | Beds | Baths | Sqft | Rent | $/sqft | DOM | Units | Dist |
|---|---|---|---|---|---|---|---|---|
| 1701 8th St Harvey, LA | 3.0 | 2.0 | 1912 | $2,200 | $1.15 | 43d | 1 | 0.96mi |
| 1124 Orchid Dr Harvey, LA | 4.0 | 2.0 | 2118 | $2,328 | $1.10 | 23d | 1 | 0.97mi |
| 617 7th St New Orleans, LA | 3.0 | 2.0 | 1768 | $3,400 | $1.92 | 3d | 1 | 1.07mi |
| 912 Louisiana Ave New Orleans, LA | 2.0 | 3.5 | 2175 | $4,250 | $1.95 | 43d | 1 | 1.08mi |
| 4023 Tchoupitoulas St New Orleans, LA | 3.0 | 2.0 | 1608 | $3,200 | $1.99 | 43d | 1 | 1.08mi |
| 929 Eighth St New Orleans, LA | 3.0 | 1.5 | 1600 | $2,250 | $1.41 | 23d | 1 | 1.21mi |
| 1118 Foucher St New Orleans, LA | 3.0 | 2.5 | 1620 | $2,490 | $1.54 | 17d | 1 | 1.22mi |
| 515 3rd St New Orleans, LA | 3.0 | 3.0 | 1687 | $2,650 | $1.57 | 44d | 1 | 1.23mi |
| 530 2nd St New Orleans, LA | 3.0 | 2.5 | 2050 | $5,250 | $2.56 | 43d | 1 | 1.26mi |
| 2517 Saint Thomas St New Orleans, LA | 3.0 | 3.0 | 2010 | $4,000 | $1.99 | 3d | 1 | 1.27mi |
| 529 Jena St New Orleans, LA | 3.0 | 2.0 | 1665 | $3,250 | $1.95 | 43d | 1 | 1.31mi |
| 4029 Chestnut St Marrero, LA | 3.0 | 2.0 | 1600 | $2,100 | $1.31 | 4d | 1 | 1.36mi |
| 2608 Magazine St New Orleans, LA | 3.0 | 2.0 | 1844 | $3,100 | $1.68 | 43d | 1 | 1.45mi |
Listing history 12 events
-
2026-06-18days on market $289,000 Active 17 DOM
-
2026-06-17days on market $289,000 Active 16 DOM
-
2026-06-16days on market $289,000 Active 15 DOM
-
2026-06-15days on market $289,000 Active 14 DOM
-
2026-06-13days on market $289,000 Active 12 DOM
-
2026-06-10days on market $289,000 Active 9 DOM
-
2026-06-09days on market $289,000 Active 8 DOM
-
2026-06-08days on market $289,000 Active 7 DOM
-
2026-06-07days on market $289,000 Active 6 DOM
-
2026-06-03days on market $289,000 Active 2 DOM
-
2026-06-02remarks 699-char remark
-
2026-06-02$289,000 Active 1 DOM
ⓘ Source: listings_history table (triggers on properties + properties_extension) + one-shot
backfill from property_details.listing_events for pre-trigger history.
Tax reassessment forecast LA · Resets to sale price
- Current annual tax
- $1,086 · $91/mo
- Projected year-2 tax
- $1,590 · $132/mo
- Expected delta
- +$503/yr (+$42/mo · 46.4%)
ⓘ Screening estimate from a state-policy table — verify with the county assessor before closing.
Climate risk First Street
- Flood 8/10 Severe FEMA zone X · 60% chance over 30 yrs
- Wildfire 1/10 Low
- Heat 10/10 Extreme 7 d/yr ≥108°F today · 21 d/yr by 30 yrs out
- Wind 10/10 Extreme 99% chance of damaging wind over 30 yrs
- Air quality 3/10 Moderate 3 unhealthy d/yr today · 4 by 30 yrs out
Nearby sold comps map
Loading sold comps map…
Walkable amenities ~0.75 mi
Loading nearby amenities…
Taxation est. · year 1
- Rental income
- $34,166
- − Mortgage interest
- −$16,188
- − Property taxes
- −$1,086
- − Insurance
- −$2,242
- − Repairs & maintenance
- −$2,733
- − Management
- −$2,733
- − Depreciation
- −$8,407
- Taxable income
- $775
- Est. tax owed @ 24.0%
- −$186
- After-tax cash flow
- $5,290/yr
For passive investors: Depreciation is non-cash, so a rental often shows a tax loss while cash-flowing — sheltering income. Rental losses are passive: they offset passive income freely, and up to $25,000/yr can offset ordinary (W-2) income if you actively participate and your MAGI is under $100k (phasing out to $0 by $150k); unused losses carry forward. On sale, claimed depreciation is recaptured at up to 25%, and gains may owe capital-gains tax (a 1031 exchange can defer both). Figures are a year-1 estimate at your 24.0% rate — not tax advice; consult a CPA.
Schools (NCES district)
- District
- Jefferson Parish
- NCES district ID
- 2200840
- Math proficiency
- 24% ▼ -36.00%
- Reading proficiency
- 34% ▼ -30.00%
- Median HH income
- $48,421
- Composite
- 25.19/100
- National rank
- #7511
- State rank
- #44 of 98 in LA
Livability — Harvey
- Score
- 64/100
- State rank
- #166
- US rank
- #13980
Category grades
Schools grade is shown separately in the Schools card above.
Census & demographics
- Census place
- Harvey, LA
- County
- Jefferson Parish · 426,999 people
- City population
- 39,578
- Metro
- New Orleans-Metairie, LA
- Population (ZIP)
- 39,578
- Household income
- $62,416
- Rent vs Own
- Severe rent burden
- 1992.0
Population outlook (Jefferson County) Hauer SSP2
- Today (2025)
- 451,696 people
- By 2030
- 455,451 · +0.8%
- By 2040
- 458,308 · +1.5%
- By 2050
- 461,031 · +2.1%
- By 2075
- 476,351 · +5.5%
- By 2100
- 499,377 · +10.6%
Race, ethnicity, and origin ACS 2023
- Neighborhood character
- Diverse neighborhood (Simpson 0.60)
- Race & ethnicity
- Black 58% White 20% Hispanic / Latino 13% Asian 7% Two or more races 4%
- Hispanic origin (detail)
- Mexican 1% Dominican 1%
- Common ancestry
- Lithuanian 4% Hispanic 1%
- Foreign-born
- 13% · Canada, Vietnam
- Languages at home
- 81% English-only · Spanish 10% Vietnamese 5% French/Haitian/Cajun 2%
Political lean MEDSL · Jefferson
- 2024 margin
- R (+12.9) · D 42.5% · R 55.5% · Other 2.1%
- 2008→2024 swing
- +13.6pp toward D · 2008: -26.6pp · 2024: -12.9pp
- All cycles
- 2024: R+12.9 2020: R+11.1 2016: R+14.8 2012: R+18.4 2008: R+26.6
Not yet ingested
- Civics
- —
Market trends
- HPI YoY
- ▼ -96.82%
- Current HPI
- 156.1052
- Rent YoY
- ▼ -3.88%
- Metro
- New Orleans-Metairie, LA
- State GDP YoY
- ▲ 3.29%
- F500 in state
- 10
Industry mix (Fortune 500 HQ in LA)
| Industry | F500 HQs | Revenue |
|---|---|---|
| Telecommunications | 2 | $23B |
|
||
| Utilities | 1 | $12B |
|
||
| Wholesale / Distribution | 1 | $5B |
|
||
| Advertising | 1 | $2B |
|
||
Price history
-0.3% since first listed5 events — show timeline
- 2026-06-01 Price Changed $289,000 AcadianaMLS
- 2026-06-01 Price Changed $289,000 GSREIN
- 2026-06-01 Listed $289,900 GSREIN
- 2026-06-01 Listed $289,900 AcadianaMLS
- 1997-11-01 Sold (Public Records) — Public Records
Property tax history
+1.1%/yrLatest (2025): $1,086 · +0.3% YoY. Source: county tax records.
Cash-flow waterfall
monthlySold comps — $/sqft
last 12 mo · ≤1 miLoading sold comps…