14253 Star Cactus Ave · Horizon City, TX
Flood risk No data
- FEMA flood zone
- —
- Chance of flooding over 30 yrs
- —
- Est. flood insurance / yr
- —
Fire risk No data
- Est. fire insurance / yr
- —
Heat risk No data
- Hot days now (above threshold)
- —
- Hot days in 30 yrs
- —
Wind risk No data
- Chance of severe wind over 30 yrs
- —
Air-quality risk No data
- Unhealthy air days now
- —
- Unhealthy air days in 30 yrs
- —
Risk factors via First Street. Map © Google.
Why this score? — see what drove the D- grade
The composite is a weighted blend of 9 inputs, each scored 0–100. Each bar is that input's sub-score; the figure is the points it added to the 100-point composite (weight × sub-score).
- Cash flow +12.4/30.0
- ARV discount +7.5/15.0
- Condition / age +4.0/5.0
- DSCR +3.7/10.0
- 1% rule +3.5/10.0
- Livability +3.3/5.0
- Rent growth +3.2/5.0
- Schools +1.5/10.0
- Appreciation +0.0/10.0
$238,200
🖨 Deal sheet 📄 Offer letter ✓ Due diligence
Listing remarks
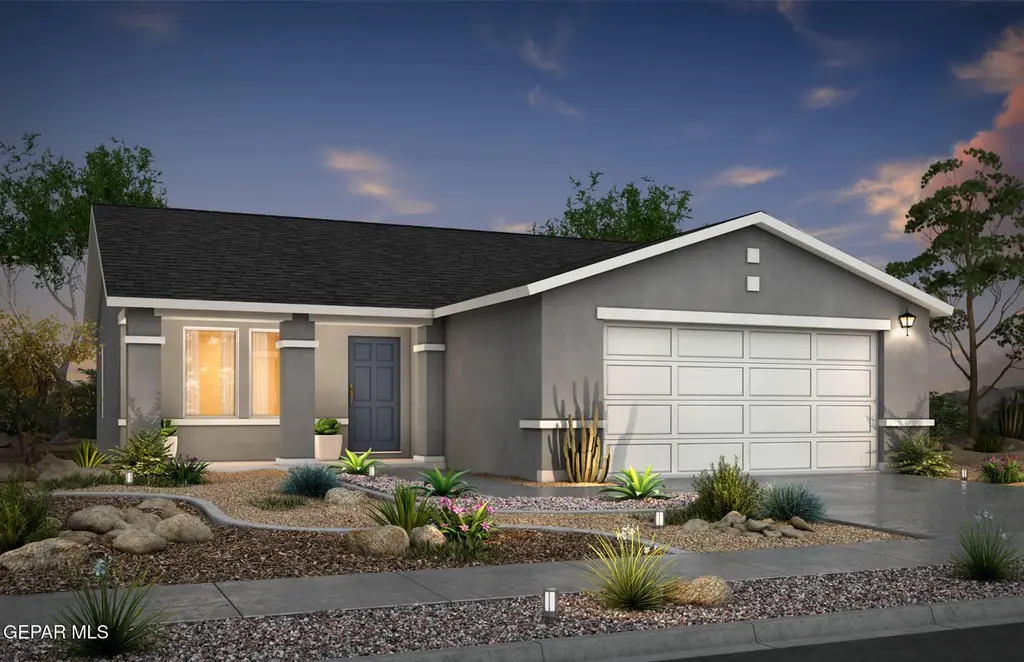
Introducing the Harrison floorplan -- a thoughtfully designed 1,368 sq. ft. home that perfectly combines efficiency and style. This charming residence features 4 bedrooms and 2 baths, offering a cozy yet functional layout that meets all your needs. The Harrison boasts a well-designed open floorplan with a spacious great room, an inviting kitchen, and a comfortable dining area. Its smart design maximizes every inch of space, providing a warm and welcoming environment for both relaxation and entertaining. Prices, plans, and terms are effective on the date of publication and subject to change without notice. Depictions of homes or other features are artist conceptions. Hardscape, landscape, an
Key facts
- 6,727 sq ft lot
- 2 garage spots
- Built 2026
Property features AI
Finance
- Other: Lot size about 0.15 acres
- Financial info: Property tax information not provided
- HOA & community: HOA information not specified
Exterior
- Parking: Parking details not specified
- Security: Security details not specified
- Utilities: Utility details not specified
- Home design: Single family residence
- Construction: Stucco exterior; Shingle roof; Building area approximately 1,386
- Exterior features: Walled backyard; New construction
Interior
- Kitchen: Dishwasher; Disposal; Microwave
- Bedrooms: Bedroom count not specified
- Flooring: Tile; Carpet
- Bathrooms: 2 full bathrooms
- Heating & cooling: Central heating; Refrigerated cooling
- Interior features: Ceiling fans; Double pane windows
- Laundry & utility: Laundry details not specified
Neighborhood map
What this means for you Summary
Snapshot
- This is a 4-bed/2.0-bath single-family listed at $238k. Condition is rated good.
Deal economics
- At list price, monthly cash flow is $-38 ($-456/yr) — negative.
- To cash-flow at today's rent, offer at most $233k (2.3% below list).
- To meet the 1% rule (rent ≥ 1% of price), the offer needs to be $204k (14.5% below list).
- Recommended offer: $204k (14.5% below list) — sets the bar for 1% rule.
Location & tenants
- Location reads 66/100 on livability (#619 in TX) — a middle-class / working-renter tenant base. Strengths: crime A+, cost of living A+, housing A+; Watch: employment D, amenities F, commute F.
- Clint ISD (suburban): math 14% / reading 22% proficiency, ranked #792 of 826 in TX (top 96%) — low school quality limits family demand, transient renter base, plan for 1-2y turnover.
- Zoned schools: Ricardo Estrada Middle (math 15% / reading 16%, grade F, #1,556 of 1,662 statewide, top 94%, 518 students, 91% FRL); Horizon H S (math 14% / reading 26%, grade F, #1,397 of 1,632 statewide, top 87%, 1,677 students, 85% FRL) — zoned schools average 88% FRL vs 59% district-wide (29 pts higher); higher-poverty schools than district average — tighter screening recommended.
- Market conditions: Rents rising (+2.9%/yr); 2088 active listings in the ZIP; 6 comparable units currently listed for rent nearby; rentals leasing fast (median 10d on market — plan ~1-2 weeks tenant-placement turnaround); solid renter incomes; 2,196 units permitted in El Paso County in 2024 (143 in 5+ unit buildings).
- This rent runs 32% of the median local income ($77k/yr) — at the standard rent-burdened threshold; future hikes will face affordability resistance.
Forward outlook
- Local home prices are declining (-3.0%/yr); year-one equity from $2k of loan paydown is wiped out by about $7k of value loss. Plan a longer hold.
- El Paso County population projected at +10% by 2050 — modest demand growth; plan on rents tracking national, not racing it.
Negotiation context
- It's been on market 29 days — a 2% lower offer ($235k) is reasonable based on typical stale-listing flexibility.
Questions for the listing agent
- What do current leases actually rent for vs. the listed asking? Can we see a recent rent roll and the last 12 months of T-12 income?
- Is there a deadline driving the sale (1031 exchange, divorce, estate, relocation)? That informs how much negotiation room exists.
- Schools are D-rated, which usually means shorter tenancies and higher turnover. Who's the typical renter profile here, and what's been the actual vacancy rate?
- The area grade is low — what's the realistic commute time and amenity access for the typical tenant pool here? Any planned neighborhood developments (good or bad) we should know about?
- What's the average days-on-market for RENTAL listings here right now (not sales)? A rising rental-DOM trend means longer vacancies and softer asking-rent achievability than the comps imply.
- What's the recent tenant-quality profile in this submarket — average credit score on applications, eviction rate, late-payment / NSF rate, and stable-employment percentage? A property-management company in the area should have these aggregated.
- How much new for-sale + rental construction is in the pipeline within 1–3 miles? Heavy new supply typically softens prices + rents 12–24 months out; constrained supply supports both.
Investment metrics
- 1% rule
- 0.85% ✗
- Cap rate
- 6.10%
- Cash-on-cash
- -0.68%
- DSCR
- 0.97
- GRM
- 9.8
CMA / ARV
No comps found within radius.
Projected returns pro-forma
-3.0% appreciation · 2.93% rent growth · sell at horizon
- IRR
- -17.5%
- Equity multiple
- 0.38×
- Total profit
- $-41,130
- Equity at exit
- $35,516
- IRR
- -9.6%
- Equity multiple
- 0.41×
- Total profit
- $-39,393
- Equity at exit
- $20,595
Cash invested: $66,696 (down + closing). Projections, not guarantees.
Landlord ↔ Tenant lean methodology
- Overall (STATE)
- 87 Strongly Landlord-Friendly
- State Texas
- 87 Strongly Landlord-Friendly · R+5
- County
- — inherits STATE
- City
- — inherits STATE
ZIP-level market 79928
- Home prices YoY
- -16.9%
- Rents YoY
- 2.9%
- Active inventory
- 2088
- Price-to-rent
- 9.8×
Monthly cashflow live
- Estimated rent
- $2,036 high interval (Pro) →
- Mortgage (P&I)
- −$1,249
- Tax est. 1.5%
- −$298 /mo · $3,573/yr
- Insurance
- −$99
- HOA
- −$0
- Vacancy / Maint / Mgmt
- −$427
- Net cashflow
- $-38
Break-even live
UW: 25.0% down · 7.5% · 30yr · 1.5% tax · 5.0% vac · 8.0% maint · 8.0% mgmt
Financing live
Cash to close
- Down payment
- $59,550
- Closing costs
- $7,146
- Reserves months
- —
- Total cash needed
- —
Loan-product check · same deal, 3 products live
Conventional
25% down · 7.5% · 30yr
- Down + closing
- —
- Monthly P&I
- —
- Monthly cashflow
- —
- DSCR
- —
- Eligible?
- —
Personal DTI + credit; lowest rate.
DSCR
20% down · 8.5% · 30yr
- Down + closing
- —
- Monthly P&I
- —
- Monthly cashflow
- —
- DSCR
- —
- Eligible?
- —
No personal income docs; deal must DSCR.
Hard money
10% down · 12.0% · 12mo
- Down + closing
- —
- Monthly P&I
- —
- Monthly cashflow
- —
- DSCR
- —
- Eligible?
- —
Short-term bridge; refi at stabilization.
Rent comps 6 comps
| Address | Beds | Baths | Sqft | Rent | $/sqft | DOM | Units | Dist |
|---|---|---|---|---|---|---|---|---|
| 14361 Star Cactus Ave Horizon City, TX | 3.0 | 2.0 | 1170 | $1,600 | $1.37 | 10d | 1 | 0.01mi |
| 14333 Paraiso Dr El Paso, TX | 3.0 | 2.0 | 1224 | $2,000 | $1.63 | 2d | 1 | 0.13mi |
| 14269 Escalera Dr El Paso, TX | 3.0 | 2.0 | 1269 | $1,850 | $1.46 | 2d | 1 | 0.40mi |
| 14608 Adonis Blue Ct El Paso, TX | 3.0 | 2.5 | 1350 | $1,650 | $1.22 | 10d | 1 | 0.51mi |
| 14624 Achim Dr El Paso, TX | 3.0 | 2.0 | 1422 | $1,500 | $1.05 | 10d | 1 | 1.15mi |
| 656 Orchid Dr Horizon City, TX | 3.0 | 2.0 | 1092 | $1,350 | $1.24 | 23d | 1 | 1.25mi |
Listing history 14 events
-
2026-06-18days on market $238,200 Active 29 DOM
-
2026-06-17days on market $238,200 Active 28 DOM
-
2026-06-16days on market $238,200 Active 27 DOM
-
2026-06-15days on market $238,200 Active 26 DOM
-
2026-06-13days on market $238,200 Active 24 DOM
-
2026-06-10days on market $238,200 Active 21 DOM
-
2026-06-09days on market $238,200 Active 20 DOM
-
2026-06-08days on market $238,200 Active 19 DOM
-
2026-06-07days on market $238,200 Active 18 DOM
-
2026-06-03days on market $238,200 Active 14 DOM
-
2026-06-03days on market $238,200 Active 13 DOM
-
2026-06-01days on market $238,200 Active 12 DOM
-
2026-05-31days on market $238,200 Active 11 DOM
-
2026-05-20$238,200 Active
ⓘ Source: listings_history table (triggers on properties + properties_extension) + one-shot
backfill from property_details.listing_events for pre-trigger history.
Nearby sold comps map
Loading sold comps map…
Walkable amenities ~0.75 mi
Loading nearby amenities…
Taxation est. · year 1
- Rental income
- $24,428
- − Mortgage interest
- −$13,343
- − Property taxes
- −$3,573
- − Insurance
- −$1,191
- − Repairs & maintenance
- −$1,954
- − Management
- −$1,954
- − Depreciation
- −$6,929
- Taxable loss
- −$4,517
- Est. tax savings @ 24.0%
- +$1,084
- After-tax cash flow
- $628/yr
For passive investors: Depreciation is non-cash, so a rental often shows a tax loss while cash-flowing — sheltering income. Rental losses are passive: they offset passive income freely, and up to $25,000/yr can offset ordinary (W-2) income if you actively participate and your MAGI is under $100k (phasing out to $0 by $150k); unused losses carry forward. On sale, claimed depreciation is recaptured at up to 25%, and gains may owe capital-gains tax (a 1031 exchange can defer both). Figures are a year-1 estimate at your 24.0% rate — not tax advice; consult a CPA.
Condition & rehab AI · 8 photos
This home is in good condition with a good condition score of 80. It has a cosmetic rehab level and requires minor repairs and maintenance in the kitchen and bathrooms. The highest-ROI updates that would raise its resale or rental value are updating the kitchen countertops and appliances, updating the bathroom fixtures and paint, and landscaping improvements.
Repairs flagged
- Minor Kitchen countertops — The countertops may need updating to improve the overall appearance.
- Minor Bathroom fixtures — The fixtures may need updating to improve the overall appearance.
- Minor Kitchen appliances — The appliances may need updating to improve the overall appearance.
- Minor Bathroom paint — The paint may need touch-ups to improve the overall appearance.
Value-add opportunities
- Resale Updating the kitchen countertops and appliances — Updating the kitchen will improve the overall appearance and functionality.
- Resale Updating the bathroom fixtures and paint — Updating the bathrooms will improve the overall appearance and functionality.
- Both Landscaping improvements — Landscaping improvements will enhance the curb appeal and attract potential buyers/tenants.
- Resale Paint touch-ups in the kitchen and bathrooms — Paint touch-ups will improve the overall appearance and functionality of the kitchen and bathrooms.
Renovation cost estimate screening
| Repair item | Severity | Est. cost |
|---|---|---|
| Kitchen countertops · The countertops may need updating to improve the overall appearance. | Minor | $500–3,000 |
| Bathroom fixtures · The fixtures may need updating to improve the overall appearance. | Minor | $500–3,000 |
| Kitchen appliances · The appliances may need updating to improve the overall appearance. | Minor | $500–3,000 |
| Bathroom paint · The paint may need touch-ups to improve the overall appearance. | Minor | $500–3,000 |
| Total estimated repair cost · 4 items | $2,000–12,000 |
Value-add ROI direction
- Resale Updating the kitchen countertops and appliances — Updating the kitchen will improve the overall appearance and functionality. ↑
- Resale Updating the bathroom fixtures and paint — Updating the bathrooms will improve the overall appearance and functionality. ↑
- Both Landscaping improvements — Landscaping improvements will enhance the curb appeal and attract potential buyers/tenants. ↑
- Resale Paint touch-ups in the kitchen and bathrooms — Paint touch-ups will improve the overall appearance and functionality of the kitchen and bathrooms. ↑
ⓘ Cost ranges are severity-bucket heuristics (US national rule-of-thumb). Get contractor quotes + a written scope before underwriting a rehab budget.
Schools (NCES district)
- District
- Clint ISD
- NCES district ID
- 4814430
- Math proficiency
- 14% ▼ -32.00%
- Reading proficiency
- 22% ▼ -15.00%
- Median HH income
- $37,490
- Composite
- 15.03/100
- National rank
- #9356
- State rank
- #792 of 826 in TX
Livability — Horizon City
- Score
- 66/100
- State rank
- #619
- US rank
- #11815
Category grades
Schools grade is shown separately in the Schools card above.
Census & demographics
- Census place
- Horizon City, TX
- County
- El Paso County · 761,266 people
- City population
- 86,599
- Metro
- El Paso, TX
- Population (ZIP)
- 86,599
- Household income
- $76,643
- Rent vs Own
- Severe rent burden
- 838.0
Population outlook (El Paso County) Hauer SSP2
- Today (2025)
- 897,899 people
- By 2030
- 922,694 · +2.8%
- By 2040
- 960,492 · +7.0%
- By 2050
- 982,919 · +9.5%
- By 2075
- 997,266 · +11.1%
- By 2100
- 900,630 · +0.3%
Race, ethnicity, and origin ACS 2023
- Neighborhood character
- Predominantly Hispanic (89%)
- Race & ethnicity
- Hispanic / Latino 89% Two or more races 39% White 7% Black 2% Native American 2%
- Hispanic origin (detail)
- Mexican 84%
- Foreign-born
- 23% · Canada
- Languages at home
- 25% English-only · Spanish 74% Other Asian/Pacific 1%
Political lean MEDSL · El Paso
- 2024 margin
- D (+15.1) · D 57.0% · R 41.8% · Other 1.2%
- 2008→2024 swing
- -17.4pp toward R · 2008: 32.5pp · 2024: 15.1pp
- All cycles
- 2024: D+15.1 2020: D+35.1 2016: D+43.2 2012: D+32.6 2008: D+32.5
Not yet ingested
- Civics
- —
Market trends
- HPI YoY
- ▼ -40.72%
- Current HPI
- 200.6454
- Rent YoY
- ▲ 2.93%
- Metro
- El Paso, TX
- State GDP YoY
- ▲ 3.95%
- F500 in state
- 110
Industry mix (Fortune 500 HQ in TX)
| Industry | F500 HQs | Revenue |
|---|---|---|
| Energy | 16 | $1,198B |
|
||
| Technology | 5 | $198B |
|
||
| Engineering / Construction | 4 | $72B |
|
||
| Energy Services | 3 | $60B |
|
||
| Utilities | 3 | $41B |
|
||
| Healthcare | 2 | $330B |
|
||
Price history
1 event — show timeline
- 2026-05-20 Listed $238,200 GEPARMLS
Cash-flow waterfall
monthlySold comps — $/sqft
last 12 mo · ≤1 miLoading sold comps…