901 E Sioux Rd · Pharr, TX
Flood risk 8/10 · Major
- FEMA flood zone
- X (shaded)
- Chance of flooding over 30 yrs
- 0.99%
- Est. flood insurance / yr
- $507 – $1,088
Fire risk 1/10 · Minimal
- Est. fire insurance / yr
- $1,222 – $2,270
Heat risk 9/10 · Severe
- Hot days now (above 111°F)
- 7 days/yr
- Hot days in 30 yrs
- 23 days/yr
Wind risk 8/10 · Major
- Chance of severe wind over 30 yrs
- 99.0%
Air-quality risk 3/10 · Minor
- Unhealthy air days now
- 1 days/yr
- Unhealthy air days in 30 yrs
- 4 days/yr
Risk factors via First Street. Map © Google.
Why this score? — see what drove the C grade
The composite is a weighted blend of 9 inputs, each scored 0–100. Each bar is that input's sub-score; the figure is the points it added to the 100-point composite (weight × sub-score).
- Cash flow +28.6/30.0
- DSCR +10.0/10.0
- 1% rule +7.9/10.0
- Livability +3.6/5.0
- Condition / age +2.5/5.0
- Rent growth +2.4/5.0
- Schools +2.0/10.0
- ARV discount +0.0/15.0
- Appreciation +0.0/10.0
$100,000
🖨 Deal sheet (PDF) 📄 Offer letter ✓ Due diligence
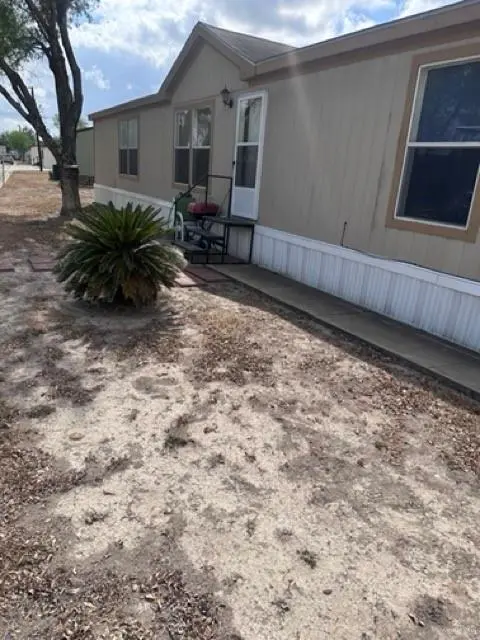
Listing remarks
Beautifully maintained 4-bedroom, 2-bath mobile home built in 2015, offering modern comfort and spacious living. Located in the desirable Boulder Park community, this home features an open-concept layout, generous bedrooms, and plenty of natural light throughout. Perfect for families or anyone looking for a move-in ready home in a peaceful and well-situated location. Don’t miss this opportunity—schedule your showing today!
Key facts
- 6,479 sq ft lot
- Built 2015
- Listed 64 days
Property features AI
Finance
- Other: Property located on a 60 x 108 lot (approx. 0.1488 acres); Building area reported as 1,568 square feet
- HOA & community: No homeowners association
Exterior
- Parking: No garage or carport (no covered parking)
- Utilities: Public water; City sewer; Cable available; Electric service for heating/cooling and appliances
- Home design: Frame/wood construction; Pillar/post/pier foundation; Not new construction
- Construction: Frame/Wood exterior; Pillar/Post/Pier foundation; Composition shingle roof
- Exterior features: Composition shingle roof; Paved road access; Community pool; Curbs
Interior
- Kitchen: Electric cooktop; Dishwasher; Microwave
- Bedrooms: Living areas include two living spaces (may include bedroom/adjoining living configurations)
- Flooring: Carpet; Vinyl
- Bathrooms: 2 full bathrooms
- Heating & cooling: Central heat and air; Electric heat pump; Thermostat (energy efficient)
- Interior features: Granite countertops; Ceiling fans; Office/Study; Split bedrooms; Walk-in closets; Energy-efficient double pane windows; Drapes and mini blinds; Microwave; Washer included
- Laundry & utility: Laundry room with washer/dryer connections; Electric water heater (electric heat pump)
Neighborhood map
What this means for you Summary
Snapshot
- This is a 4-bed/2.0-bath manufactured listed at $100k.
Deal economics
- At list price, monthly cash flow is $265 ($3k/yr) — positive.
- The deal already cash-flows at list — no discount required.
- Meets the 1% rule at list price ($1k rent vs $100k).
- Recommended offer: $94k (6.0% below list) — sets the bar for market timing.
- Cap rate 10.3% vs local median 3.4% in Pharr — top-decile yield for the area; either an underpriced asset or a hidden risk that comps aren't pricing in. Stress-test before assuming the spread holds.
Location & tenants
- Location reads 72/100 on livability (#245 in TX) — a middle-class / working-renter tenant base. Strengths: cost of living A+, housing A+, health & safety A+; Watch: amenities F, commute F, employment F.
- Pharr-San Juan-Alamo ISD (suburban): math 18% / reading 30% proficiency, ranked #740 of 826 in TX (top 90%) — low school quality limits family demand, transient renter base, plan for 1-2y turnover; 72% free/reduced lunch — lower-income household profile, screen leases tightly.
- Zoned schools: Raul Longoria El (math 12% / reading 17%, grade F, #4,048 of 4,322 statewide, top 95%, 560 students, 94% FRL); Lyndon B Johnson Middle (math 15% / reading 19%, grade F, #1,520 of 1,662 statewide, top 92%, 1,003 students, 90% FRL); Psja North Early College H S (math 32% / reading 46%, grade F, #859 of 1,632 statewide, top 53%, 2,176 students, 88% FRL) — zoned schools average 90% FRL vs 72% district-wide (19 pts higher); higher-poverty schools than district average — tighter screening recommended.
- Market conditions: Rents soft (-0.2%/yr); 458 active listings in the ZIP; 13 comparable units currently listed for rent nearby; rentals lingering (median 46d on market — plan ~5-8 weeks vacancy on turnover, expect pricing pressure); 69% of comp listings sitting > 30 days — soft ceiling on asking rent; 7,378 units permitted in Hidalgo County in 2024 (641 in 5+ unit buildings).
Forward outlook
- Local home prices are declining (-3.0%/yr); year-one equity from $691 of loan paydown is wiped out by about $3k of value loss. Plan a longer hold.
- Hidalgo County population projected at +28% by 2050 — long-run rental-demand tailwind backs the buy-and-hold thesis.
Negotiation context
- It's been on market 64 days — a 6% lower offer ($94k) is reasonable based on typical stale-listing flexibility.
Risks & watch-outs
- Watch-outs: flood insurance adds $66/mo.
- Climate carrying-cost: severe flood risk; severe wind risk, 99% chance of damaging wind over 30y; extreme-heat days projected 7→23/yr by 2055 (HVAC capex compounding) — expect insurance premiums to compound above CPI over the hold.
Questions for the listing agent
- It's been on market 64 days. Have you received any prior offers? Is the seller open to a 6% concession, seller financing, or rate buy-down credit?
- What's the actual annual flood-insurance premium (NFIP or private), and is the property in a SFHA with mandatory coverage?
- Why hasn't it sold? Are there any deal-killer items the seller is aware of (foundation, flood, title, zoning, code violations)?
- Is there a deadline driving the sale (1031 exchange, divorce, estate, relocation)? That informs how much negotiation room exists.
- Schools are D-rated, which usually means shorter tenancies and higher turnover. Who's the typical renter profile here, and what's been the actual vacancy rate?
- What's the average days-on-market for RENTAL listings here right now (not sales)? A rising rental-DOM trend means longer vacancies and softer asking-rent achievability than the comps imply.
- What's the recent tenant-quality profile in this submarket — average credit score on applications, eviction rate, late-payment / NSF rate, and stable-employment percentage? A property-management company in the area should have these aggregated.
- How much new for-sale + rental construction is in the pipeline within 1–3 miles? Heavy new supply typically softens prices + rents 12–24 months out; constrained supply supports both.
Investment metrics
- 1% rule
- 1.29% ✓
- Cap rate
- 10.26%
- Cash-on-cash
- 14.19%
- DSCR
- 1.63
- GRM
- 6.4
CMA / ARV
- ARV (median comp)
- $85,000
- List price
- $100,000
- Delta
- 17.65%
- Verdict
- OVERPRICED
- Comps
- 3 within 2.0 mi
Projected returns pro-forma
-3.0% appreciation · 0.0% rent growth · sell at horizon
- IRR
- -3.0%
- Equity multiple
- 0.89×
- Total profit
- $-3,088
- Equity at exit
- $14,910
- IRR
- 2.7%
- Equity multiple
- 1.16×
- Total profit
- $4,598
- Equity at exit
- $8,646
Cash invested: $28,000 (down + closing). Projections, not guarantees.
Landlord ↔ Tenant lean methodology
- Overall (STATE)
- 87 Strongly Landlord-Friendly
- State Texas
- 87 Strongly Landlord-Friendly · R+5
- County
- — inherits STATE
- City
- — inherits STATE
ZIP-level market 78577
- Home prices YoY
- -8.1%
- Rents YoY
- -0.2%
- Active inventory
- 458
- Price-to-rent
- 6.4×
Monthly cashflow live
- Estimated rent
- $1,294 high interval (Pro) →
- Mortgage (P&I)
- −$524
- Tax est. 1.5%
- −$125 /mo · $1,500/yr
- Insurance
- −$42
- Flood insurance flood zone
- −$66 /mo · $798/yr
- HOA
- −$0
- Vacancy / Maint / Mgmt
- −$272
- Net cashflow
- $265
Break-even live
Sensitivity live
| Price | -10% $334 | -5% $299 | +0% $265 | +5% $230 | +10% $195 |
|---|---|---|---|---|---|
| Rent | -10% $162 | -5% $213 | +0% $265 | +5% $316 | +10% $367 |
| Rate | -1.0pp $315 | -0.5pp $290 | base $265 | +0.5pp $239 | +1.0pp $212 |
UW: 25.0% down · 7.5% · 30yr · 1.5% tax · 5.0% vac · 8.0% maint · 8.0% mgmt
Financing live
Cash to close
- Down payment
- $25,000
- Closing costs
- $3,000
- Reserves months
- —
- Total cash needed
- —
Loan-product check · same deal, 3 products live
Conventional
25% down · 7.5% · 30yr
- Down + closing
- —
- Monthly P&I
- —
- Monthly cashflow
- —
- DSCR
- —
- Eligible?
- —
Personal DTI + credit; lowest rate.
DSCR
20% down · 8.5% · 30yr
- Down + closing
- —
- Monthly P&I
- —
- Monthly cashflow
- —
- DSCR
- —
- Eligible?
- —
No personal income docs; deal must DSCR.
Hard money
10% down · 12.0% · 12mo
- Down + closing
- —
- Monthly P&I
- —
- Monthly cashflow
- —
- DSCR
- —
- Eligible?
- —
Short-term bridge; refi at stabilization.
Rent comps 13 comps
| Address | Beds | Baths | Sqft | Rent | $/sqft | DOM | Units | Dist |
|---|---|---|---|---|---|---|---|---|
| 2700 N Birch St Unit B Pharr, TX | 3.0 | 1.5 | 895 | $900 | $1.01 | 25d | 1 | 0.52mi |
| 3841 N Mezcal Dr Unit Upstairs Pharr, TX | 3.0 | 2.0 | 1050 | $1,150 | $1.10 | 16d | 1 | 0.58mi |
| 3814 N Mezcal Dr Unit Downstairs Pharr, TX | 3.0 | 2.0 | 1050 | $1,250 | $1.19 | 46d | 1 | 0.59mi |
| 4106 Linda Vista St Pharr, TX | 3.0 | 2.0 | 1072 | $1,400 | $1.31 | 46d | 1 | 0.78mi |
| 4724 N Ebony St Apt 4 Pharr, TX | 3.0 | 2.0 | 1040 | $1,100 | $1.06 | 46d | 1 | 1.15mi |
| 203 Encino Dr San Juan, TX | 3.0 | 2.0 | 969 | $1,500 | $1.55 | 25d | 1 | 1.31mi |
| 3800 N Robin Ave Unit 4 Pharr, TX | 3.0 | 2.0 | 1050 | $1,250 | $1.19 | 46d | 1 | 1.33mi |
| 801 Sugar Garden Dr Unit 3 Pharr, TX | 3.0 | 2.0 | 1040 | $1,250 | $1.20 | 16d | 1 | 1.33mi |
| 802 Sugar Garden Ave Pharr, TX | 3.0 | 2.0 | 1106 | $1,195 | $1.08 | 46d | 1 | 1.36mi |
| 900 Sugar Garden Ave Pharr, TX | 3.0 | 2.0 | 1106 | $1,195 | $1.08 | 46d | 1 | 1.37mi |
| 901 Sugar Garden Dr Unit 4 Pharr, TX | 3.0 | 2.0 | 1100 | $1,200 | $1.09 | 46d | 1 | 1.37mi |
| 902 Sugar Garden Dr Unit 4 Pharr, TX | 3.0 | 2.0 | 1106 | $1,195 | $1.08 | 46d | 1 | 1.39mi |
| 906 Sugar Garden Ave Pharr, TX | 3.0 | 2.0 | 1106 | $1,195 | $1.08 | 46d | 1 | 1.41mi |
Listing history 17 events
-
2026-06-22days on market $100,000 Active 64 DOM
-
2026-06-18days on market $100,000 Active 61 DOM
-
2026-06-17days on market $100,000 Active 60 DOM
-
2026-06-16pricedays on market $100,000 Active 59 DOM
-
2026-06-15days on market $110,000 Active 58 DOM
-
2026-06-14days on market $110,000 Active 56 DOM
-
2026-06-13days on market $110,000 Active 55 DOM
-
2026-06-10days on market $110,000 Active 53 DOM
-
2026-06-09days on market $110,000 Active 52 DOM
-
2026-06-08days on market $110,000 Active 51 DOM
-
2026-06-07days on market $110,000 Active 50 DOM
-
2026-06-03days on market $110,000 Active 46 DOM
-
2026-06-02days on market $110,000 Active 45 DOM
-
2026-06-01days on market $110,000 Active 44 DOM
-
2026-05-31days on market $110,000 Active 43 DOM
-
2026-05-31days on market $110,000 Active 42 DOM
-
2026-04-18$115,000 Active 438-char remark
ⓘ Source: listings_history table (triggers on properties + properties_extension) + one-shot
backfill from property_details.listing_events for pre-trigger history.
Climate risk First Street
- Flood 8/10 Severe FEMA zone X (shaded) · 99% chance over 30 yrs
- Wildfire 1/10 Low
- Heat 9/10 Extreme 7 d/yr ≥111°F today · 23 d/yr by 30 yrs out
- Wind 8/10 Severe 99% chance of damaging wind over 30 yrs
- Air quality 3/10 Moderate 1 unhealthy d/yr today · 4 by 30 yrs out
Nearby sold comps map
Loading sold comps map…
Walkable amenities ~0.75 mi
Loading nearby amenities…
Taxation est. · year 1
- Rental income
- $15,525
- − Mortgage interest
- −$5,602
- − Property taxes
- −$1,500
- − Insurance
- −$1,298
- − Repairs & maintenance
- −$1,242
- − Management
- −$1,242
- − Depreciation
- −$2,909
- Taxable income
- $1,733
- Est. tax owed @ 24.0%
- −$416
- After-tax cash flow
- $2,758/yr
For passive investors: Depreciation is non-cash, so a rental often shows a tax loss while cash-flowing — sheltering income. Rental losses are passive: they offset passive income freely, and up to $25,000/yr can offset ordinary (W-2) income if you actively participate and your MAGI is under $100k (phasing out to $0 by $150k); unused losses carry forward. On sale, claimed depreciation is recaptured at up to 25%, and gains may owe capital-gains tax (a 1031 exchange can defer both). Figures are a year-1 estimate at your 24.0% rate — not tax advice; consult a CPA.
Schools (NCES district)
- District
- Pharr-San Juan-Alamo ISD
- NCES district ID
- 4834860
- Math proficiency
- 18% ▼ -34.00%
- Reading proficiency
- 30% ▼ -11.00%
- Median HH income
- $33,757
- Composite
- 19.63/100
- National rank
- #8744
- State rank
- #740 of 826 in TX
Livability — Pharr
- Score
- 72/100
- State rank
- #245
- US rank
- #5852
Category grades
Schools grade is shown separately in the Schools card above.
Census & demographics
- Census place
- Pharr, TX
- County
- Hidalgo County · 623,128 people
- City population
- 80,540
- Metro
- McAllen-Edinburg-Mission, TX
- Population (ZIP)
- 80,540
- Household income
- $52,770
- Rent vs Own
- Severe rent burden
- 2161.0
Population outlook (Hidalgo County) Hauer SSP2
- Today (2025)
- 955,232 people
- By 2030
- 1,009,774 · +5.7%
- By 2040
- 1,120,332 · +17.3%
- By 2050
- 1,225,036 · +28.2%
- By 2075
- 1,439,189 · +50.7%
- By 2100
- 1,533,429 · +60.5%
Race, ethnicity, and origin ACS 2023
- Neighborhood character
- Predominantly Hispanic (95%)
- Race & ethnicity
- Hispanic / Latino 95% Two or more races 45% White 5%
- Hispanic origin (detail)
- Mexican 92%
- Foreign-born
- 29% · Canada
- Languages at home
- 18% English-only · Spanish 81%
Political lean MEDSL · Hidalgo
- 2024 margin
- Toss-up / Even · D 48.1% · R 51.0%
- 2008→2024 swing
- -41.6pp toward R · 2008: 38.7pp · 2024: -2.9pp
- All cycles
- 2024: R+2.9 2020: D+17.1 2016: D+40.5 2012: D+41.8 2008: D+38.7
Not yet ingested
- Civics
- —
Market trends
- HPI YoY
- ▼ -23.00%
- Current HPI
- 261.1606
- Rent YoY
- ▼ -0.24%
- Metro
- McAllen-Edinburg-Mission, TX
- State GDP YoY
- ▲ 3.95%
- F500 in state
- 110
Industry mix (Fortune 500 HQ in TX)
| Industry | F500 HQs | Revenue |
|---|---|---|
| Energy | 16 | $1,198B |
|
||
| Technology | 5 | $198B |
|
||
| Engineering / Construction | 4 | $72B |
|
||
| Energy Services | 3 | $60B |
|
||
| Utilities | 3 | $41B |
|
||
| Healthcare | 2 | $330B |
|
||
Price history
-13.0% since first listed3 events — show timeline
- 2026-06-16 Price Changed $100,000 MCALLENMLS
- 2026-05-19 Price Changed $110,000 MCALLENMLS
- 2026-04-18 Listed $115,000 MCALLENMLS
Cash-flow waterfall
monthlySold comps — $/sqft
last 12 mo · ≤1 miLoading sold comps…