204 Bogle Street St · Dalton, GA
Flood risk 1/10 · Minimal
- FEMA flood zone
- X (unshaded)
- Chance of flooding over 30 yrs
- 0.0%
- Est. flood insurance / yr
- $507 – $1,088
Fire risk 1/10 · Minimal
- Est. fire insurance / yr
- $963 – $1,789
Heat risk 6/10 · Moderate
- Hot days now (above 106°F)
- 7 days/yr
- Hot days in 30 yrs
- 19 days/yr
Wind risk 4/10 · Minor
- Chance of severe wind over 30 yrs
- 10.0%
Air-quality risk 3/10 · Minor
- Unhealthy air days now
- 2 days/yr
- Unhealthy air days in 30 yrs
- 2 days/yr
Risk factors via First Street. Map © Google.
Why this score? — see what drove the B+ grade
The composite is a weighted blend of 9 inputs, each scored 0–100. Each bar is that input's sub-score; the figure is the points it added to the 100-point composite (weight × sub-score).
- Cash flow +30.0/30.0
- ARV discount +15.0/15.0
- 1% rule +10.0/10.0
- DSCR +10.0/10.0
- Livability +3.4/5.0
- Schools +2.6/10.0
- Rent growth +2.5/5.0
- Condition / age +2.5/5.0
- Appreciation +0.0/10.0
$100,000
🖨 Deal sheet 📄 Offer letter ✓ Due diligence
Listing remarks MLS
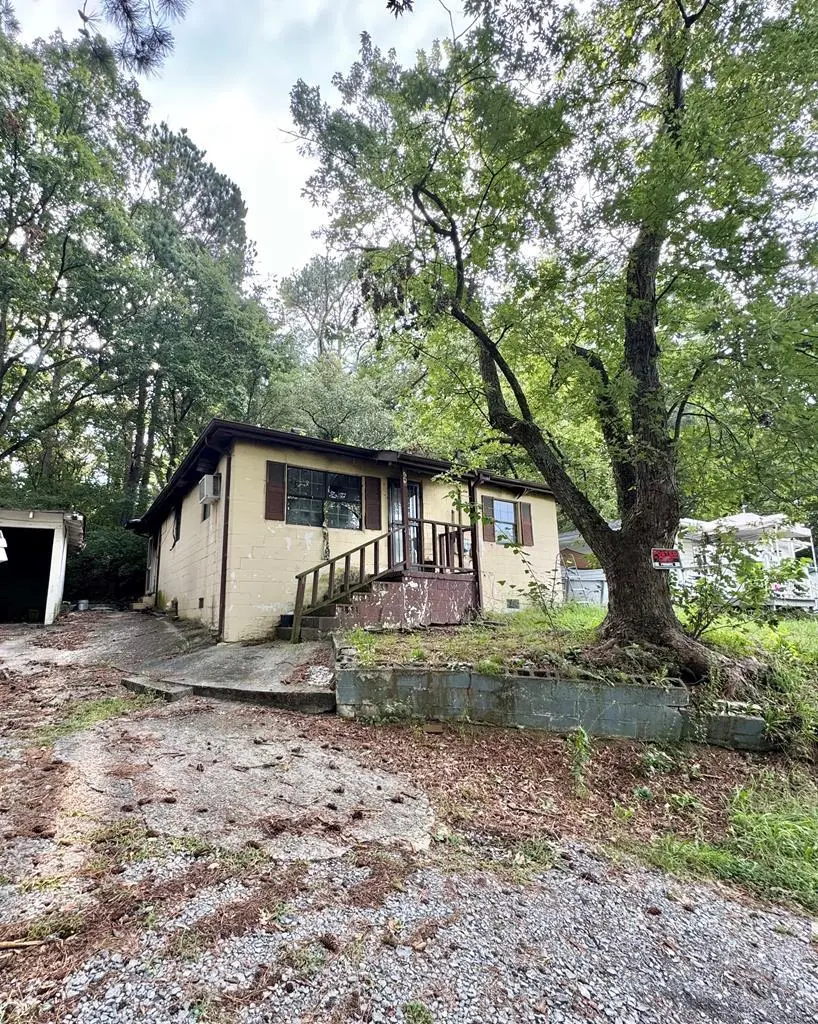
Investor special! 3 structures 1 price. The single-family house needs major repairs. The carport needs some repair. The third building has a bathroom, a kitchen, and the bedrooms area was used as a barbershop previously. Call today to schedule your showing!
Key facts
- 6,534 sq ft lot
- 2 garage spots
- Built 1958
Neighborhood map
What this means for you Summary
Snapshot
- This is a 3-bed/1.5-bath single-family listed at $100k.
Deal economics
- At list price, monthly cash flow is $604 ($7k/yr) — positive.
- The deal already cash-flows at list — no discount required.
- Meets the 1% rule at list price ($2k rent vs $100k).
- Recommended offer: $88k (12.0% below list) — sets the bar for market timing.
- Cap rate 13.5% vs local median 3.4% in Dalton — top-decile yield for the area; either an underpriced asset or a hidden risk that comps aren't pricing in. Stress-test before assuming the spread holds.
Location & tenants
- Location reads 67/100 on livability (#172 in GA) — a middle-class / working-renter tenant base. Strengths: cost of living A+, housing A+; Watch: employment D, schools F, amenities F.
- Dalton Public Schools (urban): math 29% / reading 33% proficiency, ranked #93 of 174 in GA (top 53%) — families likely to look elsewhere, expect single-tenant / working-renter base with shorter leases; 67% free/reduced lunch — lower-income household profile, screen leases tightly.
- Market conditions: 384 active listings in the ZIP; 2 comparable units currently listed for rent nearby; 374 units permitted in Whitfield County in 2024 (35 in 5+ unit buildings).
- This rent runs 31% of the median local income ($62k/yr) — at the standard rent-burdened threshold; future hikes will face affordability resistance.
Forward outlook
- Local home prices are declining (-3.0%/yr); year-one equity from $691 of loan paydown is wiped out by about $3k of value loss. Plan a longer hold.
- Whitfield County population projected at +3% by 2050 — modest demand growth; plan on rents tracking national, not racing it.
- At projected returns (-3.0% appreciation + 3.0% rent growth), your $28k cash investment doubles in ~5 years — after that, you're playing with house money.
Negotiation context
- It's been on market 301 days — a 12% lower offer ($88k) is reasonable based on typical stale-listing flexibility.
- 2 sale attempts with the ask held roughly flat each time — persistent listings suggest the price (not the market) is what's stuck; bring a comps-based counter.
Risks & watch-outs
- Watch-outs: built in 1958 — expect roof / HVAC / electrical / plumbing capex.
- Climate carrying-cost: extreme-heat days projected 7→19/yr by 2055 (HVAC capex compounding) — expect insurance premiums to compound above CPI over the hold.
Questions for the listing agent
- It's been on market 301 days. Have you received any prior offers? Is the seller open to a 12% concession, seller financing, or rate buy-down credit?
- Built in 1958 — when were the roof, HVAC, electrical panel, plumbing, and water heater last replaced?
- Why hasn't it sold? Are there any deal-killer items the seller is aware of (foundation, flood, title, zoning, code violations)?
- Is there a deadline driving the sale (1031 exchange, divorce, estate, relocation)? That informs how much negotiation room exists.
- Schools are F-rated, which usually means shorter tenancies and higher turnover. Who's the typical renter profile here, and what's been the actual vacancy rate?
- What's the average days-on-market for RENTAL listings here right now (not sales)? A rising rental-DOM trend means longer vacancies and softer asking-rent achievability than the comps imply.
- What's the recent tenant-quality profile in this submarket — average credit score on applications, eviction rate, late-payment / NSF rate, and stable-employment percentage? A property-management company in the area should have these aggregated.
- How much new for-sale + rental construction is in the pipeline within 1–3 miles? Heavy new supply typically softens prices + rents 12–24 months out; constrained supply supports both.
Investment metrics
- 1% rule
- 1.61% ✓
- Cap rate
- 13.54%
- Cash-on-cash
- 25.90%
- DSCR
- 2.15
- GRM
- 5.2
CMA / ARV
- ARV (median comp)
- $171,164
- List price
- $100,000
- Delta
- -41.58%
- Verdict
- UNDERPRICED
- Comps
- 20 within 1.0 mi
Show comp detail 12 sales within ~0.75 mi
| Address | Dist | Beds/Ba | Sqft | Sold | Price | $/sf | Match |
|---|---|---|---|---|---|---|---|
| 1133 Orman Street St | 0.46mi | 3/2.0 | 1,000 (-1%) | 3mo | $230,000 | $230 | 73 |
| 503 Harris Street St | 0.41mi | 3/2.0 | 979 (-3%) | 5mo | $225,000 | $230 | 70 |
| 502 Woodland Drive Dr | 0.41mi | 3/2.0 | 1,060 (+5%) | 6mo | $240,000 | $226 | 66 |
| 502 E Woodland Dr | 0.43mi | 3/2.0 | 1,060 (+5%) | 6mo | $240,000 | $226 | 65 |
| 500 Woodland Drive Dr | 0.39mi | 3/2.0 | 1,060 (+5%) | 9mo | $250,000 | $236 | 64 |
| 500 E Woodland Dr | 0.43mi | 3/2.0 | 1,060 (+5%) | 9mo | $250,000 | $236 | 62 |
| 1117 Orman St | 0.42mi | 2/1.0 (-1) | 1,000 (-1%) | 14mo | $179,900 | $180 | 61 |
| 1106 Foster Street St | 0.23mi | 2/2.0 (-1) | 886 (-12%) | 16mo | $203,000 | $229 | 49 |
| 1103 James St | 0.45mi | 2/1.0 (-1) | 950 (-6%) | 20mo | $195,000 | $205 | 46 |
| 0 Martin Luther King Blvd | 0.71mi | 2/2.0 (-1) | 1,000 (-1%) | 18mo | $219,000 | $219 | 44 |
| 209 Henderson St | 0.40mi | 3/2.0 | 866 (-14%) | 15mo | $185,000 | $214 | 44 |
| 625 Virginia Ave | 0.62mi | 3/2.0 | 1,120 (+11%) | 23mo | $225,000 | $201 | 31 |
Match score weights: distance 35% · size 25% · config 20% · recency 20%. Top-matched comps best support the ARV.
Projected returns pro-forma
-3.0% appreciation · 3.0% rent growth · sell at horizon
- IRR
- 19.6%
- Equity multiple
- 1.80×
- Total profit
- $22,291
- Equity at exit
- $14,910
- IRR
- 27.9%
- Equity multiple
- 3.46×
- Total profit
- $69,005
- Equity at exit
- $8,646
Cash invested: $28,000 (down + closing). Projections, not guarantees.
Landlord ↔ Tenant lean methodology
- Overall (STATE)
- 90 Strongly Landlord-Friendly
- State Georgia
- 90 Strongly Landlord-Friendly · R+3
- County
- — inherits STATE
- City
- — inherits STATE
ZIP-level market 30721
- Active inventory
- 384
- Price-to-rent
- 5.2×
Monthly cashflow live
- Estimated rent
- $1,609 medium interval (Pro) →
- Mortgage (P&I)
- −$524
- Tax from tax record
- −$101 /mo · $1,209/yr
- Insurance
- −$42
- HOA
- −$0
- Vacancy / Maint / Mgmt
- −$338
- Net cashflow
- $604
Break-even live
UW: 25.0% down · 7.5% · 30yr · 1.5% tax · 5.0% vac · 8.0% maint · 8.0% mgmt
Financing live
Cash to close
- Down payment
- $25,000
- Closing costs
- $3,000
- Reserves months
- —
- Total cash needed
- —
Loan-product check · same deal, 3 products live
Conventional
25% down · 7.5% · 30yr
- Down + closing
- —
- Monthly P&I
- —
- Monthly cashflow
- —
- DSCR
- —
- Eligible?
- —
Personal DTI + credit; lowest rate.
DSCR
20% down · 8.5% · 30yr
- Down + closing
- —
- Monthly P&I
- —
- Monthly cashflow
- —
- DSCR
- —
- Eligible?
- —
No personal income docs; deal must DSCR.
Hard money
10% down · 12.0% · 12mo
- Down + closing
- —
- Monthly P&I
- —
- Monthly cashflow
- —
- DSCR
- —
- Eligible?
- —
Short-term bridge; refi at stabilization.
Rent comps 2 comps
| Address | Beds | Baths | Sqft | Rent | $/sqft | DOM | Units | Dist |
|---|---|---|---|---|---|---|---|---|
| 1418 Burgess Dr Dalton, GA | 2.0 | 1.0 | 742 | $999 | $1.35 | 44d | 1 | 0.71mi |
| 501 W Waugh St Dalton, GA | 1.0–2.0 | 1.0–2.0 | 810 | $1,892 | $2.33 | 14d | 30 | 1.12mi |
Listing history 20 events
-
2026-06-19days on market $100,000 Active 301 DOM
-
2026-06-18days on market $100,000 Active 300 DOM
-
2026-06-17days on market $100,000 Active 299 DOM
-
2026-06-16days on market $100,000 Active 298 DOM
-
2026-06-15days on market $100,000 Active 297 DOM
-
2026-06-14days on market $100,000 Active 295 DOM
-
2026-06-13days on market $100,000 Active 294 DOM
-
2026-06-10days on market $100,000 Active 292 DOM
-
2026-06-09days on market $100,000 Active 291 DOM
-
2026-06-08days on market $100,000 Active 290 DOM
-
2026-06-07days on market $100,000 Active 289 DOM
-
2026-06-05days on market $100,000 Active 286 DOM
-
2026-06-03days on market $100,000 Active 285 DOM
-
2026-06-02days on market $100,000 Active 284 DOM
-
2026-06-01days on market $100,000 Active 283 DOM
-
2026-05-31days on market $100,000 Active 282 DOM
-
2026-05-30days on market $100,000 Active 281 DOM
-
2026-03-06historical
-
2025-08-26$100,000 Active
-
2025-08-22$100,000 Active 257-char remark
Show marketing remark (257 chars)
Investor special! 3 structures 1 price. The single-family house needs major repairs. The carport needs some repair. The third building has a bathroom, a kitchen, and the bedrooms area was used as a barbershop previously. Call today to schedule your showing!
ⓘ Source: listings_history table (triggers on properties + properties_extension) + one-shot
backfill from property_details.listing_events for pre-trigger history.
Tax reassessment forecast GA · Resets to sale price
- Current annual tax
- $1,209 · $101/mo
- Projected year-2 tax
- $1,209 · $101/mo
- Expected delta
- $0/yr ($0/mo · 0.0%)
ⓘ Screening estimate from a state-policy table — verify with the county assessor before closing.
Climate risk First Street
- Flood 1/10 Low FEMA zone X (unshaded) · 0% chance over 30 yrs
- Wildfire 1/10 Low
- Heat 6/10 Major 7 d/yr ≥106°F today · 19 d/yr by 30 yrs out
- Wind 4/10 Moderate 10% chance of damaging wind over 30 yrs
- Air quality 3/10 Moderate 2 unhealthy d/yr today · 2 by 30 yrs out
Nearby sold comps map
Loading sold comps map…
Walkable amenities ~0.75 mi
Loading nearby amenities…
Taxation est. · year 1
- Rental income
- $19,307
- − Mortgage interest
- −$5,602
- − Property taxes
- −$1,209
- − Insurance
- −$500
- − Repairs & maintenance
- −$1,545
- − Management
- −$1,545
- − Depreciation
- −$2,909
- Taxable income
- $5,999
- Est. tax owed @ 24.0%
- −$1,440
- After-tax cash flow
- $5,811/yr
For passive investors: Depreciation is non-cash, so a rental often shows a tax loss while cash-flowing — sheltering income. Rental losses are passive: they offset passive income freely, and up to $25,000/yr can offset ordinary (W-2) income if you actively participate and your MAGI is under $100k (phasing out to $0 by $150k); unused losses carry forward. On sale, claimed depreciation is recaptured at up to 25%, and gains may owe capital-gains tax (a 1031 exchange can defer both). Figures are a year-1 estimate at your 24.0% rate — not tax advice; consult a CPA.
Schools (NCES district)
- District
- Dalton Public Schools
- NCES district ID
- 1301620
- Math proficiency
- 29% ▼ -7.00%
- Reading proficiency
- 33% ▼ -4.00%
- Median HH income
- $37,444
- Composite
- 25.82/100
- National rank
- #7357
- State rank
- #93 of 174 in GA
Livability — Dalton
- Score
- 67/100
- State rank
- #172
- US rank
- #10778
Category grades
Schools grade is shown separately in the Schools card above.
Census & demographics
- Census place
- Dalton, GA
- County
- Whitfield County · 80,309 people
- City population
- 80,309
- Metro
- Dalton, GA
- Population (ZIP)
- 53,060
- Household income
- $62,094
- Rent vs Own
- Severe rent burden
- 1156.0
Population outlook (Whitfield County) Hauer SSP2
- Today (2025)
- 107,770 people
- By 2030
- 108,737 · +0.9%
- By 2040
- 110,260 · +2.3%
- By 2050
- 111,205 · +3.2%
- By 2075
- 113,014 · +4.9%
- By 2100
- 112,775 · +4.6%
Race, ethnicity, and origin ACS 2023
- Neighborhood character
- Diverse neighborhood (Simpson 0.55)
- Race & ethnicity
- White 48% Hispanic / Latino 47% Two or more races 10% Black 4% Native American 1%
- Hispanic origin (detail)
- Mexican 35% Cuban 1%
- Common ancestry
- Slovak 1% Italian 1%
- Foreign-born
- 24% · Canada, Jamaica
- Languages at home
- 62% English-only · Spanish 37%
Political lean MEDSL · Whitfield
- 2024 margin
- Solid R (+44.5) · D 27.5% · R 72.0%
- 2008→2024 swing
- -4.5pp toward R · 2008: -40.0pp · 2024: -44.5pp
- All cycles
- 2024: R+44.5 2020: R+40.7 2016: R+44.8 2012: R+45.1 2008: R+40.0
Not yet ingested
- Civics
- —
Market trends
- HPI YoY
- ▼ -220.10%
- Current HPI
- 314.9341
- Rent YoY
- —
- Metro
- Dalton, GA
- State GDP YoY
- ▲ 2.66%
- F500 in state
- 28
Industry mix (Fortune 500 HQ in GA)
| Industry | F500 HQs | Revenue |
|---|---|---|
| Paper / Packaging | 2 | $29B |
|
||
| Retail | 1 | $160B |
|
||
| Transportation / Logistics | 1 | $91B |
|
||
| Airlines | 1 | $62B |
|
||
| Consumer Goods | 1 | $47B |
|
||
| Utilities | 1 | $25B |
|
||
Price history
+0.0% since first listed3 events — show timeline
- 2026-03-06 Listing Removed — REALTRACS as Distributed by MLS Grid
- 2025-08-26 Listed $100,000 REALTRACS as Distributed by MLS Grid
- 2025-08-22 Listed $100,000 CCARMLS
Property tax history
+7.7%/yrLatest (2025): $1,209 · +27.7% YoY. Source: county tax records.
Cash-flow waterfall
monthlySold comps — $/sqft
last 12 mo · ≤1 miLoading sold comps…