508 Keasler St · Hughes Springs, TX
Flood risk 1/10 · Minimal
- FEMA flood zone
- A
- Chance of flooding over 30 yrs
- 0.0%
- Est. flood insurance / yr
- $1,009 – $1,996
Fire risk 6/10 · Moderate
- Est. fire insurance / yr
- $1,222 – $2,270
Heat risk 7/10 · Major
- Hot days now (above 111°F)
- 7 days/yr
- Hot days in 30 yrs
- 23 days/yr
Wind risk 6/10 · Moderate
- Chance of severe wind over 30 yrs
- 27.0%
Air-quality risk 2/10 · Minimal
- Unhealthy air days now
- 0 days/yr
- Unhealthy air days in 30 yrs
- 1 days/yr
Risk factors via First Street. Map © Google.
Why this score? — see what drove the B+ grade
The composite is a weighted blend of 9 inputs, each scored 0–100. Each bar is that input's sub-score; the figure is the points it added to the 100-point composite (weight × sub-score).
- Cash flow +30.0/30.0
- 1% rule +10.0/10.0
- DSCR +10.0/10.0
- Appreciation +7.8/10.0
- ARV discount +7.5/15.0
- Schools +3.7/10.0
- Livability +3.6/5.0
- Rent growth +2.5/5.0
- Condition / age +2.2/5.0
$55,900
🖨 Deal sheet (PDF) 📄 Offer letter ✓ Due diligence
Listing remarks
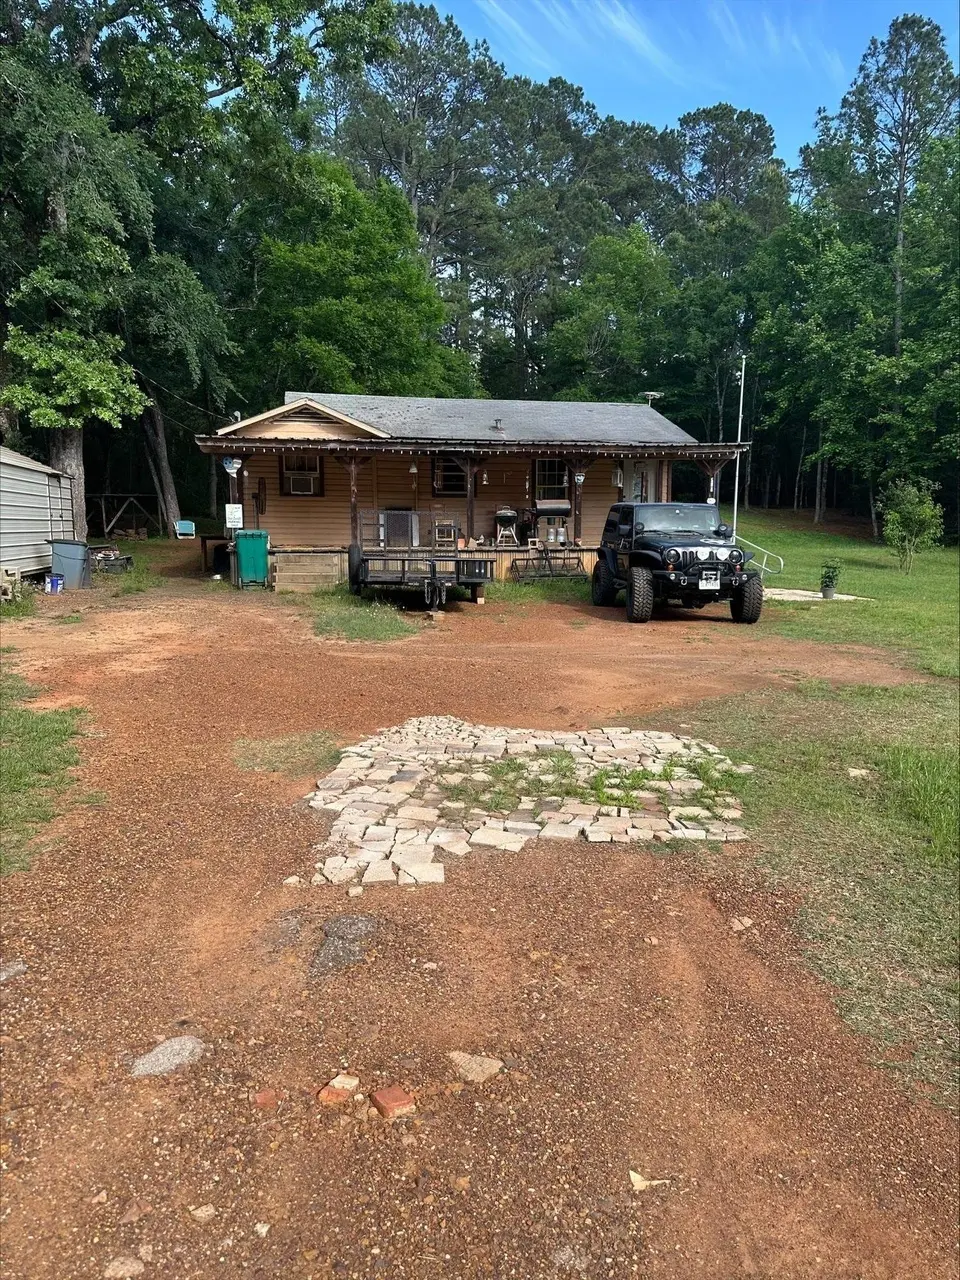
Quaint Country Cottage located in Hughes Springs Texas Small storage building conveys with property, seller is retaining larger storage building. City Water is on this property- located 2 blocks from downtown Hughes Springs Texas. Cute frame house with 2 bedrooms and 1 bath. Peaceful rustic style home located close to downtown. Walking distance from restaurants. Mature trees throughout the property. Charming Country Home in Hughes Springs Discover a delightful country home nestled in the inviting town of Hughes Springs, Texas. This cozy residence offers three comfortable bedrooms and a well-maintained bathroom, perfectly suited for a small family or anyone looking to enjoy peaceful living
Key facts
- City water
- Spacious lot
- 0.55 acre lot
Tags
Property features AI
Finance
- Financial info: Annual taxes listed (amount omitted per instructions)
Exterior
- Parking: Detached parking
- Utilities: Public water; Public sewer
- Home design: Single-family residence; Single-story
- Exterior features: Approximately 0.546-acre lot
Interior
- Bathrooms: 1 full bathroom
- Heating & cooling: Window unit(s) for cooling; No central heating
- Interior features: Electric water heater; 7 total rooms
Neighborhood map
What this means for you Summary
Snapshot
- This is a 2-bed/1.0-bath single-family listed at $56k. Condition is rated fair.
Deal economics
- At list price, monthly cash flow is $275 ($3k/yr) — positive.
- The deal already cash-flows at list — no discount required.
- Meets the 1% rule at list price ($995 rent vs $56k).
- Recommended offer: $55k (1.5% below list) — sets the bar for market timing.
Location & tenants
- Location reads 72/100 on livability (#257 in TX) — a middle-class / working-renter tenant base. Strengths: crime A+, cost of living A+, housing A+; Watch: employment D+, amenities F, commute F.
- Hughes Springs ISD (town): math 43% / reading 46% proficiency, ranked #296 of 826 in TX (top 36%) — families likely to look elsewhere, expect single-tenant / working-renter base with shorter leases.
- Zoned schools: Hughes Springs El (math 41% / reading 43%, grade F, #1,335 of 4,322 statewide, top 33%, 535 students, 67% FRL); Hughes Springs J H (math 37% / reading 42%, grade F, #660 of 1,662 statewide, top 41%, 276 students, 57% FRL); Hughes Springs H S (math 62% / reading 67%, grade B-, #199 of 1,632 statewide, top 14%, 338 students, 49% FRL) — zoned schools at 58% FRL track the district average.
- Market conditions: 59 active listings in the ZIP; 1 comparable units currently listed for rent nearby; 12 units permitted in Cass County in 2024 (0 in 5+ unit buildings).
Forward outlook
- In year one you build about $4k of equity ($386 loan paydown + $3k appreciation (5.7% local appreciation)).
- Cass County population projected to shrink 9% by 2050 — rents likely to lag national; underwrite the cash flow, not the appreciation.
- At projected returns (5.7% appreciation + 3.0% rent growth), your $16k cash investment doubles in ~3 years — after that, you're playing with house money.
- By year 9, paydown + projected appreciation supports a ~$32k cash-out refi (75% LTV) — recoverable capital for the next deal without selling this one.
Negotiation context
- It's been on market 27 days — a 2% lower offer ($55k) is reasonable based on typical stale-listing flexibility.
Risks & watch-outs
- Watch-outs: flood insurance adds $125/mo.
- Climate carrying-cost: in FEMA flood zone A (mandatory federal flood insurance); major wind risk, 27% chance of damaging wind over 30y; major wildfire risk; extreme-heat days projected 7→23/yr by 2055 (HVAC capex compounding) — expect insurance premiums to compound above CPI over the hold.
Questions for the listing agent
- Have any recent inspections been done? Can we get a copy of the seller's disclosures and any deferred-maintenance estimates?
- Built in 1960 — when were the roof, HVAC, electrical panel, plumbing, and water heater last replaced?
- What's the actual annual flood-insurance premium (NFIP or private), and is the property in a SFHA with mandatory coverage?
- Is there a deadline driving the sale (1031 exchange, divorce, estate, relocation)? That informs how much negotiation room exists.
- What's the average days-on-market for RENTAL listings here right now (not sales)? A rising rental-DOM trend means longer vacancies and softer asking-rent achievability than the comps imply.
- What's the recent tenant-quality profile in this submarket — average credit score on applications, eviction rate, late-payment / NSF rate, and stable-employment percentage? A property-management company in the area should have these aggregated.
- How much new for-sale + rental construction is in the pipeline within 1–3 miles? Heavy new supply typically softens prices + rents 12–24 months out; constrained supply supports both.
Investment metrics
- 1% rule
- 1.78% ✓
- Cap rate
- 14.87%
- Cash-on-cash
- 30.65%
- DSCR
- 2.36
- GRM
- 4.7
CMA / ARV
- ARV (on-the-fly)
- $117,700
- Comps found
- 1
Show comp detail 1 sale within ~0.75 mi
| Address | Dist | Beds/Ba | Sqft | Sold | Price | $/sf | Match |
|---|---|---|---|---|---|---|---|
| 405 Walnut St | 0.75mi | 2/1.0 | 1,172 (+6%) | 7mo | $125,000 | $107 | 48 |
Match score weights: distance 35% · size 25% · config 20% · recency 20%. Top-matched comps best support the ARV.
Projected returns pro-forma
5.66% appreciation · 3.0% rent growth · sell at horizon
- IRR
- 32.5%
- Equity multiple
- 3.08×
- Total profit
- $32,590
- Equity at exit
- $33,942
- IRR
- 30.5%
- Equity multiple
- 6.28×
- Total profit
- $82,674
- Equity at exit
- $60,544
Cash invested: $15,652 (down + closing). Projections, not guarantees.
Landlord ↔ Tenant lean methodology
- Overall (STATE)
- 87 Strongly Landlord-Friendly
- State Texas
- 87 Strongly Landlord-Friendly · R+5
- County
- — inherits STATE
- City
- — inherits STATE
ZIP-level market 75656
- Home prices YoY
- 3.7%
- Active inventory
- 59
- Price-to-rent
- 4.7×
Monthly cashflow live
- Estimated rent
- $995 medium interval (Pro) →
- Mortgage (P&I)
- −$293
- Tax est. 1.5%
- −$70 /mo · $838/yr
- Insurance
- −$23
- Flood insurance flood zone
- −$125 /mo · $1,502/yr
- HOA
- −$0
- Vacancy / Maint / Mgmt
- −$209
- Net cashflow
- $275
Break-even live
Sensitivity live
| Price | -10% $313 | -5% $294 | +0% $275 | +5% $255 | +10% $236 |
|---|---|---|---|---|---|
| Rent | -10% $196 | -5% $235 | +0% $275 | +5% $314 | +10% $353 |
| Rate | -1.0pp $303 | -0.5pp $289 | base $275 | +0.5pp $260 | +1.0pp $245 |
UW: 25.0% down · 7.5% · 30yr · 1.5% tax · 5.0% vac · 8.0% maint · 8.0% mgmt
Financing live
Cash to close
- Down payment
- $13,975
- Closing costs
- $1,677
- Reserves months
- —
- Total cash needed
- —
Loan-product check · same deal, 3 products live
Conventional
25% down · 7.5% · 30yr
- Down + closing
- —
- Monthly P&I
- —
- Monthly cashflow
- —
- DSCR
- —
- Eligible?
- —
Personal DTI + credit; lowest rate.
DSCR
20% down · 8.5% · 30yr
- Down + closing
- —
- Monthly P&I
- —
- Monthly cashflow
- —
- DSCR
- —
- Eligible?
- —
No personal income docs; deal must DSCR.
Hard money
10% down · 12.0% · 12mo
- Down + closing
- —
- Monthly P&I
- —
- Monthly cashflow
- —
- DSCR
- —
- Eligible?
- —
Short-term bridge; refi at stabilization.
Rent comps 1 comps
| Address | Beds | Baths | Sqft | Rent | $/sqft | DOM | Units | Dist |
|---|---|---|---|---|---|---|---|---|
| 319 Harrison Hughes Springs, TX | 2.0 | 1.0 | 1329 | $995 | $0.75 | 45d | 1 | 0.18mi |
Listing history 9 events
-
2026-06-10statusdays on market $55,900 Pending 27 DOM
-
2026-06-08days on market $55,900 Active 26 DOM
-
2026-06-08days on market $55,900 Active 25 DOM
-
2026-06-05days on market $55,900 Active 23 DOM
-
2026-06-03days on market $55,900 Active 21 DOM
-
2026-06-02days on market $55,900 Active 20 DOM
-
2026-06-01days on market $55,900 Active 19 DOM
-
2026-05-31days on market $55,900 Active 18 DOM
-
2026-05-13$55,900 Active
ⓘ Source: listings_history table (triggers on properties + properties_extension) + one-shot
backfill from property_details.listing_events for pre-trigger history.
Climate risk First Street
- Flood 1/10 Low FEMA zone A · 0% chance over 30 yrs
- Wildfire 6/10 Major
- Heat 7/10 Severe 7 d/yr ≥111°F today · 23 d/yr by 30 yrs out
- Wind 6/10 Major 27% chance of damaging wind over 30 yrs
- Air quality 2/10 Low 0 unhealthy d/yr today · 1 by 30 yrs out
Nearby sold comps map
Loading sold comps map…
Walkable amenities ~0.75 mi
Loading nearby amenities…
Taxation est. · year 1
- Rental income
- $11,940
- − Mortgage interest
- −$3,131
- − Property taxes
- −$838
- − Insurance
- −$1,782
- − Repairs & maintenance
- −$955
- − Management
- −$955
- − Depreciation
- −$1,626
- Taxable income
- $2,652
- Est. tax owed @ 24.0%
- −$636
- After-tax cash flow
- $2,658/yr
For passive investors: Depreciation is non-cash, so a rental often shows a tax loss while cash-flowing — sheltering income. Rental losses are passive: they offset passive income freely, and up to $25,000/yr can offset ordinary (W-2) income if you actively participate and your MAGI is under $100k (phasing out to $0 by $150k); unused losses carry forward. On sale, claimed depreciation is recaptured at up to 25%, and gains may owe capital-gains tax (a 1031 exchange can defer both). Figures are a year-1 estimate at your 24.0% rate — not tax advice; consult a CPA.
Condition & rehab AI · 17 photos
This quaint country cottage requires moderate renovations, including painting, new flooring, and updated appliances, to improve its resale and rental value.
Repairs flagged
- Major Kitchen appliances — Old and worn
- Major Flooring — Worn and uneven
- Major Paint — Needs fresh paint in kitchen and bathrooms
Value-add opportunities
- Both Painting — Fresh paint can improve both resale and rental value
- Both New flooring — New flooring can significantly improve both resale and rental value
- Both Kitchen appliances — Upgrading appliances can improve both resale and rental value
Renovation cost estimate screening
| Repair item | Severity | Est. cost |
|---|---|---|
| Kitchen appliances · Old and worn | Major | $15,000–50,000 |
| Flooring · Worn and uneven | Major | $15,000–50,000 |
| Paint · Needs fresh paint in kitchen and bathrooms | Major | $15,000–50,000 |
| Total estimated repair cost · 3 items | $45,000–150,000 |
Value-add ROI direction
- Both Painting — Fresh paint can improve both resale and rental value ↑
- Both New flooring — New flooring can significantly improve both resale and rental value ↑
- Both Kitchen appliances — Upgrading appliances can improve both resale and rental value ↑
ⓘ Cost ranges are severity-bucket heuristics (US national rule-of-thumb). Get contractor quotes + a written scope before underwriting a rehab budget.
Schools (NCES district)
- District
- Hughes Springs ISD
- NCES district ID
- 4823850
- Math proficiency
- 43% ▼ -5.00%
- Reading proficiency
- 46% ▼ -5.00%
- Median HH income
- $39,202
- Composite
- 37.19/100
- National rank
- #4474
- State rank
- #296 of 826 in TX
Livability — Hughes Springs
- Score
- 72/100
- State rank
- #257
- US rank
- #5944
Category grades
Schools grade is shown separately in the Schools card above.
Census & demographics
- Census place
- Hughes Springs, TX
- Population (ZIP)
- 4,657
Population outlook (Cass County) Hauer SSP2
- Today (2025)
- 29,998 people
- By 2030
- 29,583 · -1.4%
- By 2040
- 28,512 · -5.0%
- By 2050
- 27,230 · -9.2%
- By 2075
- 24,917 · -16.9%
- By 2100
- 21,582 · -28.1%
Race, ethnicity, and origin ACS 2023
- Neighborhood character
- Predominantly White (71%)
- Race & ethnicity
- White 71% Black 18% Two or more races 7% Hispanic / Latino 6% Native American 1%
- Hispanic origin (detail)
- Mexican 6%
- Common ancestry
- Slovak 1% Serbian 1%
- Foreign-born
- 2% · Canada
- Languages at home
- 97% English-only · Spanish 3%
Political lean MEDSL · Cass
- 2024 margin
- Solid R (+65.7) · D 17.0% · R 82.7%
- 2008→2024 swing
- -25.2pp toward R · 2008: -40.4pp · 2024: -65.7pp
- All cycles
- 2024: R+65.7 2020: R+59.1 2016: R+59.7 2012: R+49.5 2008: R+40.4
Not yet ingested
- Civics
- —
Market trends
- HPI YoY
- ▲ 5.66%
- Current HPI
- 158.9983
- Rent YoY
- —
- Metro
- —
- State GDP YoY
- ▲ 3.95%
- F500 in state
- 110
Industry mix (Fortune 500 HQ in TX)
| Industry | F500 HQs | Revenue |
|---|---|---|
| Energy | 16 | $1,198B |
|
||
| Technology | 5 | $198B |
|
||
| Engineering / Construction | 4 | $72B |
|
||
| Energy Services | 3 | $60B |
|
||
| Utilities | 3 | $41B |
|
||
| Healthcare | 2 | $330B |
|
||
Price history
1 event — show timeline
- 2026-05-13 Listed $55,900 LAAR
Cash-flow waterfall
monthlySold comps — $/sqft
last 12 mo · ≤1 miLoading sold comps…