201 Union Ave SE #193 · Renton, WA
Flood risk 1/10 · Minimal
- FEMA flood zone
- X (unshaded)
- Chance of flooding over 30 yrs
- 0.0%
- Est. flood insurance / yr
- $507 – $1,088
Fire risk 1/10 · Minimal
- Est. fire insurance / yr
- $604 – $1,122
Heat risk 3/10 · Minor
- Hot days now (above 86°F)
- 7 days/yr
- Hot days in 30 yrs
- 15 days/yr
Wind risk 1/10 · Minimal
- Chance of severe wind over 30 yrs
- —
Air-quality risk 7/10 · Major
- Unhealthy air days now
- 10 days/yr
- Unhealthy air days in 30 yrs
- 11 days/yr
Risk factors via First Street. Map © Google.
Why this score? — see what drove the B+ grade
The composite is a weighted blend of 9 inputs, each scored 0–100. Each bar is that input's sub-score; the figure is the points it added to the 100-point composite (weight × sub-score).
- Cash flow +30.0/30.0
- ARV discount +15.0/15.0
- 1% rule +10.0/10.0
- DSCR +10.0/10.0
- Schools +4.7/10.0
- Livability +4.2/5.0
- Rent growth +2.6/5.0
- Condition / age +2.2/5.0
- Appreciation +0.0/10.0
$94,950
🖨 Deal sheet 📄 Offer letter ✓ Due diligence
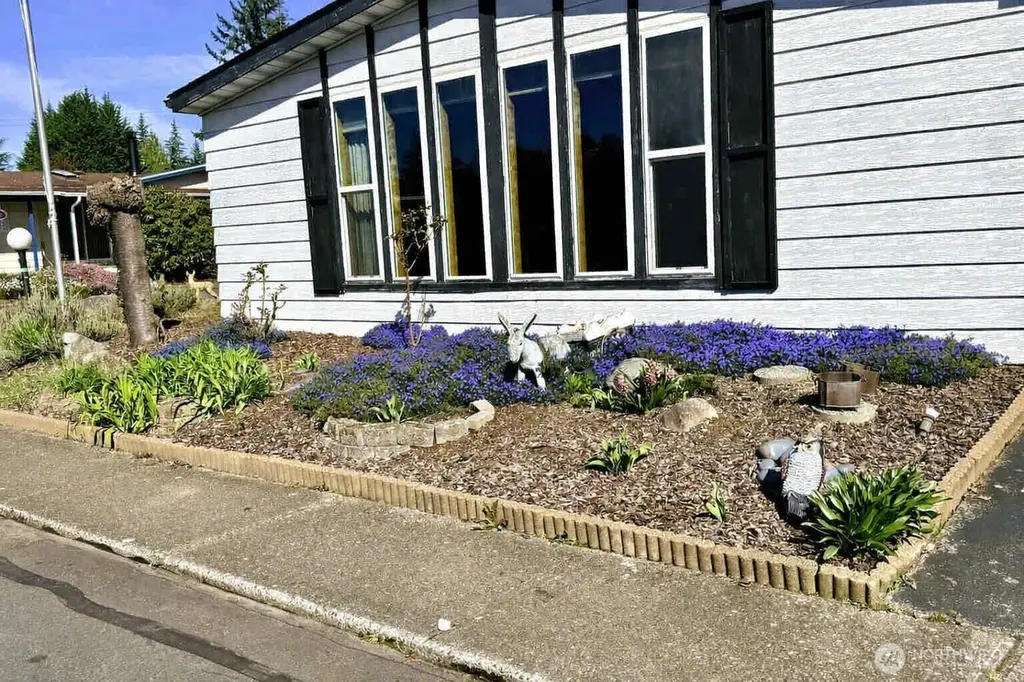
Listing remarks
This large home is waiting you to make it your own. Nearly 1800 sq ft, two very large bedrooms and bathrooms, walk in closet, spacious living room and rec room, with a very sizeable kitchen and dining room. So much space to spread out. It has vinyl windows, two-year-old roof, great insulation and multiple mini-split heat pumps to keep that perfect temperature all year round. There is a large, covered patio and raised garden beds for your outdoor enjoyment. There is a good-sized storage shed and a two-car carport for plenty of parking. Friendly gated 55+ community with a pool, hot tub, sauna, dog park, club house, pickleball court, work out room, golf, and RV storage.
Key facts
- Gated community
- Raised garden beds
- Covered patio
Tags
Neighborhood map
What this means for you Summary
Snapshot
- This is a 2-bed/2.0-bath manufactured listed at $95k. Condition is rated fair.
Deal economics
- At list price, monthly cash flow is $2k ($20k/yr) — positive.
- The deal already cash-flows at list — no discount required.
- Meets the 1% rule at list price ($3k rent vs $95k).
- Recommended offer: $84k (12.0% below list) — sets the bar for market timing.
- Cap rate 27.3% vs local median 2.3% in Renton — top-decile yield for the area; either an underpriced asset or a hidden risk that comps aren't pricing in. Stress-test before assuming the spread holds.
Location & tenants
- Location reads 83/100 on livability (#52 in WA, #949 nationally) — a professional / high-income tenant draw. Strengths: amenities A+, commute A+, employment A+; Watch: crime D-, cost of living F.
- Renton School District (urban): math 47% / reading 55% proficiency, ranked #119 of 291 in WA (top 41%) — acceptable for families but not a draw, mixed tenant base, ~2y average lease.
- Market conditions: Rents flat; 255 active listings in the ZIP; 4 comparable units currently listed for rent nearby; rentals at typical pace (median 24d on market — plan ~3-4 weeks tenant-placement turnaround); high-income renter base; 10,555 units permitted in King County in 2024 (7,119 in 5+ unit buildings).
Forward outlook
- Local home prices are declining (-3.0%/yr); year-one equity from $656 of loan paydown is wiped out by about $3k of value loss. Plan a longer hold.
- King County population projected at +44% by 2050 — long-run rental-demand tailwind backs the buy-and-hold thesis.
- At projected returns (-3.0% appreciation + 0.3% rent growth), your $27k cash investment doubles in ~2 years — after that, you're playing with house money.
Negotiation context
- It's been on market 147 days — a 12% lower offer ($84k) is reasonable based on typical stale-listing flexibility.
- 3 sale attempts since 20y ago; this cycle's ask has dropped $5k (5%) from the opening price — seller is motivated, your offer sets the floor, not the list.
- Current owner paid $68k; 39% above their basis — modest negotiation headroom, anchor on the comps not their cost.
Questions for the listing agent
- It's been on market 147 days. Have you received any prior offers? Is the seller open to a 12% concession, seller financing, or rate buy-down credit?
- Have any recent inspections been done? Can we get a copy of the seller's disclosures and any deferred-maintenance estimates?
- Why hasn't it sold? Are there any deal-killer items the seller is aware of (foundation, flood, title, zoning, code violations)?
- Is there a deadline driving the sale (1031 exchange, divorce, estate, relocation)? That informs how much negotiation room exists.
- Schools are B-rated — typically a magnet for longer-tenancy family renters. What's the average tenant stay here, and is there a school-zone premium baked into asking?
- Crime grade is D in this area — have there been break-ins, vandalism, or insurance claims at this property in the last 3 years? What carrier currently insures it and at what premium?
- What's the average days-on-market for RENTAL listings here right now (not sales)? A rising rental-DOM trend means longer vacancies and softer asking-rent achievability than the comps imply.
- What's the recent tenant-quality profile in this submarket — average credit score on applications, eviction rate, late-payment / NSF rate, and stable-employment percentage? A property-management company in the area should have these aggregated.
- How much new for-sale + rental construction is in the pipeline within 1–3 miles? Heavy new supply typically softens prices + rents 12–24 months out; constrained supply supports both.
Investment metrics
- 1% rule
- 3.09% ✓
- Cap rate
- 27.25%
- Cash-on-cash
- 74.86%
- DSCR
- 4.33
- GRM
- 2.7
CMA / ARV
- ARV (median comp)
- $157,783
- List price
- $94,950
- Delta
- -39.82%
- Verdict
- UNDERPRICED
- Comps
- 18 within 1.0 mi
Show comp detail 10 sales within ~0.75 mi
| Address | Dist | Beds/Ba | Sqft | Sold | Price | $/sf | Match |
|---|---|---|---|---|---|---|---|
| 201 Union Ave SE #183 | 0.00mi | 3/2.0 (+1) | 1,876 (+5%) | 3mo | $65,000 | $35 | 84 |
| 201 Union Ave SE #147 | 0.05mi | 2/2.0 | 1,536 (-14%) | 2mo | $100,000 | $65 | 72 |
| 201 Union Ave SE #185 | 0.04mi | 2/2.0 | 1,944 (+8%) | 18mo | $160,000 | $82 | 69 |
| 201 Union Ave SE #128 | 0.04mi | 2/2.0 | 1,536 (-14%) | 7mo | $75,000 | $49 | 68 |
| 201 Union Ave SE #251 | 0.04mi | 2/2.0 | 1,536 (-14%) | 10mo | $184,995 | $120 | 66 |
| 201 Union Ave SE #197 | 0.05mi | 3/2.0 (+1) | 2,040 (+14%) | 7mo | $125,000 | $61 | 64 |
| 201 Union Ave SE #58 | 0.05mi | 3/2.0 (+1) | 1,536 (-14%) | 9mo | $130,000 | $85 | 62 |
| 201 Union Ave SE #188 | 0.22mi | 2/2.0 | 1,536 (-14%) | 10mo | $179,000 | $117 | 58 |
| 375 Union Ave SE #86 | 0.10mi | 3/2.0 (+1) | 1,568 (-12%) | 14mo | $165,000 | $105 | 58 |
| 201 Union Ave SE #108 | 0.22mi | 2/1.5 | 2,040 (+14%) | 18mo | $140,000 | $69 | 49 |
Match score weights: distance 35% · size 25% · config 20% · recency 20%. Top-matched comps best support the ARV.
Projected returns pro-forma
-3.0% appreciation · 0.29% rent growth · sell at horizon
- IRR
- 71.6%
- Equity multiple
- 4.10×
- Total profit
- $82,505
- Equity at exit
- $14,157
- IRR
- 74.8%
- Equity multiple
- 7.69×
- Total profit
- $177,800
- Equity at exit
- $8,210
Cash invested: $26,586 (down + closing). Projections, not guarantees.
Landlord ↔ Tenant lean methodology
- Overall (STATE)
- 28 Tenant-Leaning
- State Washington
- 28 Tenant-Leaning · D+8
- County
- — inherits STATE
- City
- — inherits STATE
ZIP-level market 98059
- Rents YoY
- 0.3%
- Active inventory
- 255
- Price-to-rent
- 2.7×
Monthly cashflow live
- Estimated rent
- $2,930 medium interval (Pro) →
- Mortgage (P&I)
- −$498
- Tax est. 1.5%
- −$119 /mo · $1,424/yr
- Insurance
- −$40
- HOA
- −$0
- Vacancy / Maint / Mgmt
- −$615
- Net cashflow
- $1,658
Break-even live
UW: 25.0% down · 7.5% · 30yr · 1.5% tax · 5.0% vac · 8.0% maint · 8.0% mgmt
Financing live
Cash to close
- Down payment
- $23,738
- Closing costs
- $2,848
- Reserves months
- —
- Total cash needed
- —
Loan-product check · same deal, 3 products live
Conventional
25% down · 7.5% · 30yr
- Down + closing
- —
- Monthly P&I
- —
- Monthly cashflow
- —
- DSCR
- —
- Eligible?
- —
Personal DTI + credit; lowest rate.
DSCR
20% down · 8.5% · 30yr
- Down + closing
- —
- Monthly P&I
- —
- Monthly cashflow
- —
- DSCR
- —
- Eligible?
- —
No personal income docs; deal must DSCR.
Hard money
10% down · 12.0% · 12mo
- Down + closing
- —
- Monthly P&I
- —
- Monthly cashflow
- —
- DSCR
- —
- Eligible?
- —
Short-term bridge; refi at stabilization.
Rent comps 4 comps
| Address | Beds | Baths | Sqft | Rent | $/sqft | DOM | Units | Dist |
|---|---|---|---|---|---|---|---|---|
| 5027 NE 5th Pl Renton, WA | 3.0 | 2.5 | 1287 | $3,300 | $2.56 | 23d | 1 | 0.91mi |
| 5415 NE 4th St Renton, WA | 2.0 | 2.0 | 1810 | $2,650 | $1.46 | 43d | 1 | 0.96mi |
| 15205 140th Way SE Renton, WA | 1.0–3.0 | 1.0–2.0 | 1121 | $2,960 | $2.64 | 1d | 10 | 0.97mi |
| 2227 SE 8th Pl Renton, WA | 3.0 | 2.0 | 1560 | $3,650 | $2.34 | 3d | 1 | 1.31mi |
Listing history 26 events
-
2026-06-18days on market $94,950 Active 147 DOM
-
2026-06-17days on market $94,950 Active 146 DOM
-
2026-06-16days on market $94,950 Active 145 DOM
-
2026-06-15days on market $94,950 Active 144 DOM
-
2026-06-13days on market $94,950 Active 142 DOM
-
2026-06-13days on market $94,950 Active 141 DOM
-
2026-06-09days on market $94,950 Active 138 DOM
-
2026-06-08days on market $94,950 Active 137 DOM
-
2026-06-07days on market $94,950 Active 136 DOM
-
2026-06-04days on market $94,950 Active 133 DOM
-
2026-06-03days on market $94,950 Active 132 DOM
-
2026-06-02days on market $94,950 Active 131 DOM
-
2026-06-01days on market $94,950 Active 130 DOM
-
2026-05-31days on market $94,950 Active 129 DOM
-
2026-04-15price $94,950
-
2026-03-31price $97,900
-
2026-03-16price $99,900
-
2026-03-02price $97,000
-
2026-02-25price $99,000
-
2026-02-24status Active
-
2026-02-17status Pending
-
2026-02-12price $90,000
-
2026-02-02price $95,000
-
2026-01-15$100,000 Active
-
2006-09-21soldstatus $68,500
-
2006-07-17$79,990
ⓘ Source: listings_history table (triggers on properties + properties_extension) + one-shot
backfill from property_details.listing_events for pre-trigger history.
Climate risk First Street
- Flood 1/10 Low FEMA zone X (unshaded) · 0% chance over 30 yrs
- Wildfire 1/10 Low
- Heat 3/10 Moderate 7 d/yr ≥86°F today · 15 d/yr by 30 yrs out
- Wind 1/10 Low
- Air quality 7/10 Severe 10 unhealthy d/yr today · 11 by 30 yrs out
Nearby sold comps map
Loading sold comps map…
Walkable amenities ~0.75 mi
Loading nearby amenities…
Taxation est. · year 1
- Rental income
- $35,158
- − Mortgage interest
- −$5,319
- − Property taxes
- −$1,424
- − Insurance
- −$475
- − Repairs & maintenance
- −$2,813
- − Management
- −$2,813
- − Depreciation
- −$2,762
- Taxable income
- $19,553
- Est. tax owed @ 24.0%
- −$4,693
- After-tax cash flow
- $15,208/yr
For passive investors: Depreciation is non-cash, so a rental often shows a tax loss while cash-flowing — sheltering income. Rental losses are passive: they offset passive income freely, and up to $25,000/yr can offset ordinary (W-2) income if you actively participate and your MAGI is under $100k (phasing out to $0 by $150k); unused losses carry forward. On sale, claimed depreciation is recaptured at up to 25%, and gains may owe capital-gains tax (a 1031 exchange can defer both). Figures are a year-1 estimate at your 24.0% rate — not tax advice; consult a CPA.
Condition & rehab AI · 12 photos
This home requires moderate renovations to update its dated interior and exterior, but has a good roof and well-maintained landscaping.
Repairs flagged
- Moderate Kitchen cabinets — Dated and worn
- Moderate Bathroom tile — Dated and worn
- Moderate Carpeted floors — Worn and dated
Value-add opportunities
- Both Paint interior walls — Fresh paint enhances curb appeal and interior aesthetics
- Both Replace kitchen cabinets — Modern cabinets improve functionality and aesthetics
- Both Replace bathroom tile — Modern tile enhances functionality and aesthetics
- Both Replace carpeted floors — Hardwood or tile floors improve functionality and aesthetics
Renovation cost estimate screening
| Repair item | Severity | Est. cost |
|---|---|---|
| Kitchen cabinets · Dated and worn | Moderate | $3,000–15,000 |
| Bathroom tile · Dated and worn | Moderate | $3,000–15,000 |
| Carpeted floors · Worn and dated | Moderate | $3,000–15,000 |
| Total estimated repair cost · 3 items | $9,000–45,000 |
Value-add ROI direction
- Both Paint interior walls — Fresh paint enhances curb appeal and interior aesthetics ↑
- Both Replace kitchen cabinets — Modern cabinets improve functionality and aesthetics ↑
- Both Replace bathroom tile — Modern tile enhances functionality and aesthetics ↑
- Both Replace carpeted floors — Hardwood or tile floors improve functionality and aesthetics ↑
ⓘ Cost ranges are severity-bucket heuristics (US national rule-of-thumb). Get contractor quotes + a written scope before underwriting a rehab budget.
Schools (NCES district)
- District
- Renton School District
- NCES district ID
- 5307230
- Math proficiency
- 47% ▼ -1.00%
- Reading proficiency
- 55% ▼ -1.00%
- Median HH income
- $66,354
- Composite
- 47.13/100
- National rank
- #5108
- State rank
- #119 of 291 in WA
Livability — Renton
- Score
- 83/100
- State rank
- #52
- US rank
- #949
Category grades
Schools grade is shown separately in the Schools card above.
Census & demographics
- Census place
- Renton, WA
- County
- King County · 2,251,916 people
- City population
- 158,600
- Metro
- Seattle-Tacoma-Bellevue, WA
- Population (ZIP)
- 42,406
- Household income
- $138,654
- Rent vs Own
- Severe rent burden
- 908.0
Population outlook (King County) Hauer SSP2
- Today (2025)
- 2,576,485 people
- By 2030
- 2,803,316 · +8.8%
- By 2040
- 3,255,921 · +26.4%
- By 2050
- 3,706,444 · +43.9%
- By 2075
- 4,746,063 · +84.2%
- By 2100
- 5,407,730 · +109.9%
Race, ethnicity, and origin ACS 2023
- Neighborhood character
- Diverse neighborhood (Simpson 0.68)
- Race & ethnicity
- White 48% Asian 29% Two or more races 15% Hispanic / Latino 9% Black 2%
- Hispanic origin (detail)
- Mexican 5%
- Common ancestry
- Portuguese 3% Italian 3% Slovak 2%
- Foreign-born
- 23% · China, Vietnam, Canada
- Languages at home
- 67% English-only · Chinese 9% Vietnamese 6% Spanish 5%
Political lean MEDSL · King
- 2024 margin
- Solid D (+51.7) · D 74.2% · R 22.5% · Other 3.4%
- 2008→2024 swing
- +9.6pp toward D · 2008: 42.1pp · 2024: 51.7pp
- All cycles
- 2024: D+51.7 2020: D+52.7 2016: D+50.4 2012: D+39.9 2008: D+42.1
Not yet ingested
- Civics
- —
Market trends
- HPI YoY
- ▼ -920.66%
- Current HPI
- 338.4495
- Rent YoY
- ▲ 0.29%
- Metro
- Seattle-Tacoma-Bellevue, WA
- State GDP YoY
- ▲ 4.65%
- F500 in state
- 22
Industry mix (Fortune 500 HQ in WA)
| Industry | F500 HQs | Revenue |
|---|---|---|
| Retail | 2 | $269B |
|
||
| Technology / Retail | 1 | $638B |
|
||
| Technology | 1 | $245B |
|
||
| Telecommunications | 1 | $38B |
|
||
| Food / Beverage | 1 | $36B |
|
||
| Automotive / Trucks | 1 | $34B |
|
||
Price history
+18.7% since first listed12 events — show timeline
- 2026-04-15 Price Changed $94,950 NWMLS as Distributed by MLS Grid
- 2026-03-31 Price Changed $97,900 NWMLS as Distributed by MLS Grid
- 2026-03-16 Price Changed $99,900 NWMLS as Distributed by MLS Grid
- 2026-03-02 Price Changed $97,000 NWMLS as Distributed by MLS Grid
- 2026-02-25 Price Changed $99,000 NWMLS as Distributed by MLS Grid
- 2026-02-24 Relisted — NWMLS as Distributed by MLS Grid
- 2026-02-17 Pending — NWMLS as Distributed by MLS Grid
- 2026-02-12 Price Changed $90,000 NWMLS as Distributed by MLS Grid
- 2026-02-02 Price Changed $95,000 NWMLS as Distributed by MLS Grid
- 2026-01-15 Listed $100,000 NWMLS as Distributed by MLS Grid
- 2006-09-21 Sold (MLS) $68,500 NWMLS as Distributed by MLS Grid
- 2006-07-17 Listed $79,990 NWMLS as Distributed by MLS Grid
Cash-flow waterfall
monthlySold comps — $/sqft
last 12 mo · ≤1 miLoading sold comps…