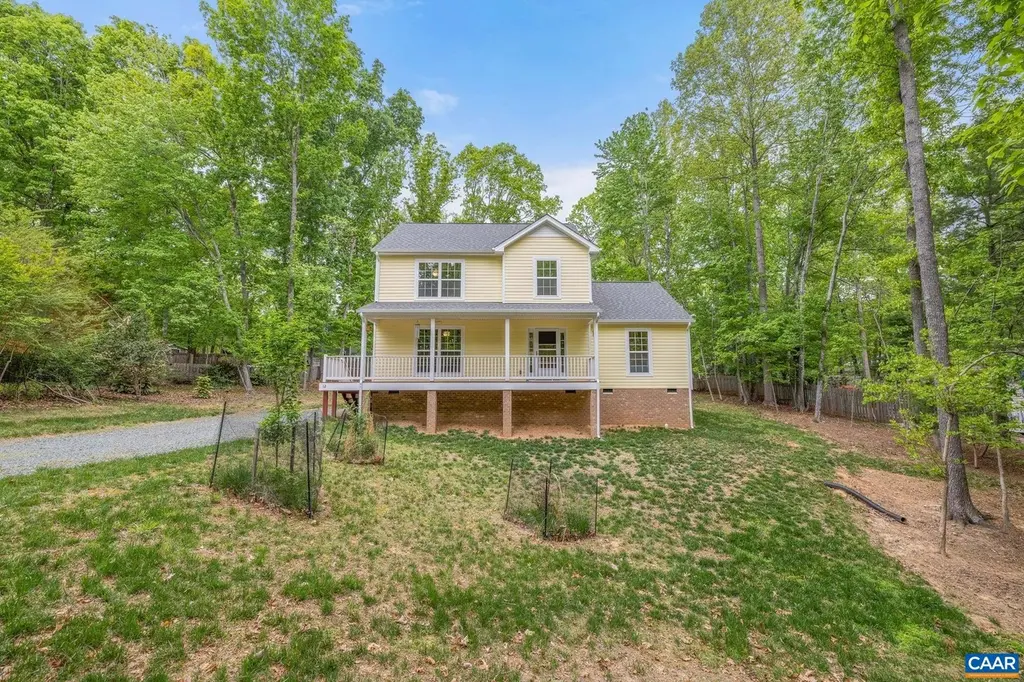
12 Fairwood Pl · Lake Monticello, VA
Flood risk 1/10 · Minimal
- FEMA flood zone
- X (unshaded)
- Chance of flooding over 30 yrs
- 0.0%
- Est. flood insurance / yr
- $507 – $1,088
Fire risk 1/10 · Minimal
- Est. fire insurance / yr
- $666 – $1,236
Heat risk 6/10 · Moderate
- Hot days now (above 104°F)
- 7 days/yr
- Hot days in 30 yrs
- 17 days/yr
Wind risk 3/10 · Minor
- Chance of severe wind over 30 yrs
- 4.0%
Air-quality risk 1/10 · Minimal
- Unhealthy air days now
- 0 days/yr
- Unhealthy air days in 30 yrs
- 0 days/yr
Risk factors via First Street. Map © Google.
Why this score? — see what drove the F grade
The composite is a weighted blend of 9 inputs, each scored 0–100. Each bar is that input's sub-score; the figure is the points it added to the 100-point composite (weight × sub-score).
- Cash flow +7.4/30.0
- ARV discount +6.9/15.0
- Schools +5.8/10.0
- Livability +3.4/5.0
- Rent growth +2.5/5.0
- Condition / age +2.5/5.0
- 1% rule +1.7/10.0
- DSCR +1.6/10.0
- Appreciation +0.0/10.0
$350,000
🖨 Deal sheet (PDF) 📄 Offer letter ✓ Due diligence
Listing remarks MLS
Building lot at Lake Monticello. Nearly level and close to Beach 4!
Key facts
- 0.34 acre lot
- Community pool
- Built 2023
Property features AI
Finance
- HOA & community: Homeowners association with annual fee of $1,495; Association amenities include clubhouse, pool, playground, tennis and basketball courts, sports fields, meeting room, beach rights, boat ramp, water access, trash service, road maintenance, snow removal, association management, and insurance; Association fee paid annually
Exterior
- Utilities: Cable available; Fiber optic available; Community/co-op water; Community/co-op sewer; Shared septic
- Home design: Detached single-family home; Two stories; Above-grade finished area provided by builder
- Construction: Stick built construction; Vinyl siding; Wood siding; Block foundation; Built with builder-provided finished area
- Exterior features: Deck; Front porch; Porch; Association pool
Interior
- Kitchen: Dishwasher; Electric range; Microwave; Refrigerator; Disposal; Eat-in kitchen
- Bedrooms: Primary bedroom on the first floor; One main-level bedroom; Additional bedroom on the second floor
- Flooring: Carpet; Luxury vinyl plank
- Bathrooms: Two full bathrooms; One half bathroom; Two main-level bathrooms
- Heating & cooling: Central heating; Heat pump; Central air conditioning
- Interior features: Primary bedroom on the first floor; Eat-in kitchen
- Laundry & utility: Washer; Dryer; Main-level laundry
Neighborhood map
What this means for you Summary
Snapshot
- This is a 3-bed/2.0-bath single-family listed at $350k.
Deal economics
- At list price, monthly cash flow is $-444 ($-5k/yr) — negative.
- To cash-flow at today's rent, offer at most $272k (22.4% below list).
- To meet the 1% rule (rent ≥ 1% of price), the offer needs to be $235k (32.9% below list).
- Recommended offer: $235k (32.9% below list) — sets the bar for 1% rule.
- Cap rate 4.8% vs local median 3.6% in Lake Monticello — top-decile yield for the area; either an underpriced asset or a hidden risk that comps aren't pricing in. Stress-test before assuming the spread holds.
Location & tenants
- Location reads 67/100 on livability (#284 in VA) — a middle-class / working-renter tenant base. Strengths: employment A+, housing A+, crime A; Watch: amenities F, commute F, health & safety F.
- Fluvanna County Public School District (rural): math 61% / reading 71% proficiency, ranked #34 of 131 in VA (top 26%) — acceptable for families but not a draw, mixed tenant base, ~2y average lease.
- Zoned schools: Central Elementary (715 students, 52% FRL); Fluvanna Middle (math 65% / reading 70%, grade A-, #98 of 342 statewide, top 30%, 763 students, 42% FRL); Fluvanna County High (math 60% / reading 76%, grade B, #180 of 319 statewide, top 57%, 1,488 students, 37% FRL) — zoned schools average 44% FRL vs 23% district-wide (21 pts higher); higher-poverty schools than district average — tighter screening recommended.
- Market conditions: 200 active listings in the ZIP; 4 comparable units currently listed for rent nearby; rentals lingering (median 45d on market — plan ~5-8 weeks vacancy on turnover, expect pricing pressure); 75% of comp listings sitting > 30 days — soft ceiling on asking rent; solid renter incomes; 138 units permitted in Fluvanna County in 2024 (6 in 5+ unit buildings).
Forward outlook
- Local home prices are declining (-3.0%/yr); year-one equity from $2k of loan paydown is wiped out by about $10k of value loss. Plan a longer hold.
Negotiation context
- It's been on market 49 days — a 3% lower offer ($340k) is reasonable based on typical stale-listing flexibility.
- 2 sale attempts since 6y ago; this cycle's ask is 1107% above the opening price — seller raised mid-cycle; expect resistance to lowballs.
- Current owner paid $26k; list at $350k implies a 1221% gain — meaningful room to come down on a strong offer.
Risks & watch-outs
- Climate carrying-cost: extreme-heat days projected 7→17/yr by 2055 (HVAC capex compounding) — expect insurance premiums to compound above CPI over the hold.
Questions for the listing agent
- What do current leases actually rent for vs. the listed asking? Can we see a recent rent roll and the last 12 months of T-12 income?
- It's been on market 49 days. Have you received any prior offers? Is the seller open to a 33% concession, seller financing, or rate buy-down credit?
- What does the HOA fee cover, when was the last increase, and are there any pending special assessments or reserve-fund shortfalls?
- Is there a deadline driving the sale (1031 exchange, divorce, estate, relocation)? That informs how much negotiation room exists.
- Schools are D-rated, which usually means shorter tenancies and higher turnover. Who's the typical renter profile here, and what's been the actual vacancy rate?
- The area grade is low — what's the realistic commute time and amenity access for the typical tenant pool here? Any planned neighborhood developments (good or bad) we should know about?
- What's the average days-on-market for RENTAL listings here right now (not sales)? A rising rental-DOM trend means longer vacancies and softer asking-rent achievability than the comps imply.
- What's the recent tenant-quality profile in this submarket — average credit score on applications, eviction rate, late-payment / NSF rate, and stable-employment percentage? A property-management company in the area should have these aggregated.
- How much new for-sale + rental construction is in the pipeline within 1–3 miles? Heavy new supply typically softens prices + rents 12–24 months out; constrained supply supports both.
Investment metrics
- 1% rule
- 0.67% ✗
- Cap rate
- 4.77%
- Cash-on-cash
- -5.44%
- DSCR
- 0.76
- GRM
- 12.4
CMA / ARV
- ARV (median comp)
- $345,681
- List price
- $350,000
- Delta
- 1.25%
- Verdict
- FAIR
- Comps
- 20 within 1.0 mi
Show comp detail 12 sales within ~0.75 mi
| Address | Dist | Beds/Ba | Sqft | Sold | Price | $/sf | Match |
|---|---|---|---|---|---|---|---|
| 15 Smokewood Dr | 0.25mi | 3/2.0 | 1,811 (+1%) | 1mo | $359,000 | $198 | 87 |
| 3 Hawks Pl | 0.33mi | 3/2.5 | 1,778 (-1%) | 7mo | $300,000 | $169 | 74 |
| 14 Woodlawn Dr | 0.37mi | 4/2.5 (+1) | 1,792 (-0%) | 3mo | $399,000 | $223 | 73 |
| 24 Xebec Rd | 0.13mi | 3/2.5 | 1,582 (-12%) | 8mo | $299,000 | $189 | 65 |
| 10 Briarwood Rd | 0.61mi | 4/2.0 (+1) | 1,780 (-1%) | 1mo | $300,000 | $169 | 64 |
| 64 Woodlawn Dr | 0.42mi | 4/2.5 (+1) | 1,887 (+5%) | 6mo | $355,000 | $188 | 60 |
| 426 Jefferson Dr | 0.60mi | 3/2.5 | 1,750 (-3%) | 9mo | $341,700 | $195 | 58 |
| 340 Jefferson Dr | 0.56mi | 3/2.5 | 1,960 (+9%) | 2mo | $337,000 | $172 | 55 |
| 4 Clark Ct | 0.68mi | 3/2.5 | 1,712 (-5%) | 7mo | $327,000 | $191 | 52 |
| 267 Jefferson Dr | 0.57mi | 3/2.5 | 1,942 (+8%) | 8mo | $400,000 | $206 | 52 |
| 9 Brougham Rd | 0.53mi | 3/2.0 | 1,564 (-13%) | 8mo | $359,900 | $230 | 47 |
| 2 Barkley Ln | 0.71mi | 3/2.0 | 1,594 (-11%) | 8mo | $250,000 | $157 | 41 |
Match score weights: distance 35% · size 25% · config 20% · recency 20%. Top-matched comps best support the ARV.
Projected returns pro-forma
-3.0% appreciation · 3.0% rent growth · sell at horizon
- IRR
- -25.6%
- Equity multiple
- 0.13×
- Total profit
- $-85,027
- Equity at exit
- $52,186
- IRR
- -22.1%
- Equity multiple
- -0.13×
- Total profit
- $-110,602
- Equity at exit
- $30,262
Cash invested: $98,000 (down + closing). Projections, not guarantees.
Landlord ↔ Tenant lean methodology
- Overall (STATE)
- 55 Moderately Landlord-Leaning
- State Virginia
- 55 Moderately Landlord-Leaning · D+2
- County
- — inherits STATE
- City
- — inherits STATE
ZIP-level market 22963
- Active inventory
- 200
- Price-to-rent
- 12.4×
Monthly cashflow live
- Estimated rent
- $2,347 medium interval (Pro) →
- Mortgage (P&I)
- −$1,835
- Tax from tax record
- −$192 /mo · $2,305/yr
- Insurance
- −$146
- HOA
- −$125
- Vacancy / Maint / Mgmt
- −$493
- Net cashflow
- $-444
Break-even live
Sensitivity live
| Price | -10% $-246 | -5% $-345 | +0% $-444 | +5% $-543 | +10% $-642 |
|---|---|---|---|---|---|
| Rent | -10% $-629 | -5% $-537 | +0% $-444 | +5% $-351 | +10% $-258 |
| Rate | -1.0pp $-268 | -0.5pp $-355 | base $-444 | +0.5pp $-535 | +1.0pp $-627 |
UW: 25.0% down · 7.5% · 30yr · 1.5% tax · 5.0% vac · 8.0% maint · 8.0% mgmt
Financing live
Cash to close
- Down payment
- $87,500
- Closing costs
- $10,500
- Reserves months
- —
- Total cash needed
- —
Loan-product check · same deal, 3 products live
Conventional
25% down · 7.5% · 30yr
- Down + closing
- —
- Monthly P&I
- —
- Monthly cashflow
- —
- DSCR
- —
- Eligible?
- —
Personal DTI + credit; lowest rate.
DSCR
20% down · 8.5% · 30yr
- Down + closing
- —
- Monthly P&I
- —
- Monthly cashflow
- —
- DSCR
- —
- Eligible?
- —
No personal income docs; deal must DSCR.
Hard money
10% down · 12.0% · 12mo
- Down + closing
- —
- Monthly P&I
- —
- Monthly cashflow
- —
- DSCR
- —
- Eligible?
- —
Short-term bridge; refi at stabilization.
Rent comps 4 comps
| Address | Beds | Baths | Sqft | Rent | $/sqft | DOM | Units | Dist |
|---|---|---|---|---|---|---|---|---|
| 367 Jefferson Dr Palmyra, VA | 2.0 | 1.5 | 1434 | $1,750 | $1.22 | 44d | 1 | 0.42mi |
| 1 Old Mill Ct Palmyra, VA | 4.0 | 2.0 | 2082 | $2,200 | $1.06 | 44d | 1 | 0.50mi |
| 15 Tobacco Ter Palmyra, VA | 3.0 | 2.5 | 2300 | $3,300 | $1.43 | 44d | 1 | 0.87mi |
| 25 Glen Burnie Rd Palmyra, VA | 3.0 | 2.5 | 2128 | $2,850 | $1.34 | 6d | 1 | 0.90mi |
HOA detail
- Monthly dues
- $125 · $1,500/yr
Listing history 21 events
-
2026-06-19days on market $350,000 Active 49 DOM
-
2026-06-18days on market $350,000 Active 48 DOM
-
2026-06-17days on market $350,000 Active 47 DOM
-
2026-06-16days on market $350,000 Active 46 DOM
-
2026-06-15days on market $350,000 Active 45 DOM
-
2026-06-14days on market $350,000 Active 43 DOM
-
2026-06-13days on market $350,000 Active 42 DOM
-
2026-06-10days on market $350,000 Active 40 DOM
-
2026-06-09days on market $350,000 Active 39 DOM
-
2026-06-08days on market $350,000 Active 38 DOM
-
2026-06-07days on market $350,000 Active 37 DOM
-
2026-06-02pricedays on market $350,000 Active 32 DOM
-
2026-06-01days on market $365,000 Active 31 DOM
-
2026-05-31days on market $365,000 Active 30 DOM
-
2026-05-30days on market $365,000 Active 29 DOM
-
2026-05-01status Active 1224-char remark
-
2026-04-30historical 1224-char remark
-
2026-04-28historical $375,000 1224-char remark
-
2021-03-31soldstatus $26,500 67-char remark
Show marketing remark (67 chars)
Building lot at Lake Monticello. Nearly level and close to Beach 4!
-
2020-06-05$29,000 67-char remark
Show marketing remark (67 chars)
Building lot at Lake Monticello. Nearly level and close to Beach 4!
-
1975-01-01soldstatus $7,000
ⓘ Source: listings_history table (triggers on properties + properties_extension) + one-shot
backfill from property_details.listing_events for pre-trigger history.
Tax reassessment forecast VA · Resets to sale price
- Current annual tax
- $2,305 · $192/mo
- Projected year-2 tax
- $2,870 · $239/mo
- Expected delta
- +$565/yr (+$47/mo · 24.5%)
ⓘ Screening estimate from a state-policy table — verify with the county assessor before closing.
Climate risk First Street
- Flood 1/10 Low FEMA zone X (unshaded) · 0% chance over 30 yrs
- Wildfire 1/10 Low
- Heat 6/10 Major 7 d/yr ≥104°F today · 17 d/yr by 30 yrs out
- Wind 3/10 Moderate 4% chance of damaging wind over 30 yrs
- Air quality 1/10 Low 0 unhealthy d/yr today · 0 by 30 yrs out
Nearby sold comps map
Loading sold comps map…
Walkable amenities ~0.75 mi
Loading nearby amenities…
Taxation est. · year 1
- Rental income
- $28,168
- − Mortgage interest
- −$19,605
- − Property taxes
- −$2,305
- − Insurance
- −$1,750
- − Repairs & maintenance
- −$2,253
- − Management
- −$2,253
- − HOA
- −$1,500
- − Depreciation
- −$10,182
- Taxable loss
- −$11,681
- Est. tax savings @ 24.0%
- +$2,803
- After-tax cash flow
- $-2,524/yr
For passive investors: Depreciation is non-cash, so a rental often shows a tax loss while cash-flowing — sheltering income. Rental losses are passive: they offset passive income freely, and up to $25,000/yr can offset ordinary (W-2) income if you actively participate and your MAGI is under $100k (phasing out to $0 by $150k); unused losses carry forward. On sale, claimed depreciation is recaptured at up to 25%, and gains may owe capital-gains tax (a 1031 exchange can defer both). Figures are a year-1 estimate at your 24.0% rate — not tax advice; consult a CPA.
Schools (NCES district)
- District
- Fluvanna County Public School District
- NCES district ID
- 5101380
- Math proficiency
- 61% ▼ -23.00%
- Reading proficiency
- 71% ▼ -4.00%
- Median HH income
- $66,601
- Composite
- 57.6/100
- National rank
- #1065
- State rank
- #34 of 131 in VA
Livability — Lake Monticello
- Score
- 67/100
- State rank
- #284
- US rank
- #10173
Category grades
Schools grade is shown separately in the Schools card above.
Census & demographics
- Census place
- Lake Monticello, VA
- County
- Fluvanna County · 16,896 people
- Metro
- Charlottesville, VA
- Population (ZIP)
- 16,896
- Household income
- $104,259
- Rent vs Own
- Severe rent burden
- 47.0
Population outlook (Fluvanna County) Hauer SSP2
- Today (2025)
- 27,237 people
- By 2030
- 27,607 · +1.4%
- By 2040
- 28,075 · +3.1%
- By 2050
- 28,019 · +2.9%
- By 2075
- 28,058 · +3.0%
- By 2100
- 26,124 · -4.1%
Race, ethnicity, and origin ACS 2023
- Neighborhood character
- Predominantly White (78%)
- Race & ethnicity
- White 78% Black 10% Two or more races 7% Hispanic / Latino 5%
- Hispanic origin (detail)
- Mexican 1% Puerto Rican 1%
- Common ancestry
- Italian 3% Romanian 3% Slovak 3%
- Foreign-born
- 3% · Canada, China
- Languages at home
- 95% English-only · Spanish 3% Chinese 1%
Political lean MEDSL · Fluvanna
- 2024 margin
- Lean R (+6.3) · D 46.4% · R 52.6% · Other 1.0%
- 2008→2024 swing
- -4.4pp toward R · 2008: -1.8pp · 2024: -6.3pp
- All cycles
- 2024: R+6.3 2020: R+4.7 2016: R+9.4 2012: R+6.2 2008: R+1.8
Not yet ingested
- Civics
- —
Market trends
- HPI YoY
- ▼ -111.94%
- Current HPI
- 158.3322
- Rent YoY
- —
- Metro
- Charlottesville, VA
- State GDP YoY
- ▲ 2.40%
- F500 in state
- 50
Industry mix (Fortune 500 HQ in VA)
| Industry | F500 HQs | Revenue |
|---|---|---|
| Aerospace / Defense | 4 | $236B |
|
||
| Technology / Defense | 3 | $32B |
|
||
| Financial Services | 2 | $176B |
|
||
| Utilities | 2 | $27B |
|
||
| Insurance | 2 | $25B |
|
||
| Technology | 2 | $15B |
|
||
Price history
+4900.0% since first listed8 events — show timeline
- 2026-06-01 Price Changed $350,000 CAAR
- 2026-05-22 Price Changed $365,000 CAAR
- 2026-05-01 Relisted — CAAR
- 2026-04-30 Listing Removed — CAAR
- 2026-04-28 Coming Soon $375,000 CAAR
- 2021-03-31 Sold (MLS) $26,500 CAAR
- 2020-06-05 Listed $29,000 CAAR
- 1975-01-01 Sold (Public Records) $7,000 Public Records
Property tax history
+201.7%/yrLatest (2025): $2,305 · +11.7% YoY. Source: county tax records.
Cash-flow waterfall
monthlySold comps — $/sqft
last 12 mo · ≤1 miLoading sold comps…