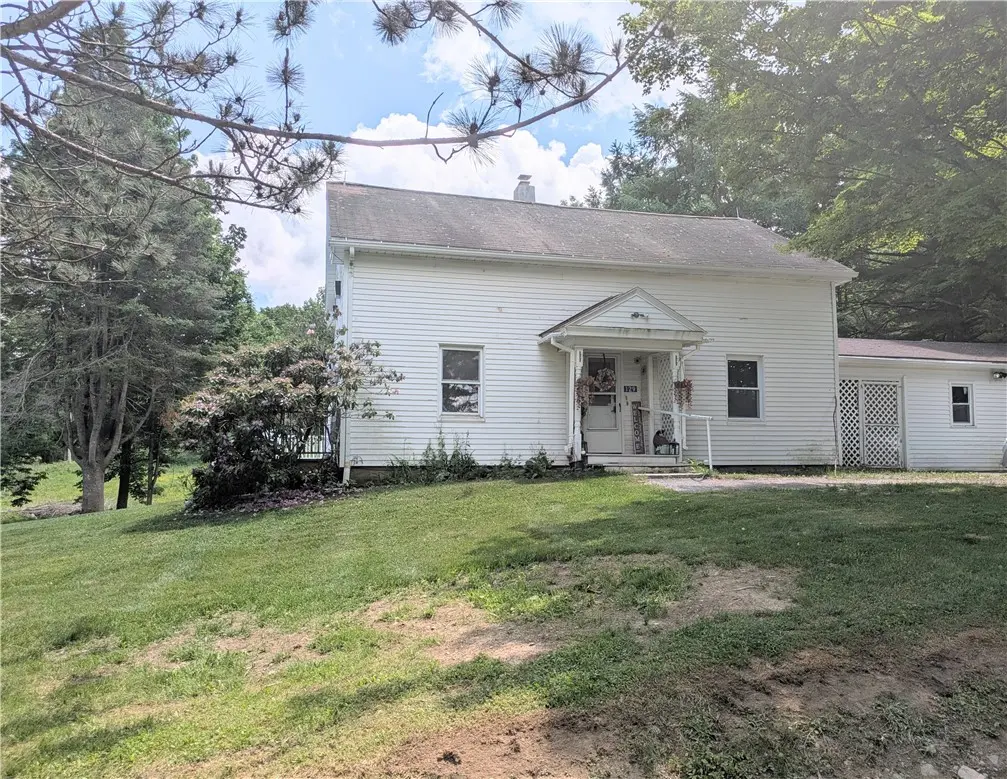
129 Havrish Rd · Jefferson, NY
Flood risk 1/10 · Minimal
- FEMA flood zone
- X (unshaded)
- Chance of flooding over 30 yrs
- 0.0%
- Est. flood insurance / yr
- $473 – $860
Fire risk 2/10 · Minimal
- Est. fire insurance / yr
- $691 – $1,283
Heat risk 1/10 · Minimal
- Hot days now (above 89°F)
- 7 days/yr
- Hot days in 30 yrs
- 16 days/yr
Wind risk 2/10 · Minimal
- Chance of severe wind over 30 yrs
- 2.0%
Air-quality risk 2/10 · Minimal
- Unhealthy air days now
- 0 days/yr
- Unhealthy air days in 30 yrs
- 1 days/yr
Risk factors via First Street. Map © Google.
Why this score? — see what drove the C grade
The composite is a weighted blend of 9 inputs, each scored 0–100. Each bar is that input's sub-score; the figure is the points it added to the 100-point composite (weight × sub-score).
- Cash flow +26.1/30.0
- DSCR +8.8/10.0
- Appreciation +7.6/10.0
- 1% rule +6.7/10.0
- Schools +2.9/10.0
- Rent growth +2.5/5.0
- Livability +2.5/5.0
- Condition / age +2.5/5.0
- ARV discount +0.0/15.0
$299,000
🖨 Deal sheet (PDF) 📄 Offer letter ✓ Due diligence
Listing remarks MLS
This 4 Bed 2 Bath farmhouse stunner is available now! Renovated and reimagined in '22-'23. Not a single expense spared! Completely remodeled from top to bottom. Country, farmhouse kitchen with plenty of butcher block countertop space. All solid oak cabinets. Open living spaces comprise the first floor, with rustic stone and wood accent walls. Refurbished hardwood floors. Kitchen and bathroom floors made up of ceramic tile. New stainless steel appliances that include range w/ oven and hood vent. Perennial gardens all around the property! 1 car garage along with separate detached shed/garage. All situated on a private, dead end road. Just the mailman and a few neighbors. Short term rental potential. Bring all offers! Highest and best offers due April 15th!
Key facts
- 1.8 acre lot
- Garage
- Built 1860
Property features AI
Exterior
- Parking: Attached garage; One garage space
- Utilities: Private well water; Septic tank
- Home design: Two-story frame house; Existing construction; Poured foundation
- Construction: Frame construction; Poured foundation; Existing (previously built) structure
- Exterior features: Gravel driveway; Shed(s) and storage; Irregular, rural lot; Lot dimensions approximately 550 x 400
Interior
- Kitchen: Gas oven and gas range; Dishwasher; Refrigerator; Kitchen island; Country-style kitchen
- Bedrooms: One bedroom on the main level; Total rooms: 7
- Flooring: Hardwood; Ceramic tile; Tile; Varied flooring types
- Bathrooms: Two full bathrooms; One full bathroom on the main level
- Heating & cooling: Forced air heating; Oil heating
- Interior features: Ceiling fans; Entrance foyer; Country-style kitchen; Kitchen island; Bedroom located on the main level; Full basement
- Laundry & utility: Washer and dryer; Main-level laundry; Propane water heater
Neighborhood map
What this means for you Summary
Snapshot
- This is a 4-bed/1.0-bath single-family listed at $299k.
Deal economics
- At list price, monthly cash flow is $750 ($9k/yr) — positive.
- The deal already cash-flows at list — no discount required.
- Meets the 1% rule at list price ($4k rent vs $299k).
Location & tenants
- Location reads: area grade C — affects rentability + tenant quality, not the cash-flow math above.
- Jefferson Central School District (rural): math 30% / reading 30% proficiency, ranked #723 of 755 in NY (top 96%) — families likely to look elsewhere, expect single-tenant / working-renter base with shorter leases.
- Market conditions: 36 active listings in the ZIP; 35 units permitted in Schoharie County in 2024 (0 in 5+ unit buildings).
Forward outlook
- In year one you build about $18k of equity ($2k loan paydown + $16k appreciation (5.2% local appreciation)).
- Schoharie County population projected at -30% by 2050 — secular population decline; favor cash flow + early exit over multi-decade hold.
- At projected returns (5.2% appreciation + 3.0% rent growth), your $84k cash investment doubles in ~3 years — after that, you're playing with house money.
- By year 3, paydown + projected appreciation supports a ~$44k cash-out refi (75% LTV) — recoverable capital for the next deal without selling this one.
Negotiation context
- Only 5 days on market — expect competitive offers; lowballing is unlikely to land.
- 5 sale attempts since 3y ago with the ask held roughly flat each time — persistent listings suggest the price (not the market) is what's stuck; bring a comps-based counter.
- Current owner paid $230k; 30% above their basis — modest negotiation headroom, anchor on the comps not their cost.
Risks & watch-outs
- Watch-outs: built in 1860 — expect roof / HVAC / electrical / plumbing capex.
Questions for the listing agent
- Built in 1860 — when were the roof, HVAC, electrical panel, plumbing, and water heater last replaced?
- Is there a deadline driving the sale (1031 exchange, divorce, estate, relocation)? That informs how much negotiation room exists.
- What's the average days-on-market for RENTAL listings here right now (not sales)? A rising rental-DOM trend means longer vacancies and softer asking-rent achievability than the comps imply.
- What's the recent tenant-quality profile in this submarket — average credit score on applications, eviction rate, late-payment / NSF rate, and stable-employment percentage? A property-management company in the area should have these aggregated.
- How much new for-sale + rental construction is in the pipeline within 1–3 miles? Heavy new supply typically softens prices + rents 12–24 months out; constrained supply supports both.
Investment metrics
- 1% rule
- 1.17% ✓
- Cap rate
- 9.30%
- Cash-on-cash
- 10.76%
- DSCR
- 1.48
- GRM
- 7.1
CMA / ARV
- ARV (on-the-fly)
- $228,967
- Comps found
- 1
Show comp detail 1 sale within ~0.75 mi
| Address | Dist | Beds/Ba | Sqft | Sold | Price | $/sf | Match |
|---|---|---|---|---|---|---|---|
| 129 Havrish Rd | 0.00mi | 4/2.0 | 2,267 (0%) | 24mo | $230,000 | $101 | 76 |
Match score weights: distance 35% · size 25% · config 20% · recency 20%. Top-matched comps best support the ARV.
Projected returns pro-forma
5.21% appreciation · 3.0% rent growth · sell at horizon
- IRR
- 22.6%
- Equity multiple
- 2.44×
- Total profit
- $120,286
- Equity at exit
- $173,212
- IRR
- 21.9%
- Equity multiple
- 4.83×
- Total profit
- $320,787
- Equity at exit
- $302,108
Cash invested: $83,720 (down + closing). Projections, not guarantees.
Landlord ↔ Tenant lean methodology
- Overall (STATE)
- 15 Strongly Tenant-Friendly
- State New York
- 15 Strongly Tenant-Friendly · D+10
- County
- — inherits STATE
- City
- — inherits STATE
ZIP-level market 12167
- Home prices YoY
- 1.4%
- Active inventory
- 36
- Price-to-rent
- 7.1×
Monthly cashflow live
- Estimated rent
- $3,509 medium interval (Pro) →
- Mortgage (P&I)
- −$1,568
- Tax from tax record
- −$329 /mo · $3,948/yr
- Insurance
- −$125
- HOA
- −$0
- Vacancy / Maint / Mgmt
- −$737
- Net cashflow
- $750
Break-even live
Sensitivity live
| Price | -10% $920 | -5% $835 | +0% $750 | +5% $666 | +10% $581 |
|---|---|---|---|---|---|
| Rent | -10% $473 | -5% $612 | +0% $750 | +5% $889 | +10% $1,028 |
| Rate | -1.0pp $901 | -0.5pp $827 | base $750 | +0.5pp $673 | +1.0pp $594 |
UW: 25.0% down · 7.5% · 30yr · 1.5% tax · 5.0% vac · 8.0% maint · 8.0% mgmt
Financing live
Cash to close
- Down payment
- $74,750
- Closing costs
- $8,970
- Reserves months
- —
- Total cash needed
- —
Loan-product check · same deal, 3 products live
Conventional
25% down · 7.5% · 30yr
- Down + closing
- —
- Monthly P&I
- —
- Monthly cashflow
- —
- DSCR
- —
- Eligible?
- —
Personal DTI + credit; lowest rate.
DSCR
20% down · 8.5% · 30yr
- Down + closing
- —
- Monthly P&I
- —
- Monthly cashflow
- —
- DSCR
- —
- Eligible?
- —
No personal income docs; deal must DSCR.
Hard money
10% down · 12.0% · 12mo
- Down + closing
- —
- Monthly P&I
- —
- Monthly cashflow
- —
- DSCR
- —
- Eligible?
- —
Short-term bridge; refi at stabilization.
Listing history 4 events
-
2026-06-21days on market $299,000 Active 5 DOM
-
2026-06-21days on market $299,000 Active 4 DOM
-
2026-06-18days on market $299,000 Active 2 DOM
-
2026-06-17$299,000 Active 1 DOM
ⓘ Source: listings_history table (triggers on properties + properties_extension) + one-shot
backfill from property_details.listing_events for pre-trigger history.
Tax reassessment forecast NY · Partial reset (capped growth)
- Current annual tax
- $3,948 · $329/mo
- Projected year-2 tax
- $4,500 · $375/mo
- Expected delta
- +$553/yr (+$46/mo · 14.0%)
ⓘ Screening estimate from a state-policy table — verify with the county assessor before closing.
Climate risk First Street
- Flood 1/10 Low FEMA zone X (unshaded) · 0% chance over 30 yrs
- Wildfire 2/10 Low
- Heat 1/10 Low 7 d/yr ≥89°F today · 16 d/yr by 30 yrs out
- Wind 2/10 Low 2% chance of damaging wind over 30 yrs
- Air quality 2/10 Low 0 unhealthy d/yr today · 1 by 30 yrs out
Nearby sold comps map
Loading sold comps map…
Walkable amenities ~0.75 mi
Loading nearby amenities…
Taxation est. · year 1
- Rental income
- $42,107
- − Mortgage interest
- −$16,749
- − Property taxes
- −$3,948
- − Insurance
- −$1,495
- − Repairs & maintenance
- −$3,369
- − Management
- −$3,369
- − Depreciation
- −$8,698
- Taxable income
- $4,480
- Est. tax owed @ 24.0%
- −$1,075
- After-tax cash flow
- $7,931/yr
For passive investors: Depreciation is non-cash, so a rental often shows a tax loss while cash-flowing — sheltering income. Rental losses are passive: they offset passive income freely, and up to $25,000/yr can offset ordinary (W-2) income if you actively participate and your MAGI is under $100k (phasing out to $0 by $150k); unused losses carry forward. On sale, claimed depreciation is recaptured at up to 25%, and gains may owe capital-gains tax (a 1031 exchange can defer both). Figures are a year-1 estimate at your 24.0% rate — not tax advice; consult a CPA.
Schools (NCES district)
- District
- Jefferson Central School District
- NCES district ID
- 3615720
- Math proficiency
- 30% ▬ 0.00%
- Reading proficiency
- 30% ▬ 0.00%
- Median HH income
- $50,778
- Composite
- 29.11/100
- National rank
- #11892
- State rank
- #723 of 755 in NY
Livability — Jefferson
No livability data for this city. (Only ~50 U.S. cities are tracked.)
Census & demographics
- Population (ZIP)
- 2,257
Population outlook (Schoharie County) Hauer SSP2
- Today (2025)
- 29,080 people
- By 2030
- 27,417 · -5.7%
- By 2040
- 23,835 · -18.0%
- By 2050
- 20,482 · -29.6%
- By 2075
- 14,323 · -50.7%
- By 2100
- 9,636 · -66.9%
Race, ethnicity, and origin ACS 2023
- Neighborhood character
- Predominantly White (94%)
- Race & ethnicity
- White 94% Two or more races 4% Hispanic / Latino 2%
- Common ancestry
- Romanian 8% Iranian 3% Lithuanian 2%
- Foreign-born
- 3% · Canada, China
- Languages at home
- 94% English-only · Other Indo-European 3% Spanish 1% Russian/Polish/Slavic 1%
Political lean MEDSL · Schoharie
- 2024 margin
- Solid R (+30.5) · D 34.7% · R 65.3%
- 2008→2024 swing
- -16.2pp toward R · 2008: -14.3pp · 2024: -30.5pp
- All cycles
- 2024: R+30.5 2020: R+29.0 2016: R+34.7 2012: R+16.6 2008: R+14.3
Not yet ingested
- Civics
- —
Market trends
- HPI YoY
- ▲ 5.21%
- Current HPI
- 368.4492
- Rent YoY
- —
- Metro
- —
- State GDP YoY
- ▲ 2.60%
- F500 in state
- 92
Industry mix (Fortune 500 HQ in NY)
| Industry | F500 HQs | Revenue |
|---|---|---|
| Financial Services | 10 | $950B |
|
||
| Consumer Goods | 9 | $162B |
|
||
| Insurance | 4 | $225B |
|
||
| Telecommunications | 2 | $144B |
|
||
| Pharmaceuticals | 2 | $112B |
|
||
| Media / Entertainment | 2 | $69B |
|
||
Price history
-12.0% since first listed15 events — show timeline
- 2026-06-16 Listed $299,000 UNYREIS
- 2024-06-28 Sold (MLS) $230,000 Global MLS
- 2024-04-12 Pending — Global MLS
- 2024-03-30 Price Changed $275,000 Global MLS
- 2024-01-08 Listed $289,900 Global MLS
- 2023-10-18 Listing Removed — Global MLS
- 2023-10-15 Price Changed $275,000 Global MLS
- 2023-08-31 Listed $289,000 Global MLS
- 2023-07-30 Price Changed $289,000 Global MLS
- 2023-07-19 Relisted — Global MLS
- 2023-07-12 Contingent — Global MLS
- 2023-07-12 Listing Removed — Global MLS
- 2023-05-24 Price Changed $299,000 Global MLS
- 2023-04-02 Price Changed $325,000 Global MLS
- 2023-02-27 Listed $339,900 Global MLS
Property tax history
+2.6%/yrLatest (2025): $3,948 · +1.4% YoY. Source: county tax records.
Cash-flow waterfall
monthlySold comps — $/sqft
last 12 mo · ≤1 miLoading sold comps…