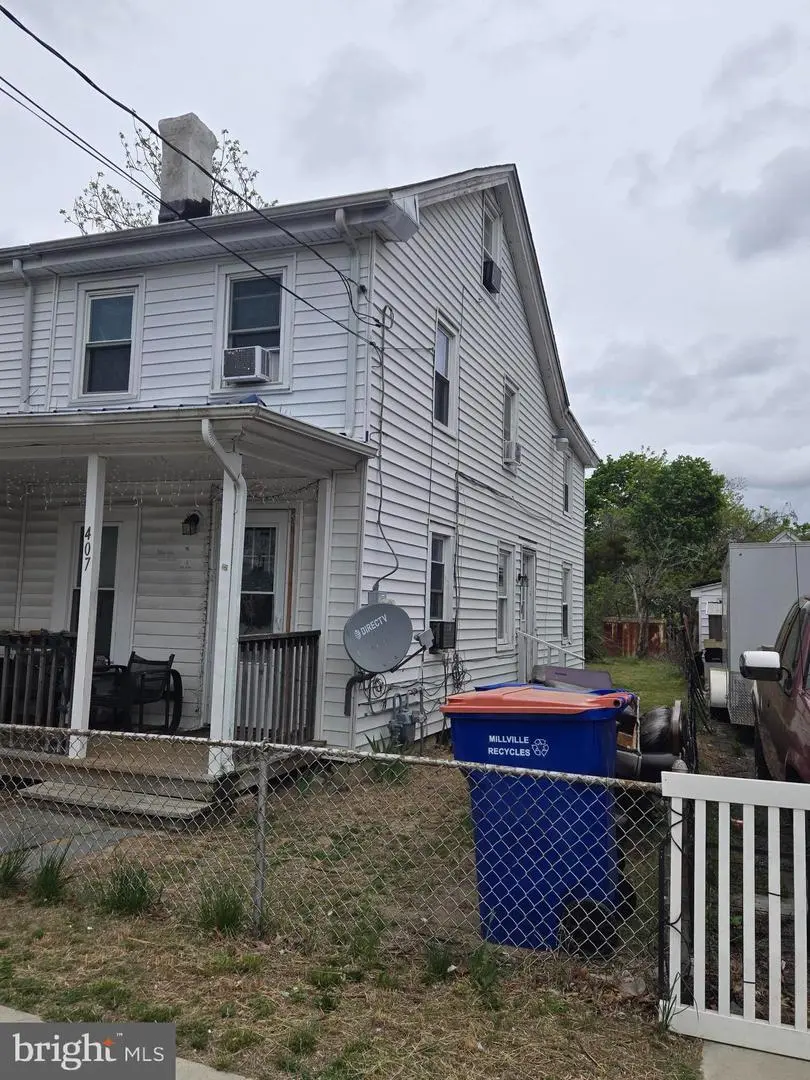
407 5th St N N · Millville, NJ
Flood risk 1/10 · Minimal
- FEMA flood zone
- X (unshaded)
- Chance of flooding over 30 yrs
- 0.0%
- Est. flood insurance / yr
- $507 – $1,088
Fire risk 5/10 · Moderate
- Est. fire insurance / yr
- $526 – $976
Heat risk 7/10 · Major
- Hot days now (above 103°F)
- 7 days/yr
- Hot days in 30 yrs
- 15 days/yr
Wind risk 6/10 · Moderate
- Chance of severe wind over 30 yrs
- 71.0%
Air-quality risk 3/10 · Minor
- Unhealthy air days now
- 2 days/yr
- Unhealthy air days in 30 yrs
- 4 days/yr
Risk factors via First Street. Map © Google.
Why this score? — see what drove the B- grade
The composite is a weighted blend of 9 inputs, each scored 0–100. Each bar is that input's sub-score; the figure is the points it added to the 100-point composite (weight × sub-score).
- Cash flow +30.0/30.0
- ARV discount +10.7/15.0
- DSCR +10.0/10.0
- 1% rule +8.8/10.0
- Livability +3.2/5.0
- Rent growth +3.0/5.0
- Condition / age +2.5/5.0
- Schools +1.5/10.0
- Appreciation +0.0/10.0
$125,000
🖨 Deal sheet (PDF) 📄 Offer letter ✓ Due diligence
Listing remarks MLS
ROOMY HALF DOUBLE, VERY LARGE BACK YARD. BEING SOLD STRICTLY AS IS, NO CERTIFICATIONS!
Key facts
- Built 1926
- Listed 48 days
Property features AI
Finance
- Other: Finished above-grade area reported as 1,094 (assessor)
- Financial info: Land and improvement assessed separately (assessed values recorded); Tax/assessment details available
Exterior
- Parking: On-street parking
- Utilities: Public water; Public sewer
- Home design: Semi-detached structure; Pitched shingle roof; Frame construction; Entry level information not specified; Property condition listed as average; Ownership is fee simple
- Construction: Frame construction materials; Other type foundation; Other structures above and below grade
- Exterior features: Not in a federal flood zone; Lot dimensions approximately 16 x 165
Interior
- Bedrooms: 3 bedrooms on the main level
- Bathrooms: 1 full bathroom on the main level
- Heating & cooling: Forced air heating (natural gas); Wall unit cooling (electric); Natural gas hot water
- Interior features: No basement; Living area recorded from assessor
Neighborhood map
What this means for you Summary
Snapshot
- This is a 3-bed/1.0-bath townhouse listed at $125k.
Deal economics
- At list price, monthly cash flow is $470 ($6k/yr) — positive.
- The deal already cash-flows at list — no discount required.
- Meets the 1% rule at list price ($2k rent vs $125k).
- Recommended offer: $121k (3.0% below list) — sets the bar for market timing.
- Cap rate 10.8% vs local median 4.2% in Millville — top-decile yield for the area; either an underpriced asset or a hidden risk that comps aren't pricing in. Stress-test before assuming the spread holds.
Location & tenants
- Location reads 63/100 on livability (#431 in NJ) — a middle-class / working-renter tenant base. Strengths: housing A+, health & safety B+; Watch: crime F, amenities F, commute F.
- Millville School District (suburban): math 6% / reading 28% proficiency, ranked #447 of 472 in NJ (top 95%) — low school quality limits family demand, transient renter base, plan for 1-2y turnover; 60% free/reduced lunch — lower-income household profile, screen leases tightly.
- Zoned schools: Silver Run Elementary School (math 0% / reading 19%, grade F, #1,235 of 1,303 statewide, top 96%, 427 students, 91% FRL); Lakeside Middle School (math 5% / reading 31%, grade F, #405 of 431 statewide, top 95%, 987 students, 70% FRL); Millville Senior High School (math 24% / reading 24%, grade F, #327 of 399 statewide, top 82%, 1,640 students, 68% FRL) — zoned schools average 76% FRL vs 60% district-wide (16 pts higher); higher-poverty schools than district average — tighter screening recommended.
- Market conditions: Rents rising (+1.9%/yr); 297 active listings in the ZIP; 3 comparable units currently listed for rent nearby; rentals lingering (median 45d on market — plan ~5-8 weeks vacancy on turnover, expect pricing pressure); 67% of comp listings sitting > 30 days — soft ceiling on asking rent; 216 units permitted in Cumberland County in 2024 (73 in 5+ unit buildings).
Forward outlook
- Local home prices are declining (-3.0%/yr); year-one equity from $864 of loan paydown is wiped out by about $4k of value loss. Plan a longer hold.
- Cumberland County population projected to shrink 7% by 2050 — rents likely to lag national; underwrite the cash flow, not the appreciation.
- At projected returns (-3.0% appreciation + 1.9% rent growth), your $35k cash investment doubles in ~9 years — after that, you're playing with house money.
Negotiation context
- It's been on market 48 days — a 3% lower offer ($121k) is reasonable based on typical stale-listing flexibility.
- 2 sale attempts since 21y ago; this cycle's ask has dropped $20k (14%) from the opening price — seller is motivated, your offer sets the floor, not the list.
- Current owner paid $53k; list at $125k implies a 136% gain — meaningful room to come down on a strong offer.
Risks & watch-outs
- Watch-outs: built in 1926 — expect roof / HVAC / electrical / plumbing capex.
- Climate carrying-cost: major wind risk, 71% chance of damaging wind over 30y; moderate wildfire risk; extreme-heat days projected 7→15/yr by 2055 (HVAC capex compounding) — expect insurance premiums to compound above CPI over the hold.
Questions for the listing agent
- It's been on market 48 days. Have you received any prior offers? Is the seller open to a 3% concession, seller financing, or rate buy-down credit?
- Built in 1926 — when were the roof, HVAC, electrical panel, plumbing, and water heater last replaced?
- Is there a deadline driving the sale (1031 exchange, divorce, estate, relocation)? That informs how much negotiation room exists.
- Schools are F-rated, which usually means shorter tenancies and higher turnover. Who's the typical renter profile here, and what's been the actual vacancy rate?
- Crime grade is F in this area — have there been break-ins, vandalism, or insurance claims at this property in the last 3 years? What carrier currently insures it and at what premium?
- What's the average days-on-market for RENTAL listings here right now (not sales)? A rising rental-DOM trend means longer vacancies and softer asking-rent achievability than the comps imply.
- What's the recent tenant-quality profile in this submarket — average credit score on applications, eviction rate, late-payment / NSF rate, and stable-employment percentage? A property-management company in the area should have these aggregated.
- How much new for-sale + rental construction is in the pipeline within 1–3 miles? Heavy new supply typically softens prices + rents 12–24 months out; constrained supply supports both.
Investment metrics
- 1% rule
- 1.38% ✓
- Cap rate
- 10.80%
- Cash-on-cash
- 16.10%
- DSCR
- 1.72
- GRM
- 6.1
CMA / ARV
- ARV (on-the-fly)
- $134,562
- Comps found
- 12
Show comp detail 12 sales within ~0.75 mi
| Address | Dist | Beds/Ba | Sqft | Sold | Price | $/sf | Match |
|---|---|---|---|---|---|---|---|
| 515 N 5th St | 0.10mi | 3/1.0 | 1,100 (+0%) | 8mo | $160,000 | $145 | 88 |
| 215 D St | 0.32mi | 3/1.0 | 1,020 (-7%) | 0mo | $77,500 | $76 | 74 |
| 213 D St | 0.32mi | 3/1.0 | 1,020 (-7%) | 0mo | $77,500 | $76 | 74 |
| 610 E Pine St | 0.17mi | 4/1.5 (+1) | 1,200 (+10%) | 6mo | $197,500 | $165 | 64 |
| 315 S 3rd St | 0.54mi | 3/1.0 | 1,076 (-2%) | 11mo | $125,000 | $116 | 62 |
| 712 N 5th St | 0.31mi | 3/1.0 | 984 (-10%) | 13mo | $185,000 | $188 | 58 |
| 313 S 3rd St | 0.54mi | 3/1.0 | 1,020 (-7%) | 8mo | $125,000 | $123 | 57 |
| 123 W Foundry St | 0.72mi | 3/1.0 | 1,128 (+3%) | 10mo | $115,000 | $102 | 53 |
| 408 Powell St W | 0.64mi | 2/1.0 (-1) | 1,044 (-5%) | 7mo | $150,000 | $144 | 52 |
| 416 Green St W | 0.68mi | 3/1.0 | 1,001 (-8%) | 12mo | $125,000 | $125 | 44 |
| 907 Buck St | 0.61mi | 2/1.0 (-1) | 1,000 (-9%) | 14mo | $107,000 | $107 | 41 |
| 414 W Powell St | 0.65mi | 2/1.0 (-1) | 960 (-12%) | 5mo | $115,000 | $120 | 40 |
Match score weights: distance 35% · size 25% · config 20% · recency 20%. Top-matched comps best support the ARV.
Projected returns pro-forma
-3.0% appreciation · 1.94% rent growth · sell at horizon
- IRR
- 5.9%
- Equity multiple
- 1.23×
- Total profit
- $7,876
- Equity at exit
- $18,638
- IRR
- 14.3%
- Equity multiple
- 2.09×
- Total profit
- $38,243
- Equity at exit
- $10,808
Cash invested: $35,000 (down + closing). Projections, not guarantees.
Landlord ↔ Tenant lean methodology
- Overall (STATE)
- 21 Tenant-Leaning
- State New Jersey
- 21 Tenant-Leaning · D+6
- County
- — inherits STATE
- City
- — inherits STATE
ZIP-level market 08332
- Home prices YoY
- -28.9%
- Rents YoY
- 1.9%
- Active inventory
- 297
- Price-to-rent
- 6.1×
Monthly cashflow live
- Estimated rent
- $1,719 medium interval (Pro) →
- Mortgage (P&I)
- −$656
- Tax from tax record
- −$181 /mo · $2,174/yr
- Insurance
- −$52
- HOA
- −$0
- Vacancy / Maint / Mgmt
- −$361
- Net cashflow
- $470
Break-even live
Sensitivity live
| Price | -10% $540 | -5% $505 | +0% $470 | +5% $434 | +10% $399 |
|---|---|---|---|---|---|
| Rent | -10% $334 | -5% $402 | +0% $470 | +5% $537 | +10% $605 |
| Rate | -1.0pp $532 | -0.5pp $501 | base $470 | +0.5pp $437 | +1.0pp $404 |
UW: 25.0% down · 7.5% · 30yr · 1.5% tax · 5.0% vac · 8.0% maint · 8.0% mgmt
Financing live
Cash to close
- Down payment
- $31,250
- Closing costs
- $3,750
- Reserves months
- —
- Total cash needed
- —
Loan-product check · same deal, 3 products live
Conventional
25% down · 7.5% · 30yr
- Down + closing
- —
- Monthly P&I
- —
- Monthly cashflow
- —
- DSCR
- —
- Eligible?
- —
Personal DTI + credit; lowest rate.
DSCR
20% down · 8.5% · 30yr
- Down + closing
- —
- Monthly P&I
- —
- Monthly cashflow
- —
- DSCR
- —
- Eligible?
- —
No personal income docs; deal must DSCR.
Hard money
10% down · 12.0% · 12mo
- Down + closing
- —
- Monthly P&I
- —
- Monthly cashflow
- —
- DSCR
- —
- Eligible?
- —
Short-term bridge; refi at stabilization.
Rent comps 3 comps
| Address | Beds | Baths | Sqft | Rent | $/sqft | DOM | Units | Dist |
|---|---|---|---|---|---|---|---|---|
| 112 W Main St Unit B Millville, NJ | 3.0 | 1.0 | 1384 | $1,500 | $1.08 | 45d | 1 | 0.66mi |
| 301 N Wade Blvd Millville, NJ | 1.0–2.0 | 1.0 | 1005 | $1,715 | $1.71 | 15d | 10 | 0.82mi |
| 313 W Main St Millville, NJ | 3.0 | 1.5 | 1265 | $1,650 | $1.30 | 45d | 1 | 0.84mi |
Listing history 21 events
-
2026-06-22days on market $125,000 Active 48 DOM
-
2026-06-19days on market $125,000 Active 46 DOM
-
2026-06-18days on market $125,000 Active 45 DOM
-
2026-06-17days on market $125,000 Active 44 DOM
-
2026-06-16days on market $125,000 Active 43 DOM
-
2026-06-15days on market $125,000 Active 42 DOM
-
2026-06-14days on market $125,000 Active 40 DOM
-
2026-06-13days on market $125,000 Active 39 DOM
-
2026-06-10days on market $125,000 Active 37 DOM
-
2026-06-09days on market $125,000 Active 36 DOM
-
2026-06-08days on market $125,000 Active 35 DOM
-
2026-06-07pricedays on market $125,000 Active 34 DOM
-
2026-06-02days on market $145,000 Active 29 DOM
-
2026-06-01days on market $145,000 Active 28 DOM
-
2026-05-31days on market $145,000 Active 27 DOM
-
2026-05-30days on market $145,000 Active 26 DOM
-
2026-05-04$145,000 Active 358-char remark
-
2005-09-28soldstatus $53,000
-
2005-09-26soldstatus $53,000 86-char remark
Show marketing remark (86 chars)
ROOMY HALF DOUBLE, VERY LARGE BACK YARD. BEING SOLD STRICTLY AS IS, NO CERTIFICATIONS!
-
2005-08-05historical 86-char remark
Show marketing remark (86 chars)
ROOMY HALF DOUBLE, VERY LARGE BACK YARD. BEING SOLD STRICTLY AS IS, NO CERTIFICATIONS!
-
2005-07-22$55,000 86-char remark
Show marketing remark (86 chars)
ROOMY HALF DOUBLE, VERY LARGE BACK YARD. BEING SOLD STRICTLY AS IS, NO CERTIFICATIONS!
ⓘ Source: listings_history table (triggers on properties + properties_extension) + one-shot
backfill from property_details.listing_events for pre-trigger history.
Tax reassessment forecast NJ · Partial reset (capped growth)
- Current annual tax
- $2,174 · $181/mo
- Projected year-2 tax
- $2,643 · $220/mo
- Expected delta
- +$469/yr (+$39/mo · 21.6%)
ⓘ Screening estimate from a state-policy table — verify with the county assessor before closing.
Climate risk First Street
- Flood 1/10 Low FEMA zone X (unshaded) · 0% chance over 30 yrs
- Wildfire 5/10 Major
- Heat 7/10 Severe 7 d/yr ≥103°F today · 15 d/yr by 30 yrs out
- Wind 6/10 Major 71% chance of damaging wind over 30 yrs
- Air quality 3/10 Moderate 2 unhealthy d/yr today · 4 by 30 yrs out
Nearby sold comps map
Loading sold comps map…
Walkable amenities ~0.75 mi
Loading nearby amenities…
Taxation est. · year 1
- Rental income
- $20,632
- − Mortgage interest
- −$7,002
- − Property taxes
- −$2,174
- − Insurance
- −$625
- − Repairs & maintenance
- −$1,651
- − Management
- −$1,651
- − Depreciation
- −$3,636
- Taxable income
- $3,894
- Est. tax owed @ 24.0%
- −$935
- After-tax cash flow
- $4,700/yr
For passive investors: Depreciation is non-cash, so a rental often shows a tax loss while cash-flowing — sheltering income. Rental losses are passive: they offset passive income freely, and up to $25,000/yr can offset ordinary (W-2) income if you actively participate and your MAGI is under $100k (phasing out to $0 by $150k); unused losses carry forward. On sale, claimed depreciation is recaptured at up to 25%, and gains may owe capital-gains tax (a 1031 exchange can defer both). Figures are a year-1 estimate at your 24.0% rate — not tax advice; consult a CPA.
Schools (NCES district)
- District
- Millville School District
- NCES district ID
- 3410320
- Math proficiency
- 6% ▼ -11.00%
- Reading proficiency
- 28% ▲ 1.00%
- Median HH income
- $48,851
- Composite
- 15.23/100
- National rank
- #9338
- State rank
- #447 of 472 in NJ
Livability — Millville
- Score
- 63/100
- State rank
- #431
- US rank
- #15561
Category grades
Schools grade is shown separately in the Schools card above.
Census & demographics
- Census place
- Millville, NJ
- County
- Cumberland County · 80,266 people
- City population
- 35,228
- Metro
- Vineland-Bridgeton, NJ
- Population (ZIP)
- 35,228
- Household income
- $67,496
- Rent vs Own
- Severe rent burden
- 1761.0
Population outlook (Cumberland County) Hauer SSP2
- Today (2025)
- 152,743 people
- By 2030
- 150,373 · -1.6%
- By 2040
- 146,881 · -3.8%
- By 2050
- 142,653 · -6.6%
- By 2075
- 129,468 · -15.2%
- By 2100
- 107,456 · -29.6%
Race, ethnicity, and origin ACS 2023
- Neighborhood character
- Diverse neighborhood (Simpson 0.60)
- Race & ethnicity
- White 59% Hispanic / Latino 17% Black 15% Two or more races 11% Asian 2%
- Hispanic origin (detail)
- Mexican 4% Puerto Rican 10%
- Common ancestry
- Romanian 4% Lithuanian 2% Slovak 1%
- Foreign-born
- 7% · Canada
- Languages at home
- 85% English-only · Spanish 11% Other Indo-European 1% Other Asian/Pacific 1%
Political lean MEDSL · Cumberland
- 2024 margin
- Toss-up / Even · D 47.6% · R 51.3% · Other 1.1%
- 2008→2024 swing
- -25.4pp toward R · 2008: 21.6pp · 2024: -3.8pp
- All cycles
- 2024: R+3.8 2020: D+6.0 2016: D+5.3 2012: D+23.1 2008: D+21.6
Not yet ingested
- Civics
- —
Market trends
- HPI YoY
- ▼ -111.45%
- Current HPI
- 274.8011
- Rent YoY
- ▲ 1.94%
- Metro
- Vineland-Bridgeton, NJ
- State GDP YoY
- ▲ 2.05%
- F500 in state
- 34
Industry mix (Fortune 500 HQ in NJ)
| Industry | F500 HQs | Revenue |
|---|---|---|
| Consumer Goods | 3 | $31B |
|
||
| Pharmaceuticals | 2 | $153B |
|
||
| Technology | 2 | $21B |
|
||
| Insurance | 2 | $20B |
|
||
| Healthcare | 2 | $19B |
|
||
| Financial Services | 1 | $70B |
|
||
Price history
+127.3% since first listed6 events — show timeline
- 2026-06-05 Price Changed $125,000 BRIGHT MLS
- 2026-05-04 Listed $145,000 BRIGHT MLS
- 2005-09-28 Sold (Public Records) $53,000 Public Records
- 2005-09-26 Sold (MLS) $53,000 SJSRMLS
- 2005-08-05 Listing Removed — SJSRMLS
- 2005-07-22 Listed $55,000 SJSRMLS
Property tax history
+6.5%/yrLatest (2025): $2,174 · +3.3% YoY. Source: county tax records.
Cash-flow waterfall
monthlySold comps — $/sqft
last 12 mo · ≤1 miLoading sold comps…