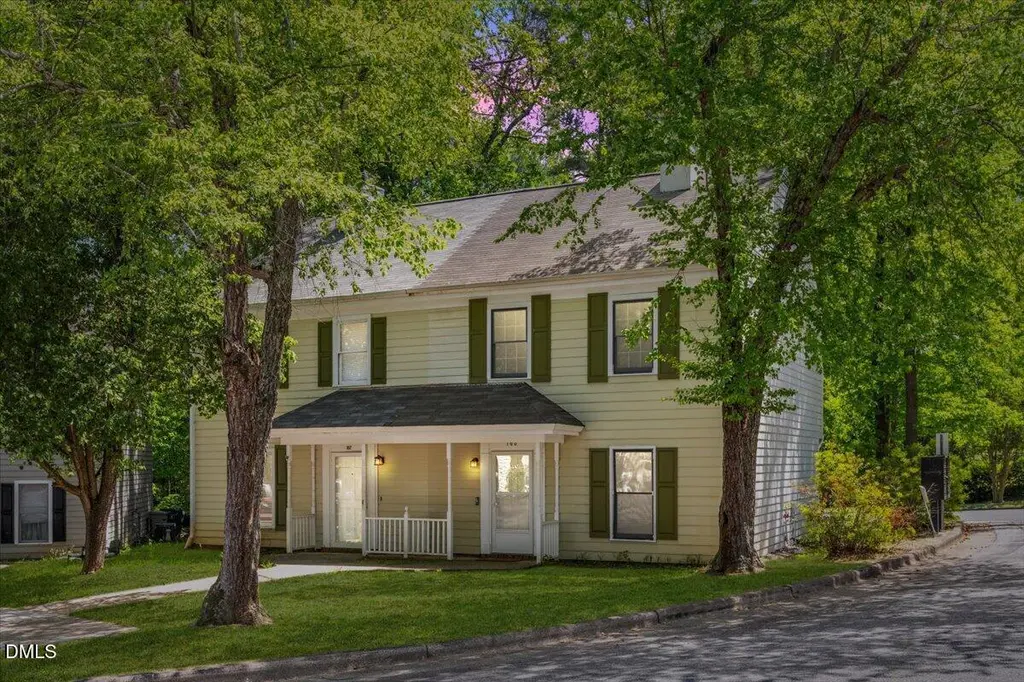
102 Rhum Pl · Garner, NC
Flood risk 1/10 · Minimal
- FEMA flood zone
- X (unshaded)
- Chance of flooding over 30 yrs
- 0.0%
- Est. flood insurance / yr
- $507 – $1,088
Fire risk 3/10 · Minor
- Est. fire insurance / yr
- $906 – $1,684
Heat risk 6/10 · Moderate
- Hot days now (above 105°F)
- 7 days/yr
- Hot days in 30 yrs
- 17 days/yr
Wind risk 6/10 · Moderate
- Chance of severe wind over 30 yrs
- 58.0%
Air-quality risk 2/10 · Minimal
- Unhealthy air days now
- 1 days/yr
- Unhealthy air days in 30 yrs
- 1 days/yr
Risk factors via First Street. Map © Google.
Why this score? — see what drove the D+ grade
The composite is a weighted blend of 9 inputs, each scored 0–100. Each bar is that input's sub-score; the figure is the points it added to the 100-point composite (weight × sub-score).
- ARV discount +15.0/15.0
- Cash flow +12.9/30.0
- Schools +4.9/10.0
- DSCR +3.9/10.0
- Livability +3.8/5.0
- 1% rule +3.3/10.0
- Rent growth +2.8/5.0
- Condition / age +2.5/5.0
- Appreciation +0.0/10.0
$210,000
🖨 Deal sheet (PDF) 📄 Offer letter ✓ Due diligence
Listing remarks
This beautiful 3 bedroom, 1.5 bathroom townhome in Garner, NC is central to everything you need!
Key facts
- $36 HOA
- 2 parking spots
- Built 1983
Property features AI
Finance
- HOA & community: Kirkwall Villas community association; Monthly association fee of $36.62 (fee covers none listed services)
Exterior
- Parking: 2 parking spaces (not open parking)
- Utilities: Public water; Public sewer
- Home design: Townhouse with two levels; Entry on slab foundation
- Construction: Masonite exterior; Shingle roof; Slab foundation; Built as a townhouse
- Exterior features: Publicly maintained road access; Zoned MF-A
Interior
- Bedrooms: 3 bedrooms
- Flooring: Laminate; Tile; Vinyl
- Bathrooms: 1 full bathroom; 1 half bathroom
- Heating & cooling: Central heating (forced air); Central air conditioning
- Interior features: Laminate, tile and vinyl flooring
Neighborhood map
What this means for you Summary
Snapshot
- This is a 3-bed/1.5-bath townhouse listed at $210k.
Deal economics
- At list price, monthly cash flow is $-16 ($-186/yr) — negative.
- To cash-flow at today's rent, offer at most $207k (1.3% below list).
- To meet the 1% rule (rent ≥ 1% of price), the offer needs to be $174k (17.3% below list).
- Recommended offer: $174k (17.3% below list) — sets the bar for 1% rule.
- Cap rate 6.2% vs local median 3.3% in Garner — top-decile yield for the area; either an underpriced asset or a hidden risk that comps aren't pricing in. Stress-test before assuming the spread holds.
Location & tenants
- Location reads 76/100 on livability (#35 in NC, #3,421 nationally) — a middle-class / working-renter tenant base. Strengths: housing A+, commute A-, cost of living A-; Watch: amenities D, crime F.
- Wake County Schools (suburban): math 52% / reading 60% proficiency, ranked #35 of 178 in NC (top 20%) — acceptable for families but not a draw, mixed tenant base, ~2y average lease.
- Zoned schools: Timber Drive Elementary (math 42% / reading 42%, grade F, #633 of 1,410 statewide, top 48%, 416 students, 62% FRL); East Garner Middle (math 23% / reading 33%, grade F, #360 of 475 statewide, top 77%, 1,186 students, 73% FRL); Garner High (math 32% / reading 56%, grade F, #367 of 535 statewide, top 69%, 1,683 students, 50% FRL) — zoned schools average 62% FRL vs 30% district-wide (31 pts higher); higher-poverty schools than district average — tighter screening recommended.
- Zoned-school proficiency averages 38% at this address vs 56% district-wide (-18 pts) — the specific schools serving this property underperform the Wake County Schools average; the district grade overstates school quality for this exact location.
- Market conditions: Rents rising (+1.1%/yr); 652 active listings in the ZIP; 14 comparable units currently listed for rent nearby; rentals at typical pace (median 23d on market — plan ~3-4 weeks tenant-placement turnaround); solid renter incomes; 15,249 units permitted in Wake County in 2024 (5,568 in 5+ unit buildings).
Forward outlook
- Local home prices are declining (-3.0%/yr); year-one equity from $1k of loan paydown is wiped out by about $6k of value loss. Plan a longer hold.
- Wake County population projected at +51% by 2050 — long-run rental-demand tailwind backs the buy-and-hold thesis.
Negotiation context
- It's been on market 16 days — a 2% lower offer ($207k) is reasonable based on typical stale-listing flexibility.
- 2 sale attempts with the ask held roughly flat each time — persistent listings suggest the price (not the market) is what's stuck; bring a comps-based counter.
- Current owner paid $80k; list at $210k implies a 162% gain — meaningful room to come down on a strong offer.
Risks & watch-outs
- Climate carrying-cost: major wind risk, 58% chance of damaging wind over 30y; extreme-heat days projected 7→17/yr by 2055 (HVAC capex compounding) — expect insurance premiums to compound above CPI over the hold.
Questions for the listing agent
- What do current leases actually rent for vs. the listed asking? Can we see a recent rent roll and the last 12 months of T-12 income?
- What does the HOA fee cover, when was the last increase, and are there any pending special assessments or reserve-fund shortfalls?
- Is there a deadline driving the sale (1031 exchange, divorce, estate, relocation)? That informs how much negotiation room exists.
- Schools are D-rated, which usually means shorter tenancies and higher turnover. Who's the typical renter profile here, and what's been the actual vacancy rate?
- Crime grade is F in this area — have there been break-ins, vandalism, or insurance claims at this property in the last 3 years? What carrier currently insures it and at what premium?
- The area grade is low — what's the realistic commute time and amenity access for the typical tenant pool here? Any planned neighborhood developments (good or bad) we should know about?
- What's the average days-on-market for RENTAL listings here right now (not sales)? A rising rental-DOM trend means longer vacancies and softer asking-rent achievability than the comps imply.
- What's the recent tenant-quality profile in this submarket — average credit score on applications, eviction rate, late-payment / NSF rate, and stable-employment percentage? A property-management company in the area should have these aggregated.
- How much new for-sale + rental construction is in the pipeline within 1–3 miles? Heavy new supply typically softens prices + rents 12–24 months out; constrained supply supports both.
Investment metrics
- 1% rule
- 0.83% ✗
- Cap rate
- 6.20%
- Cash-on-cash
- -0.32%
- DSCR
- 0.99
- GRM
- 10.1
CMA / ARV
- ARV (on-the-fly)
- $265,524
- Comps found
- 2
Show comp detail 2 sales within ~0.75 mi
| Address | Dist | Beds/Ba | Sqft | Sold | Price | $/sf | Match |
|---|---|---|---|---|---|---|---|
| 118 Rhum Pl | 0.04mi | 2/1.5 (-1) | 1,076 (-12%) | 4mo | $221,000 | $205 | 71 |
| 1442 Aversboro Rd Lot 7 | 0.14mi | 2/2.0 (-1) | 1,149 (-6%) | 13mo | $250,000 | $218 | 66 |
Match score weights: distance 35% · size 25% · config 20% · recency 20%. Top-matched comps best support the ARV.
Projected returns pro-forma
-3.0% appreciation · 1.15% rent growth · sell at horizon
- IRR
- -18.8%
- Equity multiple
- 0.35×
- Total profit
- $-38,203
- Equity at exit
- $31,312
- IRR
- -15.4%
- Equity multiple
- 0.20×
- Total profit
- $-47,138
- Equity at exit
- $18,157
Cash invested: $58,800 (down + closing). Projections, not guarantees.
Landlord ↔ Tenant lean methodology
- Overall (STATE)
- 85 Strongly Landlord-Friendly
- State North Carolina
- 85 Strongly Landlord-Friendly · R+3
- County
- — inherits STATE
- City
- — inherits STATE
ZIP-level market 27529
- Rents YoY
- 1.1%
- Active inventory
- 652
- Price-to-rent
- 10.1×
Monthly cashflow live
- Estimated rent
- $1,736 high interval (Pro) →
- Mortgage (P&I)
- −$1,101
- Tax from tax record
- −$162 /mo · $1,947/yr
- Insurance
- −$88
- HOA
- −$36
- Vacancy / Maint / Mgmt
- −$365
- Net cashflow
- $-16
Break-even live
Sensitivity live
| Price | -10% $103 | -5% $44 | +0% $-16 | +5% $-75 | +10% $-134 |
|---|---|---|---|---|---|
| Rent | -10% $-153 | -5% $-84 | +0% $-16 | +5% $53 | +10% $122 |
| Rate | -1.0pp $90 | -0.5pp $38 | base $-16 | +0.5pp $-70 | +1.0pp $-125 |
UW: 25.0% down · 7.5% · 30yr · 1.5% tax · 5.0% vac · 8.0% maint · 8.0% mgmt
Financing live
Cash to close
- Down payment
- $52,500
- Closing costs
- $6,300
- Reserves months
- —
- Total cash needed
- —
Loan-product check · same deal, 3 products live
Conventional
25% down · 7.5% · 30yr
- Down + closing
- —
- Monthly P&I
- —
- Monthly cashflow
- —
- DSCR
- —
- Eligible?
- —
Personal DTI + credit; lowest rate.
DSCR
20% down · 8.5% · 30yr
- Down + closing
- —
- Monthly P&I
- —
- Monthly cashflow
- —
- DSCR
- —
- Eligible?
- —
No personal income docs; deal must DSCR.
Hard money
10% down · 12.0% · 12mo
- Down + closing
- —
- Monthly P&I
- —
- Monthly cashflow
- —
- DSCR
- —
- Eligible?
- —
Short-term bridge; refi at stabilization.
Rent comps 14 comps
| Address | Beds | Baths | Sqft | Rent | $/sqft | DOM | Units | Dist |
|---|---|---|---|---|---|---|---|---|
| 1425 Aversboro Rd Garner, NC | 2.0–3.0 | 2.0 | 1262 | $1,900 | $1.51 | 16d | 2 | 0.20mi |
| 725 Heather Park Dr Garner, NC | 1.0–3.0 | 1.0–2.0 | 1012 | $1,560 | $1.54 | 3d | 14 | 0.41mi |
| 330 Kentucky Dr Garner, NC | 2.0 | 2.0 | 851 | $1,347 | $1.58 | 25d | 1 | 0.69mi |
| 102 Stowe Pl Unit B Garner, NC | 2.0 | 1.5 | 1008 | $1,375 | $1.36 | 6d | 1 | 0.70mi |
| 1105 Timber Dr Unit A Garner, NC | 3.0 | 1.5 | 1200 | $1,550 | $1.29 | 6d | 1 | 0.70mi |
| 104 Stowe Pl Unit A Garner, NC | 2.0 | 1.5 | 1100 | $1,395 | $1.27 | 25d | 1 | 0.72mi |
| 303 Kentucky Dr Garner, NC | 2.0 | 2.0 | 870 | $1,350 | $1.55 | 25d | 1 | 0.72mi |
| 302 Kentucky Dr Garner, NC | 2.0 | 2.0 | 870 | $1,375 | $1.58 | 23d | 1 | 0.75mi |
| 108 Barslund Ct Garner, NC | 2.0 | 2.0 | 851 | $1,347 | $1.58 | 23d | 1 | 0.80mi |
| 108 Barslund Ct Garner, NC | 2.0 | 2.0 | 851 | $1,347 | $1.58 | 25d | 1 | 0.80mi |
| 617 Springview Trl Garner, NC | 3.0 | 2.5 | 1489 | $2,180 | $1.46 | 25d | 1 | 0.98mi |
| 400 Evolve Dr Garner, NC | 1.0–3.0 | 1.0–2.0 | 990 | $1,964 | $1.98 | 3d | 19 | 1.35mi |
| 201 Johnson St Garner, NC | 1.0–2.0 | 1.0–1.5 | 800 | $1,250 | $1.56 | 16d | 2 | 1.44mi |
| 2000 Spring Dr Garner, NC | 1.0–2.0 | 1.0–1.5 | 850 | $1,475 | $1.74 | 25d | 1 | 1.46mi |
HOA detail
- Monthly dues
- $36 · $432/yr
Listing history 10 events
-
2026-05-08$210,000 Active
-
2026-03-24historical
-
2026-03-08price $219,999
-
2026-02-05price $224,950
-
2026-01-16price $224,999
-
2026-01-04$225,000 Active
-
1997-02-27soldstatus $80,000
-
1992-08-14soldstatus $51,000
-
1987-02-19soldstatus $14,500
-
1983-09-09soldstatus $47,000
ⓘ Source: listings_history table (triggers on properties + properties_extension) + one-shot
backfill from property_details.listing_events for pre-trigger history.
Tax reassessment forecast NC · Resets to sale price
- Current annual tax
- $1,947 · $162/mo
- Projected year-2 tax
- $1,947 · $162/mo
- Expected delta
- $0/yr ($0/mo · 0.0%)
ⓘ Screening estimate from a state-policy table — verify with the county assessor before closing.
Climate risk First Street
- Flood 1/10 Low FEMA zone X (unshaded) · 0% chance over 30 yrs
- Wildfire 3/10 Moderate
- Heat 6/10 Major 7 d/yr ≥105°F today · 17 d/yr by 30 yrs out
- Wind 6/10 Major 58% chance of damaging wind over 30 yrs
- Air quality 2/10 Low 1 unhealthy d/yr today · 1 by 30 yrs out
Nearby sold comps map
Loading sold comps map…
Walkable amenities ~0.75 mi
Loading nearby amenities…
Taxation est. · year 1
- Rental income
- $20,833
- − Mortgage interest
- −$11,763
- − Property taxes
- −$1,947
- − Insurance
- −$1,050
- − Repairs & maintenance
- −$1,667
- − Management
- −$1,667
- − HOA
- −$432
- − Depreciation
- −$6,109
- Taxable loss
- −$3,802
- Est. tax savings @ 24.0%
- +$912
- After-tax cash flow
- $726/yr
For passive investors: Depreciation is non-cash, so a rental often shows a tax loss while cash-flowing — sheltering income. Rental losses are passive: they offset passive income freely, and up to $25,000/yr can offset ordinary (W-2) income if you actively participate and your MAGI is under $100k (phasing out to $0 by $150k); unused losses carry forward. On sale, claimed depreciation is recaptured at up to 25%, and gains may owe capital-gains tax (a 1031 exchange can defer both). Figures are a year-1 estimate at your 24.0% rate — not tax advice; consult a CPA.
Schools (NCES district)
- District
- Wake County Schools
- NCES district ID
- 3704720
- Math proficiency
- 52% ▲ 2.00%
- Reading proficiency
- 60% ▲ 4.00%
- Median HH income
- $67,509
- Composite
- 49.41/100
- National rank
- #2010
- State rank
- #35 of 178 in NC
Livability — Garner
- Score
- 76/100
- State rank
- #35
- US rank
- #3421
Category grades
Schools grade is shown separately in the Schools card above.
Census & demographics
- Census place
- Garner, NC
- County
- Wake County · 1,216,256 people
- City population
- 55,242
- Metro
- Raleigh-Cary, NC
- Population (ZIP)
- 55,242
- Household income
- $85,716
- Rent vs Own
- Severe rent burden
- 1455.0
Population outlook (Wake County) Hauer SSP2
- Today (2025)
- 1,293,152 people
- By 2030
- 1,428,223 · +10.4%
- By 2040
- 1,698,188 · +31.3%
- By 2050
- 1,955,807 · +51.2%
- By 2075
- 2,520,273 · +94.9%
- By 2100
- 2,893,335 · +123.7%
Race, ethnicity, and origin ACS 2023
- Neighborhood character
- Diverse neighborhood (Simpson 0.61)
- Race & ethnicity
- White 56% Black 25% Hispanic / Latino 13% Two or more races 9% Asian 1%
- Hispanic origin (detail)
- Mexican 8% Puerto Rican 2%
- Common ancestry
- Lithuanian 3% Slovak 3% Italian 2%
- Foreign-born
- 8% · Canada
- Languages at home
- 87% English-only · Spanish 11% Other Indo-European 1%
Political lean MEDSL · Wake
- 2024 margin
- Strong D (+25.5) · D 61.9% · R 36.4% · Other 1.7%
- 2008→2024 swing
- +11.1pp toward D · 2008: 14.4pp · 2024: 25.5pp
- All cycles
- 2024: D+25.5 2020: D+26.4 2016: D+20.5 2012: D+10.2 2008: D+14.4
Not yet ingested
- Civics
- —
Market trends
- HPI YoY
- ▼ -241.30%
- Current HPI
- 238.8492
- Rent YoY
- ▲ 1.15%
- Metro
- Raleigh-Cary, NC
- State GDP YoY
- ▲ 3.28%
- F500 in state
- 26
Industry mix (Fortune 500 HQ in NC)
| Industry | F500 HQs | Revenue |
|---|---|---|
| Financial Services | 2 | $213B |
|
||
| Retail | 2 | $95B |
|
||
| Industrial Conglomerate | 1 | $38B |
|
||
| Metals / Steel | 1 | $35B |
|
||
| Utilities | 1 | $30B |
|
||
| Industrial Machinery | 1 | $19B |
|
||
Price history
+346.8% since first listed10 events — show timeline
- 2026-05-08 Listed $210,000 TMLS
- 2026-03-24 Listing Removed — TMLS
- 2026-03-08 Price Changed $219,999 TMLS
- 2026-02-05 Price Changed $224,950 TMLS
- 2026-01-16 Price Changed $224,999 TMLS
- 2026-01-04 Listed $225,000 TMLS
- 1997-02-27 Sold (Public Records) $80,000 Public Records
- 1992-08-14 Sold (Public Records) $51,000 Public Records
- 1987-02-19 Sold (Public Records) $14,500 Public Records
- 1983-09-09 Sold (Public Records) $47,000 Public Records
Property tax history
+5.9%/yrLatest (2025): $1,947 · +0.3% YoY. Source: county tax records.
Cash-flow waterfall
monthlySold comps — $/sqft
last 12 mo · ≤1 miLoading sold comps…