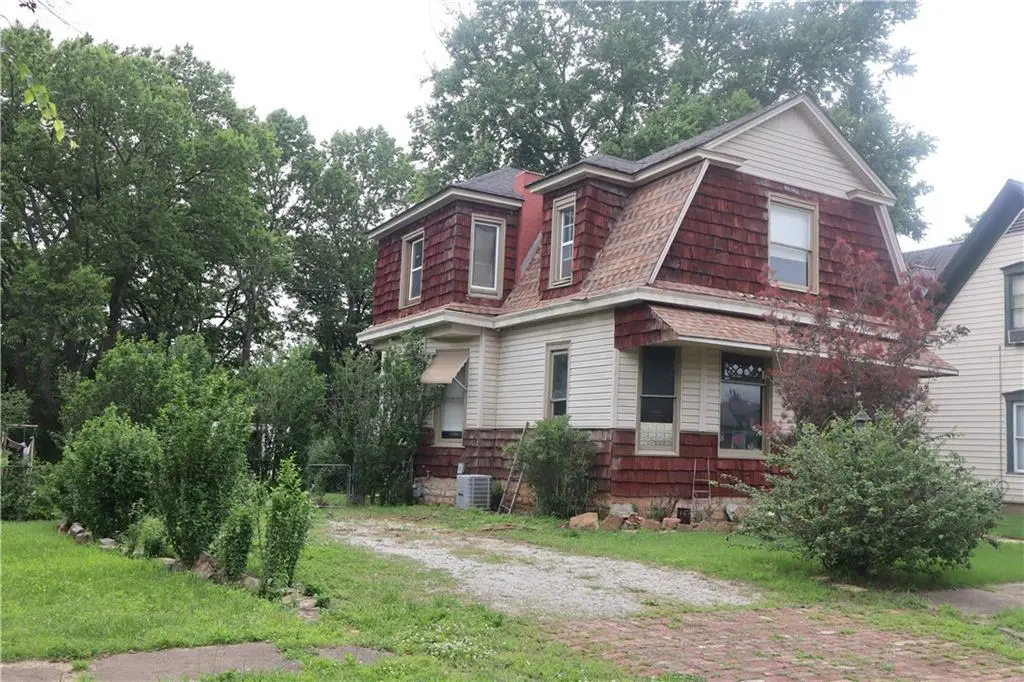
6 S Holbrook St · Fort Scott, KS
Flood risk 1/10 · Minimal
- FEMA flood zone
- X (unshaded)
- Chance of flooding over 30 yrs
- 0.0%
- Est. flood insurance / yr
- $473 – $860
Fire risk 5/10 · Moderate
- Est. fire insurance / yr
- $1,154 – $2,142
Heat risk 5/10 · Moderate
- Hot days now (above 109°F)
- 7 days/yr
- Hot days in 30 yrs
- 19 days/yr
Wind risk 2/10 · Minimal
- Chance of severe wind over 30 yrs
- 1.0%
Air-quality risk 2/10 · Minimal
- Unhealthy air days now
- 1 days/yr
- Unhealthy air days in 30 yrs
- 1 days/yr
Risk factors via First Street. Map © Google.
Why this score? — see what drove the C+ grade
The composite is a weighted blend of 9 inputs, each scored 0–100. Each bar is that input's sub-score; the figure is the points it added to the 100-point composite (weight × sub-score).
- Cash flow +28.4/30.0
- DSCR +10.0/10.0
- 1% rule +7.5/10.0
- ARV discount +7.5/15.0
- Livability +3.3/5.0
- Rent growth +2.5/5.0
- Condition / age +2.5/5.0
- Schools +2.0/10.0
- Appreciation +0.0/10.0
$95,000
🖨 Deal sheet 📄 Offer letter ✓ Due diligence
Listing remarks
Investor Special with Great Bones! Bring your vision and creativity to restore this charming home to its full potential. With the possibility of 4 bedrooms and 2 full bathrooms, this property offers plenty of space and opportunity for renovation. Filled with unique character and old-home charm, it features the timeless details that make historic homes so appealing. Whether you're looking for your next investment project, a fix-and-flip opportunity, or a home to customize and make your own, this property is ready for a new chapter. This home is selling "as is". Don't miss the chance to transform this diamond in the rough into something truly special!
Key facts
- 9,147 sq ft lot
- Built 1900
- Listed 12 days
Property features AI
Finance
- Other: Directions available to the property
- HOA & community: No association fees
Exterior
- Parking: Other parking type
- Utilities: Public water; Public sewer
- Home design: Single-family residential; Frame construction; Composition roof; Above-grade living area about 2,324 (public records); Facing/entry details not provided
- Construction: Frame construction; Composition roof; Home over 100 years old
- Exterior features: Lot approximately 0.21 acres (75 x 120)
Interior
- Kitchen: Kitchen; Breakfast room adjacent to the kitchen
- Bedrooms: 3 bedrooms (primarily on the second floor)
- Flooring: Carpet in some upstairs bedrooms
- Bathrooms: 2 full bathrooms
- Heating & cooling: Forced air heating; Electric cooling
- Interior features: Full walk-out basement; 2-story floor plan
Neighborhood map
What this means for you Summary
Snapshot
- This is a 3-bed/1.5-bath single-family listed at $95k.
Deal economics
- At list price, monthly cash flow is $308 ($4k/yr) — positive.
- The deal already cash-flows at list — no discount required.
- Meets the 1% rule at list price ($1k rent vs $95k).
- Cap rate 10.2% vs local median 4.9% in Fort Scott — top-decile yield for the area; either an underpriced asset or a hidden risk that comps aren't pricing in. Stress-test before assuming the spread holds.
Location & tenants
- Location reads 66/100 on livability (#259 in KS) — a middle-class / working-renter tenant base. Strengths: cost of living A+, health & safety A+, housing A; Watch: schools D, amenities F, commute F.
- Fort Scott (town): math 19% / reading 28% proficiency, ranked #150 of 169 in KS (top 89%) — low school quality limits family demand, transient renter base, plan for 1-2y turnover.
- Market conditions: 70 active listings in the ZIP; 5 units permitted in Bourbon County in 2024 (0 in 5+ unit buildings).
Forward outlook
- Local home prices are declining (-3.0%/yr); year-one equity from $657 of loan paydown is wiped out by about $3k of value loss. Plan a longer hold.
- Bourbon County population projected at -21% by 2050 — secular population decline; favor cash flow + early exit over multi-decade hold.
- At projected returns (-3.0% appreciation + 3.0% rent growth), your $27k cash investment doubles in ~9 years — after that, you're playing with house money.
Negotiation context
- Only 12 days on market — expect competitive offers; lowballing is unlikely to land.
- 6 sale attempts since 7y ago; this cycle's ask has dropped $5k (5%) from the opening price — seller is motivated, your offer sets the floor, not the list.
- Current owner paid $54k; list at $95k implies a 76% gain — meaningful room to come down on a strong offer.
Risks & watch-outs
- Watch-outs: built in 1900 — expect roof / HVAC / electrical / plumbing capex.
- Climate carrying-cost: moderate wildfire risk; extreme-heat days projected 7→19/yr by 2055 (HVAC capex compounding) — expect insurance premiums to compound above CPI over the hold.
Questions for the listing agent
- Built in 1900 — when were the roof, HVAC, electrical panel, plumbing, and water heater last replaced?
- Is there a deadline driving the sale (1031 exchange, divorce, estate, relocation)? That informs how much negotiation room exists.
- Schools are D-rated, which usually means shorter tenancies and higher turnover. Who's the typical renter profile here, and what's been the actual vacancy rate?
- What's the average days-on-market for RENTAL listings here right now (not sales)? A rising rental-DOM trend means longer vacancies and softer asking-rent achievability than the comps imply.
- What's the recent tenant-quality profile in this submarket — average credit score on applications, eviction rate, late-payment / NSF rate, and stable-employment percentage? A property-management company in the area should have these aggregated.
- How much new for-sale + rental construction is in the pipeline within 1–3 miles? Heavy new supply typically softens prices + rents 12–24 months out; constrained supply supports both.
Investment metrics
- 1% rule
- 1.25% ✓
- Cap rate
- 10.19%
- Cash-on-cash
- 13.90%
- DSCR
- 1.62
- GRM
- 6.7
CMA / ARV
- ARV (on-the-fly)
- $218,456
- Comps found
- 4
Show comp detail 4 sales within ~0.75 mi
| Address | Dist | Beds/Ba | Sqft | Sold | Price | $/sf | Match |
|---|---|---|---|---|---|---|---|
| 12 S Eddy St | 0.06mi | 4/2.0 (+1) | 2,108 (-9%) | 0mo | $199,000 | $94 | 74 |
| 107 N Eddy St | 0.15mi | 4/3.0 (+1) | 2,589 (+11%) | 1mo | $95,000 | $37 | 62 |
| 111 N Eddy St | 0.15mi | 4/2.0 (+1) | 1,979 (-15%) | 23mo | $50,000 | $25 | 42 |
| 739 S National Ave | 0.65mi | 4/3.0 (+1) | 1,992 (-14%) | 13mo | $240,000 | $120 | 24 |
Match score weights: distance 35% · size 25% · config 20% · recency 20%. Top-matched comps best support the ARV.
Projected returns pro-forma
-3.0% appreciation · 3.0% rent growth · sell at horizon
- IRR
- 4.1%
- Equity multiple
- 1.16×
- Total profit
- $4,237
- Equity at exit
- $14,165
- IRR
- 13.6%
- Equity multiple
- 2.09×
- Total profit
- $28,974
- Equity at exit
- $8,214
Cash invested: $26,600 (down + closing). Projections, not guarantees.
Landlord ↔ Tenant lean methodology
- Overall (STATE)
- 83 Strongly Landlord-Friendly
- State Kansas
- 83 Strongly Landlord-Friendly · R+10
- County
- — inherits STATE
- City
- — inherits STATE
ZIP-level market 66701
- Home prices YoY
- -10.4%
- Active inventory
- 70
- Price-to-rent
- 6.7×
Monthly cashflow live
- Estimated rent
- $1,188 medium interval (Pro) →
- Mortgage (P&I)
- −$498
- Tax from tax record
- −$93 /mo · $1,114/yr
- Insurance
- −$40
- HOA
- −$0
- Vacancy / Maint / Mgmt
- −$250
- Net cashflow
- $308
Break-even live
UW: 25.0% down · 7.5% · 30yr · 1.5% tax · 5.0% vac · 8.0% maint · 8.0% mgmt
Financing live
Cash to close
- Down payment
- $23,750
- Closing costs
- $2,850
- Reserves months
- —
- Total cash needed
- —
Loan-product check · same deal, 3 products live
Conventional
25% down · 7.5% · 30yr
- Down + closing
- —
- Monthly P&I
- —
- Monthly cashflow
- —
- DSCR
- —
- Eligible?
- —
Personal DTI + credit; lowest rate.
DSCR
20% down · 8.5% · 30yr
- Down + closing
- —
- Monthly P&I
- —
- Monthly cashflow
- —
- DSCR
- —
- Eligible?
- —
No personal income docs; deal must DSCR.
Hard money
10% down · 12.0% · 12mo
- Down + closing
- —
- Monthly P&I
- —
- Monthly cashflow
- —
- DSCR
- —
- Eligible?
- —
Short-term bridge; refi at stabilization.
Listing history 10 events
-
2026-06-18days on market $95,000 Active 12 DOM
-
2026-06-17days on market $95,000 Active 11 DOM
-
2026-06-16days on market $95,000 Active 10 DOM
-
2026-06-15days on market $95,000 Active 9 DOM
-
2026-06-13pricedays on market $95,000 Active 7 DOM
-
2026-06-12days on market $100,000 Active 6 DOM
-
2026-06-09days on market $100,000 Active 3 DOM
-
2026-06-08days on market $100,000 Active 2 DOM
-
2026-06-07remarks 657-char remark
-
2026-06-07$100,000 Active 1 DOM
ⓘ Source: listings_history table (triggers on properties + properties_extension) + one-shot
backfill from property_details.listing_events for pre-trigger history.
Tax reassessment forecast KS · Resets to sale price
- Current annual tax
- $1,114 · $93/mo
- Projected year-2 tax
- $1,340 · $112/mo
- Expected delta
- +$226/yr (+$19/mo · 20.3%)
ⓘ Screening estimate from a state-policy table — verify with the county assessor before closing.
Climate risk First Street
- Flood 1/10 Low FEMA zone X (unshaded) · 0% chance over 30 yrs
- Wildfire 5/10 Major
- Heat 5/10 Major 7 d/yr ≥109°F today · 19 d/yr by 30 yrs out
- Wind 2/10 Low 100% chance of damaging wind over 30 yrs
- Air quality 2/10 Low 1 unhealthy d/yr today · 1 by 30 yrs out
Nearby sold comps map
Loading sold comps map…
Walkable amenities ~0.75 mi
Loading nearby amenities…
Taxation est. · year 1
- Rental income
- $14,260
- − Mortgage interest
- −$5,321
- − Property taxes
- −$1,114
- − Insurance
- −$475
- − Repairs & maintenance
- −$1,141
- − Management
- −$1,141
- − Depreciation
- −$2,764
- Taxable income
- $2,305
- Est. tax owed @ 24.0%
- −$553
- After-tax cash flow
- $3,145/yr
For passive investors: Depreciation is non-cash, so a rental often shows a tax loss while cash-flowing — sheltering income. Rental losses are passive: they offset passive income freely, and up to $25,000/yr can offset ordinary (W-2) income if you actively participate and your MAGI is under $100k (phasing out to $0 by $150k); unused losses carry forward. On sale, claimed depreciation is recaptured at up to 25%, and gains may owe capital-gains tax (a 1031 exchange can defer both). Figures are a year-1 estimate at your 24.0% rate — not tax advice; consult a CPA.
Schools (NCES district)
- District
- Fort Scott
- NCES district ID
- 2006180
- Math proficiency
- 19% ▼ -3.00%
- Reading proficiency
- 28% ▬ 0.00%
- Median HH income
- $38,034
- Composite
- 19.64/100
- National rank
- #8741
- State rank
- #150 of 169 in KS
Livability — Fort Scott
- Score
- 66/100
- State rank
- #259
- US rank
- #11422
Category grades
Schools grade is shown separately in the Schools card above.
Census & demographics
- Census place
- Fort Scott, KS
- Population (ZIP)
- 11,075
Population outlook (Bourbon County) Hauer SSP2
- Today (2025)
- 13,761 people
- By 2030
- 13,139 · -4.5%
- By 2040
- 11,920 · -13.4%
- By 2050
- 10,892 · -20.8%
- By 2075
- 8,645 · -37.2%
- By 2100
- 6,751 · -50.9%
Race, ethnicity, and origin ACS 2023
- Neighborhood character
- Predominantly White (89%)
- Race & ethnicity
- White 89% Two or more races 5% Hispanic / Latino 3% Black 2%
- Common ancestry
- Lithuanian 2% Serbian 2% Slovak 2%
- Foreign-born
- 1%
- Languages at home
- 97% English-only · Spanish 1% Other Asian/Pacific 1% German/W. Germanic 1%
Political lean MEDSL · Bourbon
- 2024 margin
- Solid R (+54.2) · D 22.0% · R 76.1% · Other 1.9%
- 2008→2024 swing
- -26.9pp toward R · 2008: -27.2pp · 2024: -54.2pp
- All cycles
- 2024: R+54.2 2020: R+52.0 2016: R+50.8 2012: R+33.9 2008: R+27.2
Not yet ingested
- Civics
- —
Market trends
- HPI YoY
- ▼ -20.03%
- Current HPI
- 172.2531
- Rent YoY
- —
- Metro
- —
- State GDP YoY
- —
- F500 in state
- 0
Price history
+135.3% since first listed20 events — show timeline
- 2026-06-06 Listed $100,000 Heartland MLS as Distributed by MLS Grid
- 2023-11-27 Relisted — Heartland MLS as Distributed by MLS Grid
- 2023-11-27 Listing Removed — Heartland MLS as Distributed by MLS Grid
- 2023-10-23 Pending — Heartland MLS as Distributed by MLS Grid
- 2023-09-28 Listing Removed — Heartland MLS as Distributed by MLS Grid
- 2023-09-28 Listed $118,000 Heartland MLS as Distributed by MLS Grid
- 2023-09-08 Price Changed $118,000 Heartland MLS as Distributed by MLS Grid
- 2023-09-05 Listed $129,900 Heartland MLS as Distributed by MLS Grid
- 2023-08-30 Listing Removed — Heartland MLS as Distributed by MLS Grid
- 2023-08-26 Price Changed $149,900 Heartland MLS as Distributed by MLS Grid
- 2023-08-26 Price Changed $1,499,000 Heartland MLS as Distributed by MLS Grid
- 2023-07-10 Price Changed $129,900 Heartland MLS as Distributed by MLS Grid
- 2023-07-06 Price Changed $140,000 Heartland MLS as Distributed by MLS Grid
- 2023-06-16 Listed $155,000 Heartland MLS as Distributed by MLS Grid
- 2019-11-20 Sold (MLS) — Heartland MLS as Distributed by MLS Grid
- 2019-04-17 Listed $48,000 Heartland MLS as Distributed by MLS Grid
- 2016-12-01 Sold (Public Records) — Public Records
- 2006-02-01 Sold (Public Records) $54,000 Public Records
- 2004-03-01 Sold (Public Records) $37,500 Public Records
- 1988-06-01 Sold (Public Records) $42,500 Public Records
Property tax history
-0.5%/yrLatest (2025): $1,114 · -3.0% YoY. Source: county tax records.
Cash-flow waterfall
monthlySold comps — $/sqft
last 12 mo · ≤1 miLoading sold comps…