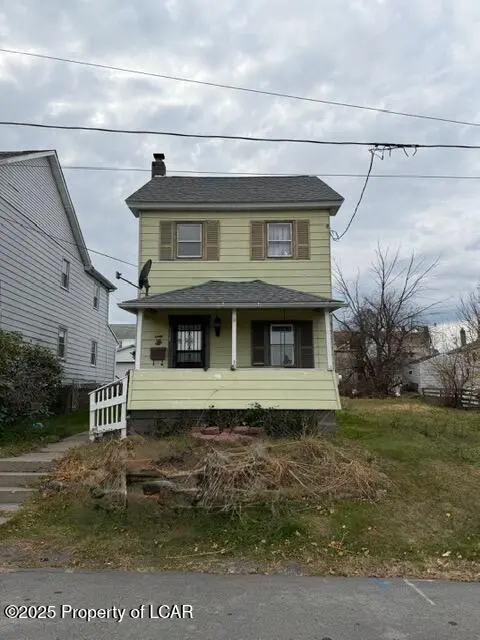
924 Pine St · Freeland, PA
Flood risk 1/10 · Minimal
- FEMA flood zone
- X (unshaded)
- Chance of flooding over 30 yrs
- 0.0%
- Est. flood insurance / yr
- $507 – $1,088
Fire risk 3/10 · Minor
- Est. fire insurance / yr
- $511 – $949
Heat risk 2/10 · Minimal
- Hot days now (above 90°F)
- 7 days/yr
- Hot days in 30 yrs
- 16 days/yr
Wind risk 3/10 · Minor
- Chance of severe wind over 30 yrs
- 6.0%
Air-quality risk 2/10 · Minimal
- Unhealthy air days now
- 1 days/yr
- Unhealthy air days in 30 yrs
- 2 days/yr
Risk factors via First Street. Map © Google.
Why this score? — see what drove the B- grade
The composite is a weighted blend of 9 inputs, each scored 0–100. Each bar is that input's sub-score; the figure is the points it added to the 100-point composite (weight × sub-score).
- Cash flow +25.3/30.0
- Appreciation +10.0/10.0
- ARV discount +9.5/15.0
- DSCR +8.3/10.0
- 1% rule +6.2/10.0
- Livability +3.1/5.0
- Rent growth +2.5/5.0
- Condition / age +2.5/5.0
- Schools +2.0/10.0
$129,000
🖨 Deal sheet (PDF) 📄 Offer letter ✓ Due diligence
Listing remarks MLS
Cutie and cozy single home in Freeland. Move-in ready. Don't miss your chance to own this 2-story home with an ideal Freeland location. Convenient to plenty of shopping and dining options. water heater, and roof approximately 5 years old. Bonus/Storage Room in attic with heat not included in sqft. Directions: Rt 309 turn onto East Butler Drive toward Freeland, turn left onto Center Str
Key facts
- Bonus storage room
- Water heater
- Freeland location
Tags
Neighborhood map
What this means for you Summary
Snapshot
- This is a 2-bed/2.0-bath single-family listed at $129k.
Deal economics
- At list price, monthly cash flow is $293 ($4k/yr) — positive.
- The deal already cash-flows at list — no discount required.
- Meets the 1% rule at list price ($1k rent vs $129k).
- Recommended offer: $114k (12.0% below list) — sets the bar for market timing.
- Cap rate 9.0% vs local median 6.3% in Freeland — top-decile yield for the area; either an underpriced asset or a hidden risk that comps aren't pricing in. Stress-test before assuming the spread holds.
Location & tenants
- Location reads 61/100 on livability (#1,409 in PA) — a middle-class / working-renter tenant base. Strengths: cost of living A+, crime A, housing A-; Watch: schools F, amenities F, commute F.
- Hazleton Area SD (suburban): math 18% / reading 30% proficiency, ranked #476 of 539 in PA (top 88%) — low school quality limits family demand, transient renter base, plan for 1-2y turnover.
- Market conditions: 43 active listings in the ZIP; 1 comparable units currently listed for rent nearby; 349 units permitted in Luzerne County in 2024 (16 in 5+ unit buildings).
Forward outlook
- In year one you build about $14k of equity ($892 loan paydown + $13k appreciation (10.0% local appreciation)).
- Luzerne County population projected at +4% by 2050 — modest demand growth; plan on rents tracking national, not racing it.
- At projected returns (10.0% appreciation + 3.0% rent growth), your $36k cash investment doubles in ~2 years — after that, you're playing with house money.
- By year 3, paydown + projected appreciation supports a ~$35k cash-out refi (75% LTV) — recoverable capital for the next deal without selling this one.
Negotiation context
- It's been on market 224 days — a 12% lower offer ($114k) is reasonable based on typical stale-listing flexibility.
- 4 sale attempts since 3y ago with the ask held roughly flat each time — persistent listings suggest the price (not the market) is what's stuck; bring a comps-based counter.
- Current owner paid $65k; list at $129k implies a 98% gain — meaningful room to come down on a strong offer.
Risks & watch-outs
- Watch-outs: built in 1930 — expect roof / HVAC / electrical / plumbing capex.
Questions for the listing agent
- It's been on market 224 days. Have you received any prior offers? Is the seller open to a 12% concession, seller financing, or rate buy-down credit?
- Built in 1930 — when were the roof, HVAC, electrical panel, plumbing, and water heater last replaced?
- Why hasn't it sold? Are there any deal-killer items the seller is aware of (foundation, flood, title, zoning, code violations)?
- Is there a deadline driving the sale (1031 exchange, divorce, estate, relocation)? That informs how much negotiation room exists.
- Schools are F-rated, which usually means shorter tenancies and higher turnover. Who's the typical renter profile here, and what's been the actual vacancy rate?
- What's the average days-on-market for RENTAL listings here right now (not sales)? A rising rental-DOM trend means longer vacancies and softer asking-rent achievability than the comps imply.
- What's the recent tenant-quality profile in this submarket — average credit score on applications, eviction rate, late-payment / NSF rate, and stable-employment percentage? A property-management company in the area should have these aggregated.
- How much new for-sale + rental construction is in the pipeline within 1–3 miles? Heavy new supply typically softens prices + rents 12–24 months out; constrained supply supports both.
Investment metrics
- 1% rule
- 1.12% ✓
- Cap rate
- 9.02%
- Cash-on-cash
- 9.73%
- DSCR
- 1.43
- GRM
- 7.4
CMA / ARV
- ARV (median comp)
- $135,022
- List price
- $129,000
- Delta
- -4.46%
- Verdict
- FAIR
- Comps
- 20 within 1.0 mi
Show comp detail 12 sales within ~0.75 mi
| Address | Dist | Beds/Ba | Sqft | Sold | Price | $/sf | Match |
|---|---|---|---|---|---|---|---|
| 957 Chestnut St | 0.27mi | 2/1.0 | 1,489 (+5%) | 0mo | $73,825 | $50 | 74 |
| 909 Birkbeck St | 0.14mi | 3/1.0 (+1) | 1,320 (-7%) | 0mo | $110,000 | $83 | 73 |
| 635 Vine St | 0.34mi | 3/1.5 (+1) | 1,438 (+2%) | 3mo | $145,000 | $101 | 72 |
| 149 Alvin St | 0.41mi | 2/1.0 | 1,392 (-2%) | 11mo | $70,000 | $50 | 65 |
| 169 Alvin St | 0.41mi | 3/1.0 (+1) | 1,392 (-2%) | 5mo | $189,900 | $136 | 65 |
| 710 Walnut St St | 0.13mi | 3/1.0 (+1) | 1,260 (-11%) | 8mo | $105,000 | $83 | 60 |
| 611 Washington St | 0.22mi | 3/1.0 (+1) | 1,248 (-12%) | 3mo | $119,900 | $96 | 59 |
| 942 Burton St | 0.26mi | 3/1.0 (+1) | 1,260 (-11%) | 3mo | $75,000 | $60 | 58 |
| 340 Crescent Rd | 0.48mi | 2/2.0 | 1,300 (-8%) | 9mo | $237,000 | $182 | 57 |
| 505 Cedar St | 0.45mi | 3/1.5 (+1) | 1,504 (+6%) | 6mo | $212,500 | $141 | 57 |
| 640 Ridge St | 0.25mi | 3/1.0 (+1) | 1,209 (-15%) | 1mo | $160,000 | $132 | 54 |
| 714 Ingham St | 0.34mi | 3/1.0 (+1) | 1,248 (-12%) | 2mo | $95,000 | $76 | 53 |
Match score weights: distance 35% · size 25% · config 20% · recency 20%. Top-matched comps best support the ARV.
Projected returns pro-forma
10.0% appreciation · 3.0% rent growth · sell at horizon
- IRR
- 31.4%
- Equity multiple
- 3.46×
- Total profit
- $88,909
- Equity at exit
- $116,213
- IRR
- 27.1%
- Equity multiple
- 7.84×
- Total profit
- $247,149
- Equity at exit
- $250,619
Cash invested: $36,120 (down + closing). Projections, not guarantees.
Landlord ↔ Tenant lean methodology
- Overall (STATE)
- 62 Landlord-Friendly
- State Pennsylvania
- 62 Landlord-Friendly · EVEN
- County
- — inherits STATE
- City
- — inherits STATE
ZIP-level market 18224
- Home prices YoY
- 9.2%
- Active inventory
- 43
- Price-to-rent
- 7.4×
Monthly cashflow live
- Estimated rent
- $1,450 medium interval (Pro) →
- Mortgage (P&I)
- −$676
- Tax from tax record
- −$122 /mo · $1,468/yr
- Insurance
- −$54
- HOA
- −$0
- Vacancy / Maint / Mgmt
- −$304
- Net cashflow
- $293
Break-even live
Sensitivity live
| Price | -10% $366 | -5% $329 | +0% $293 | +5% $256 | +10% $220 |
|---|---|---|---|---|---|
| Rent | -10% $178 | -5% $236 | +0% $293 | +5% $350 | +10% $407 |
| Rate | -1.0pp $358 | -0.5pp $326 | base $293 | +0.5pp $259 | +1.0pp $225 |
UW: 25.0% down · 7.5% · 30yr · 1.5% tax · 5.0% vac · 8.0% maint · 8.0% mgmt
Financing live
Cash to close
- Down payment
- $32,250
- Closing costs
- $3,870
- Reserves months
- —
- Total cash needed
- —
Loan-product check · same deal, 3 products live
Conventional
25% down · 7.5% · 30yr
- Down + closing
- —
- Monthly P&I
- —
- Monthly cashflow
- —
- DSCR
- —
- Eligible?
- —
Personal DTI + credit; lowest rate.
DSCR
20% down · 8.5% · 30yr
- Down + closing
- —
- Monthly P&I
- —
- Monthly cashflow
- —
- DSCR
- —
- Eligible?
- —
No personal income docs; deal must DSCR.
Hard money
10% down · 12.0% · 12mo
- Down + closing
- —
- Monthly P&I
- —
- Monthly cashflow
- —
- DSCR
- —
- Eligible?
- —
Short-term bridge; refi at stabilization.
Rent comps 1 comps
| Address | Beds | Baths | Sqft | Rent | $/sqft | DOM | Units | Dist |
|---|---|---|---|---|---|---|---|---|
| 109 Terrace Rd Freeland, PA | 3.0 | 1.0 | 1150 | $1,450 | $1.26 | 22d | 1 | 0.65mi |
Listing history 28 events
-
2026-06-19days on market $129,000 Active 224 DOM
-
2026-06-18days on market $129,000 Active 223 DOM
-
2026-06-17days on market $129,000 Active 222 DOM
-
2026-06-16days on market $129,000 Active 221 DOM
-
2026-06-15days on market $129,000 Active 220 DOM
-
2026-06-14days on market $129,000 Active 218 DOM
-
2026-06-12days on market $129,000 Active 217 DOM
-
2026-06-09days on market $129,000 Active 214 DOM
-
2026-06-08days on market $129,000 Active 213 DOM
-
2026-06-07days on market $129,000 Active 212 DOM
-
2026-06-02days on market $129,000 Active 207 DOM
-
2026-06-01days on market $129,000 Active 206 DOM
-
2026-05-31days on market $129,000 Active 205 DOM
-
2026-05-30days on market $129,000 Active 204 DOM
-
2026-03-13price $129,000 388-char remark
Show marketing remark (388 chars)
Cutie and cozy single home in Freeland. Move-in ready. Don't miss your chance to own this 2-story home with an ideal Freeland location. Convenient to plenty of shopping and dining options. water heater, and roof approximately 5 years old. Bonus/Storage Room in attic with heat not included in sqft. Directions: Rt 309 turn onto East Butler Drive toward Freeland, turn left onto Center Str
-
2025-11-07$135,000 Active 388-char remark
Show marketing remark (388 chars)
Cutie and cozy single home in Freeland. Move-in ready. Don't miss your chance to own this 2-story home with an ideal Freeland location. Convenient to plenty of shopping and dining options. water heater, and roof approximately 5 years old. Bonus/Storage Room in attic with heat not included in sqft. Directions: Rt 309 turn onto East Butler Drive toward Freeland, turn left onto Center Str
-
2025-08-12price $129,900
-
2024-02-08soldstatus $65,000 Closed
-
2024-02-08soldstatus $65,000
-
2024-01-09status Pending
-
2024-01-05status Active
-
2024-01-05price $80,000
-
2023-12-22historical
-
2023-12-14price $85,000
-
2023-12-14status Active
-
2023-10-16status Pending
-
2023-10-13price $92,900
-
2023-09-13$100,000 Active
ⓘ Source: listings_history table (triggers on properties + properties_extension) + one-shot
backfill from property_details.listing_events for pre-trigger history.
Tax reassessment forecast PA · Partial reset (capped growth)
- Current annual tax
- $1,468 · $122/mo
- Projected year-2 tax
- $1,753 · $146/mo
- Expected delta
- +$285/yr (+$24/mo · 19.4%)
ⓘ Screening estimate from a state-policy table — verify with the county assessor before closing.
Climate risk First Street
- Flood 1/10 Low FEMA zone X (unshaded) · 0% chance over 30 yrs
- Wildfire 3/10 Moderate
- Heat 2/10 Low 7 d/yr ≥90°F today · 16 d/yr by 30 yrs out
- Wind 3/10 Moderate 6% chance of damaging wind over 30 yrs
- Air quality 2/10 Low 1 unhealthy d/yr today · 2 by 30 yrs out
Nearby sold comps map
Loading sold comps map…
Walkable amenities ~0.75 mi
Loading nearby amenities…
Taxation est. · year 1
- Rental income
- $17,400
- − Mortgage interest
- −$7,226
- − Property taxes
- −$1,468
- − Insurance
- −$645
- − Repairs & maintenance
- −$1,392
- − Management
- −$1,392
- − Depreciation
- −$3,753
- Taxable income
- $1,524
- Est. tax owed @ 24.0%
- −$366
- After-tax cash flow
- $3,149/yr
For passive investors: Depreciation is non-cash, so a rental often shows a tax loss while cash-flowing — sheltering income. Rental losses are passive: they offset passive income freely, and up to $25,000/yr can offset ordinary (W-2) income if you actively participate and your MAGI is under $100k (phasing out to $0 by $150k); unused losses carry forward. On sale, claimed depreciation is recaptured at up to 25%, and gains may owe capital-gains tax (a 1031 exchange can defer both). Figures are a year-1 estimate at your 24.0% rate — not tax advice; consult a CPA.
Schools (NCES district)
- District
- Hazleton Area SD
- NCES district ID
- 4211700
- Math proficiency
- 18% ▼ -3.00%
- Reading proficiency
- 30% ▼ -15.00%
- Median HH income
- $42,247
- Composite
- 20.44/100
- National rank
- #8582
- State rank
- #476 of 539 in PA
Livability — Freeland
- Score
- 61/100
- State rank
- #1409
- US rank
- #17813
Category grades
Schools grade is shown separately in the Schools card above.
Census & demographics
- Census place
- Freeland, PA
- City population
- 5,954
- Population (ZIP)
- 5,954
Population outlook (Luzerne County) Hauer SSP2
- Today (2025)
- 319,505 people
- By 2030
- 319,943 · +0.1%
- By 2040
- 322,643 · +1.0%
- By 2050
- 330,817 · +3.5%
- By 2075
- 379,145 · +18.7%
- By 2100
- 431,908 · +35.2%
Race, ethnicity, and origin ACS 2023
- Neighborhood character
- Predominantly White (85%)
- Race & ethnicity
- White 85% Hispanic / Latino 12% Two or more races 6%
- Hispanic origin (detail)
- Puerto Rican 8% Dominican 3%
- Common ancestry
- Romanian 13% Scotch-Irish 4% Iranian 2%
- Foreign-born
- 3% · Canada
- Languages at home
- 87% English-only · Spanish 10% Russian/Polish/Slavic 1%
Political lean MEDSL · Luzerne
- 2024 margin
- R (+19.2) · D 40.0% · R 59.2%
- 2008→2024 swing
- -27.6pp toward R · 2008: 8.4pp · 2024: -19.2pp
- All cycles
- 2024: R+19.2 2020: R+14.4 2016: R+19.6 2012: D+4.8 2008: D+8.4
Not yet ingested
- Civics
- —
Market trends
- HPI YoY
- ▲ 22.89%
- Current HPI
- 270.8055
- Rent YoY
- —
- Metro
- —
- State GDP YoY
- ▲ 1.68%
- F500 in state
- 34
Industry mix (Fortune 500 HQ in PA)
| Industry | F500 HQs | Revenue |
|---|---|---|
| Healthcare | 2 | $309B |
|
||
| Insurance | 2 | $27B |
|
||
| Telecommunications / Media | 1 | $124B |
|
||
| Industrial Distribution | 1 | $22B |
|
||
| Financial Services | 1 | $20B |
|
||
| Chemicals / Materials | 1 | $18B |
|
||
Price history
+29.0% since first listed14 events — show timeline
- 2026-03-13 Price Changed $129,000 LCAR
- 2025-11-07 Listed $135,000 LCAR
- 2025-08-12 Price Changed $129,900 LCAR
- 2024-02-08 Sold (Public Records) $65,000 Public Records
- 2024-02-08 Sold (MLS) $65,000 LCAR
- 2024-01-09 Pending — LCAR
- 2024-01-05 Relisted — LCAR
- 2024-01-05 Price Changed $80,000 LCAR
- 2023-12-22 Delisted — LCAR
- 2023-12-14 Price Changed $85,000 LCAR
- 2023-12-14 Relisted — LCAR
- 2023-10-16 Pending — LCAR
- 2023-10-13 Price Changed $92,900 LCAR
- 2023-09-13 Listed $100,000 LCAR
Property tax history
+2.9%/yrLatest (2026): $1,468 · +3.8% YoY. Source: county tax records.
Cash-flow waterfall
monthlySold comps — $/sqft
last 12 mo · ≤1 miLoading sold comps…