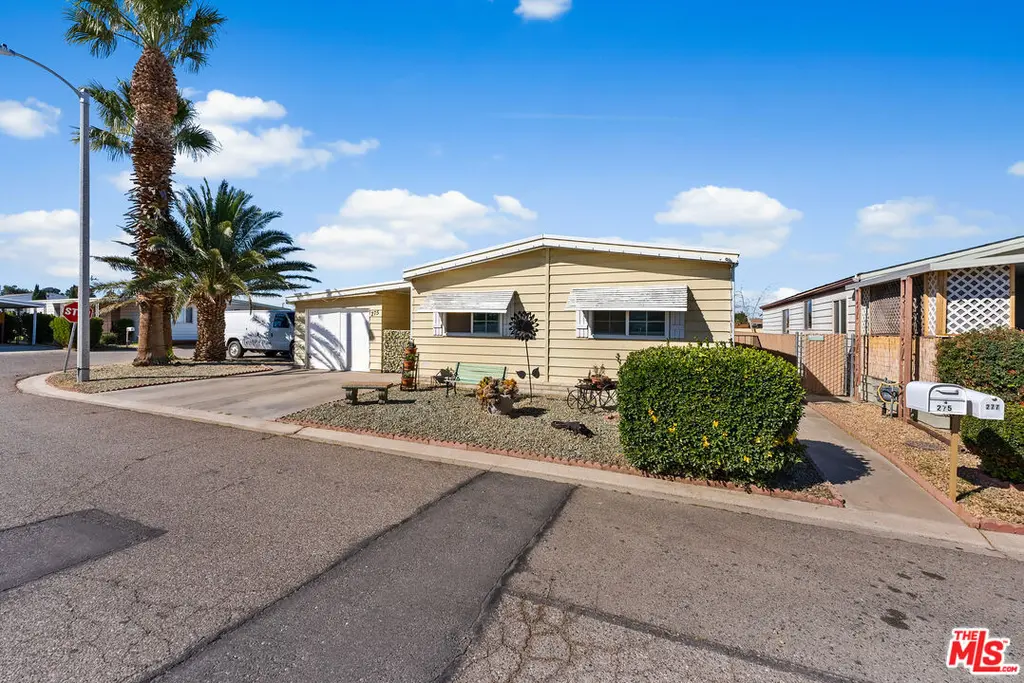
15252 Seneca Rd #275 · Victorville, CA
Flood risk 1/10 · Minimal
- FEMA flood zone
- X (unshaded)
- Chance of flooding over 30 yrs
- 0.0%
- Est. flood insurance / yr
- $507 – $1,088
Fire risk 5/10 · Moderate
- Est. fire insurance / yr
- $659 – $1,223
Heat risk 6/10 · Moderate
- Hot days now (above threshold)
- —
- Hot days in 30 yrs
- —
Wind risk 1/10 · Minimal
- Chance of severe wind over 30 yrs
- —
Air-quality risk 9/10 · Severe
- Unhealthy air days now
- 22 days/yr
- Unhealthy air days in 30 yrs
- 28 days/yr
Risk factors via First Street. Map © Google.
Why this score? — see what drove the C+ grade
The composite is a weighted blend of 9 inputs, each scored 0–100. Each bar is that input's sub-score; the figure is the points it added to the 100-point composite (weight × sub-score).
- Cash flow +22.9/30.0
- ARV discount +13.6/15.0
- 1% rule +10.0/10.0
- DSCR +7.3/10.0
- Rent growth +2.9/5.0
- Livability +2.7/5.0
- Condition / age +2.5/5.0
- Schools +2.2/10.0
- Appreciation +0.0/10.0
$134,499
🖨 Deal sheet 📄 Offer letter ✓ Due diligence
Listing remarks MLS
Welcome Nice double wide with detached one-car garage. Next to overflow parking for extra parking. This desirable corner-lot home offers one of the most spacious locations in the park with the convenience of the closest visitor parking nearby. Inside, you'll find 2 comfortable bedrooms, a versatile bonus office area perfect for working from home, and 2 restrooms. The property also features a separate garage for added storage or parking. Enjoy extra outdoor space, privacy, and a prime location within the community. A rare opportunity combining space, functionality, and convenience--don't miss your chance to make this home yours!
Key facts
- Extra outdoor space
- Corner-lot home
- Prime location
Tags
Property features AI
Finance
- Other: Property listed in Victorville, CA
- HOA & community: Community clubhouse; Community pool; Homeowner dues: $700; Pet rules: contact association
Exterior
- Parking: Converted 1-car garage; 1 covered parking space (1 total parking space)
- Home design: Single-story residential mobile home
- Exterior features: Association pool
Interior
- Kitchen: Range/Oven
- Flooring: Laminate floors
- Bathrooms: 2 full bathrooms
- Heating & cooling: Central heat; A/C
- Interior features: Breakfast area; Laminate floors; Range/Oven
- Laundry & utility: Laundry area
Neighborhood map
What this means for you Summary
Snapshot
- This is a 2-bed/2.0-bath manufactured listed at $134k.
Deal economics
- At list price, monthly cash flow is $236 ($3k/yr) — positive.
- The deal already cash-flows at list — no discount required.
- Meets the 1% rule at list price ($2k rent vs $134k).
- Recommended offer: $122k (9.0% below list) — sets the bar for market timing.
- Cap rate 8.4% vs local median 4.2% in Victorville — top-decile yield for the area; either an underpriced asset or a hidden risk that comps aren't pricing in. Stress-test before assuming the spread holds.
Location & tenants
- Location reads 54/100 on livability (#906 in CA) — a working-class tenant base; expect higher turnover. Strengths: housing A+; Watch: employment D+, schools D-, crime F.
- Victor Elementary (urban): math 25% / reading 25% proficiency, ranked #408 of 517 in CA (top 79%) — low school quality limits family demand, transient renter base, plan for 1-2y turnover; 70% free/reduced lunch — lower-income household profile, screen leases tightly.
- Market conditions: Rents rising (+1.7%/yr); 369 active listings in the ZIP; 16 comparable units currently listed for rent nearby; rentals leasing fast (median 2d on market — plan ~1-2 weeks tenant-placement turnaround); solid renter incomes; 5,458 units permitted in San Bernardino County in 2024 (1,500 in 5+ unit buildings).
Forward outlook
- Local home prices are declining (-3.0%/yr); year-one equity from $930 of loan paydown is wiped out by about $4k of value loss. Plan a longer hold.
- San Bernardino County population projected at +15% by 2050 — modest demand growth; plan on rents tracking national, not racing it.
Negotiation context
- It's been on market 92 days — a 9% lower offer ($122k) is reasonable based on typical stale-listing flexibility.
- 3 sale attempts since 6y ago with the ask held roughly flat each time — persistent listings suggest the price (not the market) is what's stuck; bring a comps-based counter.
- Current owner paid $40k; list at $134k implies a 236% gain — meaningful room to come down on a strong offer.
Risks & watch-outs
- Watch-outs: HOA is 32% of rent.
- Climate carrying-cost: moderate wildfire risk — expect insurance premiums to compound above CPI over the hold.
Questions for the listing agent
- It's been on market 92 days. Have you received any prior offers? Is the seller open to a 9% concession, seller financing, or rate buy-down credit?
- What does the HOA fee cover, when was the last increase, and are there any pending special assessments or reserve-fund shortfalls?
- Why hasn't it sold? Are there any deal-killer items the seller is aware of (foundation, flood, title, zoning, code violations)?
- Is there a deadline driving the sale (1031 exchange, divorce, estate, relocation)? That informs how much negotiation room exists.
- Schools are D-rated, which usually means shorter tenancies and higher turnover. Who's the typical renter profile here, and what's been the actual vacancy rate?
- Crime grade is F in this area — have there been break-ins, vandalism, or insurance claims at this property in the last 3 years? What carrier currently insures it and at what premium?
- What's the average days-on-market for RENTAL listings here right now (not sales)? A rising rental-DOM trend means longer vacancies and softer asking-rent achievability than the comps imply.
- What's the recent tenant-quality profile in this submarket — average credit score on applications, eviction rate, late-payment / NSF rate, and stable-employment percentage? A property-management company in the area should have these aggregated.
- How much new for-sale + rental construction is in the pipeline within 1–3 miles? Heavy new supply typically softens prices + rents 12–24 months out; constrained supply supports both.
Investment metrics
- 1% rule
- 1.62% ✓
- Cap rate
- 8.40%
- Cash-on-cash
- 7.51%
- DSCR
- 1.33
- GRM
- 5.1
CMA / ARV
- ARV (on-the-fly)
- $155,520
- Comps found
- 12
Show comp detail 12 sales within ~0.75 mi
| Address | Dist | Beds/Ba | Sqft | Sold | Price | $/sf | Match |
|---|---|---|---|---|---|---|---|
| 15252 Seneca Rd #298 | 0.00mi | 2/2.0 | 1,440 (0%) | 9mo | $125,000 | $87 | 92 |
| 15252 Seneca Rd #311 | 0.00mi | 3/2.0 (+1) | 1,440 (0%) | 8mo | $145,000 | $101 | 89 |
| 15252 Seneca Rd #343 | 0.00mi | 2/2.0 | 1,344 (-7%) | 5mo | $145,000 | $108 | 85 |
| 15252 Seneca Rd #284 | 0.00mi | 3/2.0 (+1) | 1,440 (0%) | 16mo | $115,000 | $80 | 82 |
| 15252 Seneca Rd #334 | 0.17mi | 3/2.0 (+1) | 1,456 (+1%) | 8mo | $200,000 | $137 | 78 |
| 15252 Seneca Rd #215 | 0.00mi | 2/2.0 | 1,536 (+7%) | 13mo | $177,500 | $116 | 78 |
| 15252 Seneca Rd #317 | 0.00mi | 3/2.0 (+1) | 1,344 (-7%) | 8mo | $100,000 | $74 | 77 |
| 15252 Seneca Rd #236 | 0.08mi | 3/2.0 (+1) | 1,440 (0%) | 20mo | $135,000 | $94 | 75 |
| 15252 Seneca Rd #178 | 0.17mi | 3/2.0 (+1) | 1,344 (-7%) | 6mo | $169,400 | $126 | 71 |
| 15252 Seneca Rd #221 | 0.00mi | 3/2.0 (+1) | 1,248 (-13%) | 4mo | $175,000 | $140 | 69 |
| 15252 Seneca Rd #270 | 0.00mi | 2/2.0 | 1,232 (-14%) | 11mo | $145,000 | $118 | 67 |
| 15252 Seneca Rd #28 | 0.00mi | 2/3.0 | 1,248 (-13%) | 17mo | $130,000 | $104 | 59 |
Match score weights: distance 35% · size 25% · config 20% · recency 20%. Top-matched comps best support the ARV.
Projected returns pro-forma
-3.0% appreciation · 1.69% rent growth · sell at horizon
- IRR
- -6.7%
- Equity multiple
- 0.75×
- Total profit
- $-9,242
- Equity at exit
- $20,054
- IRR
- 0.6%
- Equity multiple
- 1.04×
- Total profit
- $1,474
- Equity at exit
- $11,629
Cash invested: $37,660 (down + closing). Projections, not guarantees.
Landlord ↔ Tenant lean methodology
- Overall (STATE)
- 18 Strongly Tenant-Friendly
- State California
- 18 Strongly Tenant-Friendly · D+13
- County
- — inherits STATE
- City
- — inherits STATE
ZIP-level market 92392
- Home prices YoY
- -9.0%
- Rents YoY
- 1.7%
- Active inventory
- 369
- Price-to-rent
- 5.1×
Monthly cashflow live
- Estimated rent
- $2,179 high interval (Pro) →
- Mortgage (P&I)
- −$705
- Tax from tax record
- −$24 /mo · $293/yr
- Insurance
- −$56
- HOA
- −$700
- Vacancy / Maint / Mgmt
- −$458
- Net cashflow
- $236
Break-even live
UW: 25.0% down · 7.5% · 30yr · 1.5% tax · 5.0% vac · 8.0% maint · 8.0% mgmt
Financing live
Cash to close
- Down payment
- $33,625
- Closing costs
- $4,035
- Reserves months
- —
- Total cash needed
- —
Loan-product check · same deal, 3 products live
Conventional
25% down · 7.5% · 30yr
- Down + closing
- —
- Monthly P&I
- —
- Monthly cashflow
- —
- DSCR
- —
- Eligible?
- —
Personal DTI + credit; lowest rate.
DSCR
20% down · 8.5% · 30yr
- Down + closing
- —
- Monthly P&I
- —
- Monthly cashflow
- —
- DSCR
- —
- Eligible?
- —
No personal income docs; deal must DSCR.
Hard money
10% down · 12.0% · 12mo
- Down + closing
- —
- Monthly P&I
- —
- Monthly cashflow
- —
- DSCR
- —
- Eligible?
- —
Short-term bridge; refi at stabilization.
Rent comps 16 comps
| Address | Beds | Baths | Sqft | Rent | $/sqft | DOM | Units | Dist |
|---|---|---|---|---|---|---|---|---|
| 15230 Seneca Rd Victorville, CA | 1.0–3.0 | 1.0–2.0 | 805 | $1,850 | $2.30 | 1d | 12 | 0.14mi |
| 14374 Borego Rd Victorville, CA | 1.0–2.0 | 1.0–2.0 | 842 | $2,080 | $2.47 | 1d | 12 | 0.21mi |
| 14344 Mcart Rd Victorville, CA | 2.0–3.0 | 2.0 | 1042 | $1,899 | $1.82 | 1d | 5 | 0.35mi |
| 15191 Wildrose St Victorville, CA | 3.0 | 2.0 | 1500 | $2,400 | $1.60 | 10d | 1 | 0.49mi |
| 14861 Ann Dr Victorville, CA | 3.0 | 3.0 | 1657 | $2,395 | $1.45 | 1d | 1 | 0.59mi |
| 14440 Stivers Rd Victorville, CA | 3.0 | 2.0 | 994 | $1,950 | $1.96 | 10d | 1 | 0.80mi |
| 14485 Seneca Rd Victorville, CA | 2.0–3.0 | 2.0 | 1123 | $2,345 | $2.09 | 1d | 6 | 0.82mi |
| 14450 El Evado Rd Victorville, CA | 2.0–3.0 | 1.0–2.0 | 895 | $1,615 | $1.80 | 1d | 3 | 0.90mi |
| 14610 Green River Rd Victorville, CA | 3.0 | 2.5 | 1493 | $2,595 | $1.74 | 1d | 1 | 0.92mi |
| 14257 Sage St Victorville, CA | 3.0 | 3.0 | 1319 | $2,500 | $1.90 | 1d | 1 | 1.06mi |
| 14304 Gray Fox Ln Victorville, CA | 3.0 | 2.5 | 1795 | $2,600 | $1.45 | 14d | 1 | 1.07mi |
| 15112 Brown Ln Victorville, CA | 3.0 | 2.0 | 1400 | $850 | $0.61 | 1d | 1 | 1.24mi |
| 14979 Buckskin Rd Victorville, CA | 3.0 | 2.0 | 1277 | $2,250 | $1.76 | 1d | 1 | 1.24mi |
| 13925 Burning Tree Dr Victorville, CA | 3.0 | 2.0 | 1440 | $2,250 | $1.56 | 1d | 1 | 1.28mi |
| 14299 La Paz Dr Unit 3A Victorville, CA | 2.0 | 1.5 | 880 | $1,495 | $1.70 | 1d | 1 | 1.35mi |
| 13632 Nassau Dr Victorville, CA | 3.0 | 2.0 | 1298 | $1,990 | $1.53 | 1d | 1 | 1.41mi |
HOA detail
- Monthly dues
- $700 · $8,400/yr
Listing history 22 events
-
2026-06-18days on market $134,499 Active 92 DOM
-
2026-06-17days on market $134,499 Active 91 DOM
-
2026-06-16days on market $134,499 Active 90 DOM
-
2026-06-16remarks 699-char remark
-
2026-06-16price $134,499 Active 89 DOM
-
2026-06-15days on market $134,999 Active 89 DOM
-
2026-06-13days on market $134,999 Active 87 DOM
-
2026-06-13days on market $134,999 Active 86 DOM
-
2026-06-09days on market $134,999 Active 83 DOM
-
2026-06-08days on market $134,999 Active 82 DOM
-
2026-06-07days on market $134,999 Active 81 DOM
-
2026-06-04days on market $134,999 Active 78 DOM
-
2026-06-03days on market $134,999 Active 77 DOM
-
2026-06-02days on market $134,999 Active 76 DOM
-
2026-06-01days on market $134,999 Active 75 DOM
-
2026-05-31days on market $134,999 Active 74 DOM
-
2026-03-18$134,999 Active
-
2026-03-13$134,999 Active 635-char remark
Show marketing remark (635 chars)
Welcome Nice double wide with detached one-car garage. Next to overflow parking for extra parking. This desirable corner-lot home offers one of the most spacious locations in the park with the convenience of the closest visitor parking nearby. Inside, you'll find 2 comfortable bedrooms, a versatile bonus office area perfect for working from home, and 2 restrooms. The property also features a separate garage for added storage or parking. Enjoy extra outdoor space, privacy, and a prime location within the community. A rare opportunity combining space, functionality, and convenience--don't miss your chance to make this home yours!
-
2020-10-16soldstatus $40,000 284-char remark
Show marketing remark (284 chars)
Adorable 2 bed 2 bath mobile home in quiet park. Laminate flooring, wood burning fire place in living room, formal dining room , includes washer, dryer and refrigerator. Recently replaced roof and heating and air conditioner. Fully fenced complete with a garage . Financing available!
-
2020-02-18$59,500 284-char remark
Show marketing remark (284 chars)
Adorable 2 bed 2 bath mobile home in quiet park. Laminate flooring, wood burning fire place in living room, formal dining room , includes washer, dryer and refrigerator. Recently replaced roof and heating and air conditioner. Fully fenced complete with a garage . Financing available!
-
2010-12-10soldstatus $27,000
-
2002-09-11soldstatus $33,000
ⓘ Source: listings_history table (triggers on properties + properties_extension) + one-shot
backfill from property_details.listing_events for pre-trigger history.
Tax reassessment forecast CA · Resets to sale price
- Current annual tax
- $293 · $24/mo
- Projected year-2 tax
- $1,022 · $85/mo
- Expected delta
- +$729/yr (+$61/mo · 249.2%)
ⓘ Screening estimate from a state-policy table — verify with the county assessor before closing.
Climate risk First Street
- Flood 1/10 Low FEMA zone X (unshaded) · 0% chance over 30 yrs
- Wildfire 5/10 Major
- Heat 6/10 Major
- Wind 1/10 Low
- Air quality 9/10 Extreme 22 unhealthy d/yr today · 28 by 30 yrs out
Nearby sold comps map
Loading sold comps map…
Walkable amenities ~0.75 mi
Loading nearby amenities…
Taxation est. · year 1
- Rental income
- $26,149
- − Mortgage interest
- −$7,534
- − Property taxes
- −$293
- − Insurance
- −$672
- − Repairs & maintenance
- −$2,092
- − Management
- −$2,092
- − HOA
- −$8,400
- − Depreciation
- −$3,913
- Taxable income
- $1,153
- Est. tax owed @ 24.0%
- −$277
- After-tax cash flow
- $2,552/yr
For passive investors: Depreciation is non-cash, so a rental often shows a tax loss while cash-flowing — sheltering income. Rental losses are passive: they offset passive income freely, and up to $25,000/yr can offset ordinary (W-2) income if you actively participate and your MAGI is under $100k (phasing out to $0 by $150k); unused losses carry forward. On sale, claimed depreciation is recaptured at up to 25%, and gains may owe capital-gains tax (a 1031 exchange can defer both). Figures are a year-1 estimate at your 24.0% rate — not tax advice; consult a CPA.
Schools (NCES district)
- District
- Victor Elementary
- NCES district ID
- 0641040
- Math proficiency
- 25% ▬ 0.00%
- Reading proficiency
- 25% ▼ -9.00%
- Median HH income
- $44,949
- Composite
- 21.58/100
- National rank
- #8304
- State rank
- #408 of 517 in CA
Livability — Victorville
- Score
- 54/100
- State rank
- #906
- US rank
- #24038
Category grades
Schools grade is shown separately in the Schools card above.
Census & demographics
- Census place
- Victorville, CA
- County
- San Bernardino County · 2,030,291 people
- City population
- 154,418
- Metro
- Riverside-San Bernardino-Ontario, CA
- Population (ZIP)
- 65,429
- Household income
- $87,681
- Rent vs Own
- Severe rent burden
- 1879.0
Population outlook (San Bernardino County) Hauer SSP2
- Today (2025)
- 2,300,329 people
- By 2030
- 2,378,907 · +3.4%
- By 2040
- 2,523,137 · +9.7%
- By 2050
- 2,642,388 · +14.9%
- By 2075
- 2,880,769 · +25.2%
- By 2100
- 2,909,436 · +26.5%
Race, ethnicity, and origin ACS 2023
- Neighborhood character
- Diverse neighborhood (Simpson 0.62)
- Race & ethnicity
- Hispanic / Latino 55% Two or more races 24% White 22% Black 14% Asian 4% Native American 2%
- Hispanic origin (detail)
- Mexican 47%
- Common ancestry
- Portuguese 1% Romanian 1%
- Foreign-born
- 20% · Canada, China, Vietnam
- Languages at home
- 57% English-only · Spanish 38% Tagalog/Filipino 2% Other Indo-European 1%
Political lean MEDSL · San Bernardino
- 2024 margin
- Toss-up / Even · D 47.5% · R 49.7% · Other 2.8%
- 2008→2024 swing
- -8.5pp toward R · 2008: 6.3pp · 2024: -2.1pp
- All cycles
- 2024: R+2.1 2020: D+10.7 2016: D+9.8 2012: D+5.4 2008: D+6.3
Not yet ingested
- Civics
- —
Market trends
- HPI YoY
- ▼ -35.57%
- Current HPI
- 358.5152
- Rent YoY
- ▲ 1.69%
- Metro
- Riverside-San Bernardino-Ontario, CA
- State GDP YoY
- ▲ 3.21%
- F500 in state
- 116
Industry mix (Fortune 500 HQ in CA)
| Industry | F500 HQs | Revenue |
|---|---|---|
| Technology | 27 | $1,492B |
|
||
| Financial Services | 3 | $174B |
|
||
| Retail | 3 | $44B |
|
||
| Insurance | 3 | $26B |
|
||
| Media / Entertainment | 2 | $115B |
|
||
| Pharmaceuticals / Biotech | 2 | $62B |
|
||
Price history
+309.1% since first listed6 events — show timeline
- 2026-03-18 Listed $134,999 TheMLS
- 2026-03-13 Listed $134,999 AVMLS
- 2020-10-16 Sold (MLS) $40,000 CRMLS
- 2020-02-18 Listed $59,500 CRMLS
- 2010-12-10 Sold (MLS) $27,000 CRMLS
- 2002-09-11 Sold (MLS) $33,000 CRMLS
Property tax history
+1.6%/yrLatest (2025): $293 · +5.1% YoY. Source: county tax records.
Cash-flow waterfall
monthlySold comps — $/sqft
last 12 mo · ≤1 miLoading sold comps…