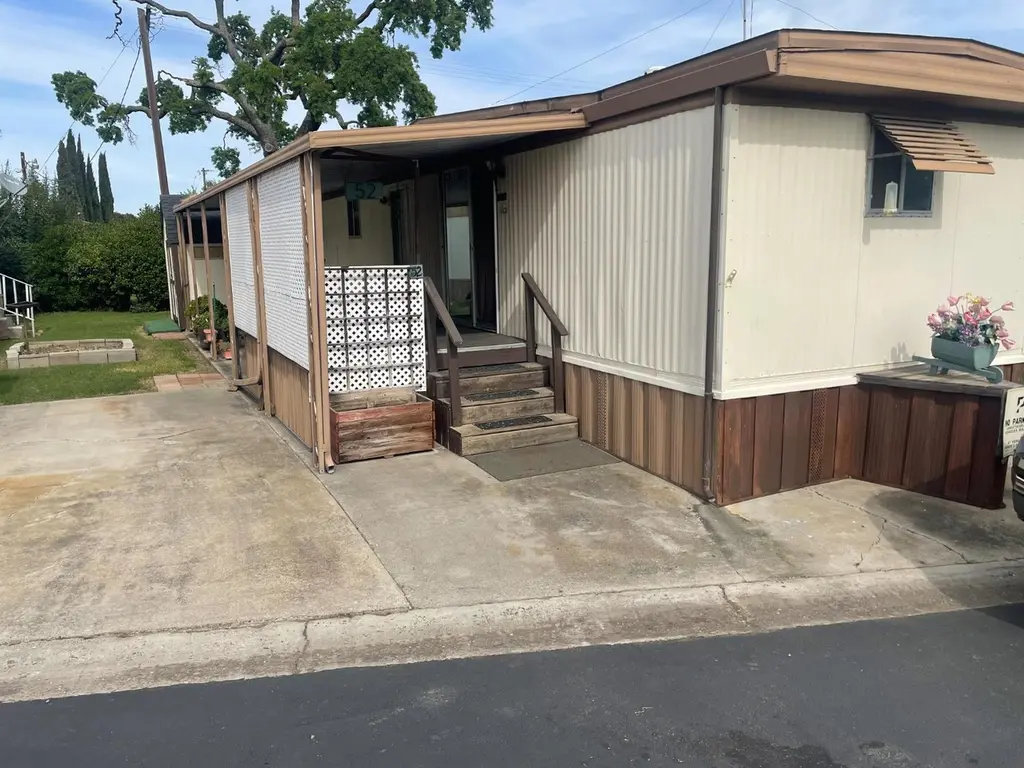
5835 Cherokee Rd #52 · Morada, CA
Flood risk 8/10 · Major
- FEMA flood zone
- X (shaded)
- Chance of flooding over 30 yrs
- 0.97%
- Est. flood insurance / yr
- $507 – $1,088
Fire risk 6/10 · Moderate
- Est. fire insurance / yr
- $659 – $1,223
Heat risk 7/10 · Major
- Hot days now (above 102°F)
- 7 days/yr
- Hot days in 30 yrs
- 15 days/yr
Wind risk 1/10 · Minimal
- Chance of severe wind over 30 yrs
- —
Air-quality risk 10/10 · Severe
- Unhealthy air days now
- 28 days/yr
- Unhealthy air days in 30 yrs
- 28 days/yr
Risk factors via First Street. Map © Google.
Why this score? — see what drove the B- grade
The composite is a weighted blend of 9 inputs, each scored 0–100. Each bar is that input's sub-score; the figure is the points it added to the 100-point composite (weight × sub-score).
- Cash flow +30.0/30.0
- 1% rule +10.0/10.0
- DSCR +10.0/10.0
- ARV discount +6.8/15.0
- Schools +3.5/10.0
- Livability +3.0/5.0
- Rent growth +2.5/5.0
- Condition / age +2.2/5.0
- Appreciation +0.0/10.0
$60,000
🖨 Deal sheet (PDF) 📄 Offer letter ✓ Due diligence
Listing remarks
Beautiful home in the Bel Air Estates Senior Community. Home has many upgrades, must see to appreciate.
Key facts
- Parking
- Built 1972
- Listed 100 days
Neighborhood map
What this means for you Summary
Snapshot
- This is a 2-bed/1.0-bath manufactured listed at $60k. Condition is rated fair.
Deal economics
- At list price, monthly cash flow is $820 ($10k/yr) — positive.
- The deal already cash-flows at list — no discount required.
- Meets the 1% rule at list price ($2k rent vs $60k).
- Recommended offer: $55k (9.0% below list) — sets the bar for market timing.
- Cap rate 24.0% vs local median 2.7% in Morada — top-decile yield for the area; either an underpriced asset or a hidden risk that comps aren't pricing in. Stress-test before assuming the spread holds.
Location & tenants
- Location reads 60/100 on livability (#596 in CA) — a middle-class / working-renter tenant base. Strengths: crime A+, employment A+, housing A+; Watch: amenities F, commute F, cost of living F.
- Linden Unified (rural): math 32% / reading 40% proficiency, ranked #806 of 1,400 in CA (top 58%) — families likely to look elsewhere, expect single-tenant / working-renter base with shorter leases.
- Zoned schools: Waverly Elementary (366 students, 77% FRL); Waterloo Elementary (332 students, 48% FRL); Linden High (761 students, 68% FRL).
- Market conditions: 94 active listings in the ZIP; 3,779 units permitted in San Joaquin County in 2024 (0 in 5+ unit buildings).
Forward outlook
- Local home prices are declining (-3.0%/yr); year-one equity from $415 of loan paydown is wiped out by about $2k of value loss. Plan a longer hold.
- San Joaquin County population projected at +17% by 2050 — long-run rental-demand tailwind backs the buy-and-hold thesis.
- At projected returns (-3.0% appreciation + 3.0% rent growth), your $17k cash investment doubles in ~2 years — after that, you're playing with house money.
Negotiation context
- It's been on market 100 days — a 9% lower offer ($55k) is reasonable based on typical stale-listing flexibility.
Risks & watch-outs
- Watch-outs: flood insurance adds $66/mo.
- Climate carrying-cost: severe flood risk; major wildfire risk; extreme-heat days projected 7→15/yr by 2055 (HVAC capex compounding) — expect insurance premiums to compound above CPI over the hold.
Questions for the listing agent
- It's been on market 100 days. Have you received any prior offers? Is the seller open to a 9% concession, seller financing, or rate buy-down credit?
- Have any recent inspections been done? Can we get a copy of the seller's disclosures and any deferred-maintenance estimates?
- Built in 1972 — when were the roof, HVAC, electrical panel, plumbing, and water heater last replaced?
- What's the actual annual flood-insurance premium (NFIP or private), and is the property in a SFHA with mandatory coverage?
- Why hasn't it sold? Are there any deal-killer items the seller is aware of (foundation, flood, title, zoning, code violations)?
- Is there a deadline driving the sale (1031 exchange, divorce, estate, relocation)? That informs how much negotiation room exists.
- What's the average days-on-market for RENTAL listings here right now (not sales)? A rising rental-DOM trend means longer vacancies and softer asking-rent achievability than the comps imply.
- What's the recent tenant-quality profile in this submarket — average credit score on applications, eviction rate, late-payment / NSF rate, and stable-employment percentage? A property-management company in the area should have these aggregated.
- How much new for-sale + rental construction is in the pipeline within 1–3 miles? Heavy new supply typically softens prices + rents 12–24 months out; constrained supply supports both.
Investment metrics
- 1% rule
- 2.74% ✓
- Cap rate
- 24.01%
- Cash-on-cash
- 63.29%
- DSCR
- 3.82
- GRM
- 3.0
CMA / ARV
- ARV (median comp)
- $59,082
- List price
- $60,000
- Delta
- 1.55%
- Verdict
- FAIR
- Comps
- 3 within 1.0 mi
Show comp detail 2 sales within ~0.75 mi
| Address | Dist | Beds/Ba | Sqft | Sold | Price | $/sf | Match |
|---|---|---|---|---|---|---|---|
| 5835 Cherokee Rd #63 | 0.08mi | 2/1.0 | 648 (-10%) | 10mo | $65,000 | $100 | 71 |
| 5835 Cherokee Rd #29 | 0.08mi | 2/1.0 | 648 (-10%) | 12mo | $60,000 | $93 | 70 |
Match score weights: distance 35% · size 25% · config 20% · recency 20%. Top-matched comps best support the ARV.
Projected returns pro-forma
-3.0% appreciation · 3.0% rent growth · sell at horizon
- IRR
- 57.2%
- Equity multiple
- 3.53×
- Total profit
- $42,546
- Equity at exit
- $8,946
- IRR
- 62.1%
- Equity multiple
- 7.22×
- Total profit
- $104,534
- Equity at exit
- $5,188
Cash invested: $16,800 (down + closing). Projections, not guarantees.
Landlord ↔ Tenant lean methodology
- Overall (STATE)
- 18 Strongly Tenant-Friendly
- State California
- 18 Strongly Tenant-Friendly · D+13
- County
- — inherits STATE
- City
- — inherits STATE
ZIP-level market 95215
- Home prices YoY
- -1.4%
- Active inventory
- 94
- Price-to-rent
- 3.0×
Monthly cashflow live
- Estimated rent
- $1,646 medium interval (Pro) →
- Mortgage (P&I)
- −$315
- Tax est. 1.5%
- −$75 /mo · $900/yr
- Insurance
- −$25
- Flood insurance flood zone
- −$66 /mo · $798/yr
- HOA
- −$0
- Vacancy / Maint / Mgmt
- −$346
- Net cashflow
- $820
Break-even live
Sensitivity live
| Price | -10% $861 | -5% $840 | +0% $820 | +5% $799 | +10% $778 |
|---|---|---|---|---|---|
| Rent | -10% $690 | -5% $755 | +0% $820 | +5% $885 | +10% $950 |
| Rate | -1.0pp $850 | -0.5pp $835 | base $820 | +0.5pp $804 | +1.0pp $788 |
UW: 25.0% down · 7.5% · 30yr · 1.5% tax · 5.0% vac · 8.0% maint · 8.0% mgmt
Financing live
Cash to close
- Down payment
- $15,000
- Closing costs
- $1,800
- Reserves months
- —
- Total cash needed
- —
Loan-product check · same deal, 3 products live
Conventional
25% down · 7.5% · 30yr
- Down + closing
- —
- Monthly P&I
- —
- Monthly cashflow
- —
- DSCR
- —
- Eligible?
- —
Personal DTI + credit; lowest rate.
DSCR
20% down · 8.5% · 30yr
- Down + closing
- —
- Monthly P&I
- —
- Monthly cashflow
- —
- DSCR
- —
- Eligible?
- —
No personal income docs; deal must DSCR.
Hard money
10% down · 12.0% · 12mo
- Down + closing
- —
- Monthly P&I
- —
- Monthly cashflow
- —
- DSCR
- —
- Eligible?
- —
Short-term bridge; refi at stabilization.
Listing history 16 events
-
2026-06-21days on market $60,000 Active 100 DOM
-
2026-06-18days on market $60,000 Active 97 DOM
-
2026-06-17days on market $60,000 Active 96 DOM
-
2026-06-16days on market $60,000 Active 95 DOM
-
2026-06-15days on market $60,000 Active 94 DOM
-
2026-06-14days on market $60,000 Active 92 DOM
-
2026-06-13days on market $60,000 Active 91 DOM
-
2026-06-10pricedays on market $60,000 Active 89 DOM
-
2026-06-09days on market $69,000 Active 88 DOM
-
2026-06-08days on market $69,000 Active 87 DOM
-
2026-06-07days on market $69,000 Active 86 DOM
-
2026-06-05days on market $69,000 Active 83 DOM
-
2026-06-03days on market $69,000 Active 82 DOM
-
2026-06-03days on market $69,000 Active 81 DOM
-
2026-06-01days on market $69,000 Active 80 DOM
-
2026-05-31days on market $69,000 Active 79 DOM
ⓘ Source: listings_history table (triggers on properties + properties_extension) + one-shot
backfill from property_details.listing_events for pre-trigger history.
Climate risk First Street
- Flood 8/10 Severe FEMA zone X (shaded) · 97% chance over 30 yrs
- Wildfire 6/10 Major
- Heat 7/10 Severe 7 d/yr ≥102°F today · 15 d/yr by 30 yrs out
- Wind 1/10 Low
- Air quality 10/10 Extreme 28 unhealthy d/yr today · 28 by 30 yrs out
Nearby sold comps map
Loading sold comps map…
Walkable amenities ~0.75 mi
Loading nearby amenities…
Taxation est. · year 1
- Rental income
- $19,758
- − Mortgage interest
- −$3,361
- − Property taxes
- −$900
- − Insurance
- −$1,098
- − Repairs & maintenance
- −$1,581
- − Management
- −$1,581
- − Depreciation
- −$1,745
- Taxable income
- $9,493
- Est. tax owed @ 24.0%
- −$2,278
- After-tax cash flow
- $7,557/yr
For passive investors: Depreciation is non-cash, so a rental often shows a tax loss while cash-flowing — sheltering income. Rental losses are passive: they offset passive income freely, and up to $25,000/yr can offset ordinary (W-2) income if you actively participate and your MAGI is under $100k (phasing out to $0 by $150k); unused losses carry forward. On sale, claimed depreciation is recaptured at up to 25%, and gains may owe capital-gains tax (a 1031 exchange can defer both). Figures are a year-1 estimate at your 24.0% rate — not tax advice; consult a CPA.
Condition & rehab AI · 13 photos
This manufactured home requires cosmetic updates, including painting, flooring, and kitchen cabinets, to improve its resale and rental value.
Repairs flagged
- Major Paint — Peeling paint on walls
- Major Flooring — Worn appearance
- Major Kitchen cabinets — Signs of wear
Value-add opportunities
- Both Painting and updating flooring — Improves appearance and functionality
- Both Updating kitchen cabinets — Enhances functionality and aesthetic appeal
Renovation cost estimate screening
| Repair item | Severity | Est. cost |
|---|---|---|
| Paint · Peeling paint on walls | Major | $15,000–50,000 |
| Flooring · Worn appearance | Major | $15,000–50,000 |
| Kitchen cabinets · Signs of wear | Major | $15,000–50,000 |
| Total estimated repair cost · 3 items | $45,000–150,000 |
Value-add ROI direction
- Both Painting and updating flooring — Improves appearance and functionality ↑
- Both Updating kitchen cabinets — Enhances functionality and aesthetic appeal ↑
ⓘ Cost ranges are severity-bucket heuristics (US national rule-of-thumb). Get contractor quotes + a written scope before underwriting a rehab budget.
Schools (NCES district)
- District
- Linden Unified
- NCES district ID
- 0621810
- Math proficiency
- 32% ▬ 0.00%
- Reading proficiency
- 40% ▼ -2.00%
- Median HH income
- $60,534
- Composite
- 34.76/100
- National rank
- #10030
- State rank
- #806 of 1400 in CA
Livability — Morada
- Score
- 60/100
- State rank
- #596
- US rank
- #19273
Category grades
Schools grade is shown separately in the Schools card above.
Census & demographics
- Population (ZIP)
- 26,032
Population outlook (San Joaquin County) Hauer SSP2
- Today (2025)
- 796,965 people
- By 2030
- 828,849 · +4.0%
- By 2040
- 885,611 · +11.1%
- By 2050
- 929,798 · +16.7%
- By 2075
- 994,578 · +24.8%
- By 2100
- 971,291 · +21.9%
Race, ethnicity, and origin ACS 2023
- Neighborhood character
- Predominantly Hispanic (65%)
- Race & ethnicity
- Hispanic / Latino 65% Two or more races 23% White 23% Black 4% Asian 3% Native American 2%
- Hispanic origin (detail)
- Mexican 61%
- Common ancestry
- Italian 1% Lithuanian 1% Russian 1%
- Foreign-born
- 28% · Canada, China, Jamaica
- Languages at home
- 46% English-only · Spanish 51% Other Asian/Pacific 1% Other Indo-European 1%
Political lean MEDSL · San Joaquin
- 2024 margin
- Toss-up / Even · D 48.0% · R 48.9% · Other 3.0%
- 2008→2024 swing
- -11.6pp toward R · 2008: 10.7pp · 2024: -0.9pp
- All cycles
- 2024: R+0.9 2020: D+13.9 2016: D+12.9 2012: D+8.9 2008: D+10.7
Not yet ingested
- Civics
- —
Market trends
- HPI YoY
- ▼ -16.84%
- Current HPI
- 1200.44
- Rent YoY
- —
- Metro
- —
- State GDP YoY
- ▲ 3.21%
- F500 in state
- 116
Industry mix (Fortune 500 HQ in CA)
| Industry | F500 HQs | Revenue |
|---|---|---|
| Technology | 27 | $1,492B |
|
||
| Financial Services | 3 | $174B |
|
||
| Retail | 3 | $44B |
|
||
| Insurance | 3 | $26B |
|
||
| Media / Entertainment | 2 | $115B |
|
||
| Pharmaceuticals / Biotech | 2 | $62B |
|
||
Cash-flow waterfall
monthlySold comps — $/sqft
last 12 mo · ≤1 miLoading sold comps…