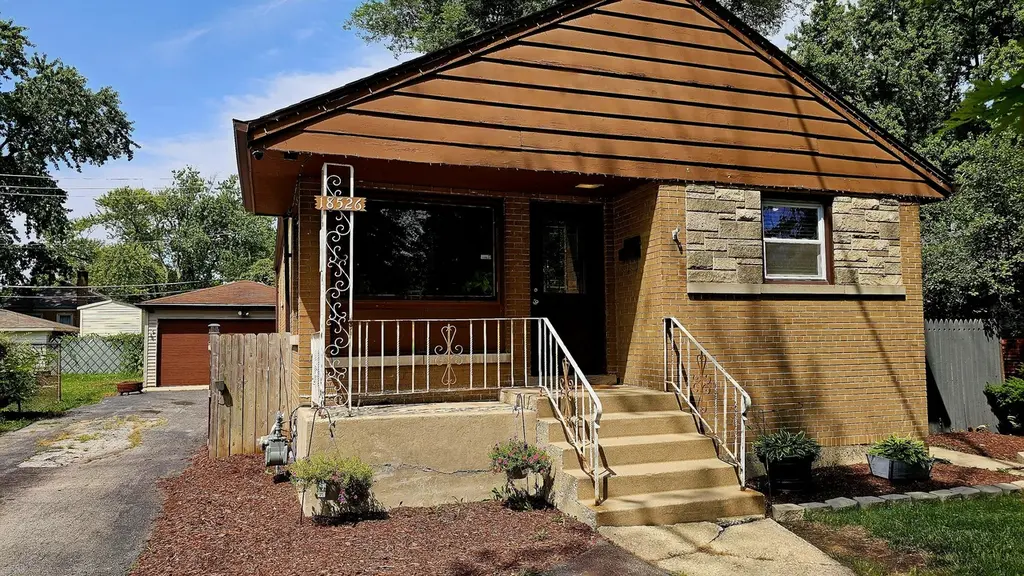
18526 Dixie Hwy · Homewood, IL
Flood risk 1/10 · Minimal
- FEMA flood zone
- X (unshaded)
- Chance of flooding over 30 yrs
- 0.0%
- Est. flood insurance / yr
- $473 – $860
Fire risk 1/10 · Minimal
- Est. fire insurance / yr
- $804 – $1,492
Heat risk 3/10 · Minor
- Hot days now (above 101°F)
- 7 days/yr
- Hot days in 30 yrs
- 15 days/yr
Wind risk 2/10 · Minimal
- Chance of severe wind over 30 yrs
- —
Air-quality risk 3/10 · Minor
- Unhealthy air days now
- 4 days/yr
- Unhealthy air days in 30 yrs
- 4 days/yr
Risk factors via First Street. Map © Google.
Why this score? — see what drove the F grade
The composite is a weighted blend of 9 inputs, each scored 0–100. Each bar is that input's sub-score; the figure is the points it added to the 100-point composite (weight × sub-score).
- Cash flow +12.3/30.0
- Livability +4.0/5.0
- DSCR +3.7/10.0
- 1% rule +3.6/10.0
- ARV discount +3.6/15.0
- Rent growth +2.5/5.0
- Condition / age +2.5/5.0
- Schools +2.4/10.0
- Appreciation +0.0/10.0
$249,900
🖨 Deal sheet 📄 Offer letter ✓ Due diligence
Listing remarks
More space than meets the eye! This updated 3-bed, 2-bath ranch offers a fully finished basement with a second living area, full kitchen, bath, laundry, and bonus room-perfect for guests, extended family, or flexible living. The main level features a bright, open living and dining area, three comfortable bedrooms, and a full bath, all with stylish updates throughout. Enjoy a cozy covered front porch, a partially fenced yard and patio for entertaining, and the convenience of a long driveway plus a 2-car garage. Located minutes from downtown Homewood, with easy access to shopping, dining, and transportation, this move-in-ready home offers versatility, comfort, and value. All appliances stay-j
Key facts
- Full kitchen
- Second living area
- 3,049 sq ft lot
Tags
Property features AI
Finance
- Other: Fee simple ownership; Not currently leased; Property not rebuilt or rehabbed; Parcel identifiers available
- HOA & community: No master association fee required
Exterior
- Parking: Detached garage with garage door opener (garage owned); Asphalt parking; 2 total parking spaces (2 garage spaces)
- Utilities: Lake Michigan water source; Public sewer; 100 Amp electric service
- Home design: Detached single-family home; One-story layout with finished basement; Built approximately 71–80 years ago; Faces commuter train access nearby
- Construction: Brick construction; Asphalt roof
- Exterior features: Partial fencing; Sidewalks and street lights; Paved street; Lot dimensions approx. 23 x 123
Interior
- Kitchen: Range; Dishwasher; Refrigerator; Eating area / table space
- Bedrooms: 3 bedrooms (main level: master, Bedroom 2 12 x 11, Bedroom 3 11 x 10); Additional finished basement bedroom possible (room types listed include a basement office and storage)
- Flooring: Hardwood flooring in main living areas; Ceramic tile in kitchen
- Bathrooms: 2 full bathrooms; Basement includes bathroom(s)
- Heating & cooling: Natural gas heating; Central air conditioning
- Interior features: First-floor bedroom; First-floor full bath; Finished full basement; Combined dining and living area; Ceiling fans; Sump pump; Gas water heater
- Laundry & utility: In-unit laundry with gas dryer hookup; Laundry room in basement (10 x 5)
Neighborhood map
What this means for you Summary
Snapshot
- This is a 3-bed/2.0-bath single-family listed at $250k.
Deal economics
- At list price, monthly cash flow is $-46 ($-547/yr) — negative.
- To cash-flow at today's rent, offer at most $242k (3.2% below list).
- To meet the 1% rule (rent ≥ 1% of price), the offer needs to be $214k (14.4% below list).
- Recommended offer: $214k (14.4% below list) — sets the bar for 1% rule.
Location & tenants
- Location reads 81/100 on livability (#81 in IL, #1,314 nationally) — a professional / high-income tenant draw. Strengths: commute A+, employment A+, cost of living A+; Watch: amenities F.
- Homewood Flossmoor Chsd 233 (suburban): math 21% / reading 27% proficiency, ranked #272 of 620 in IL (top 44%) — low school quality limits family demand, transient renter base, plan for 1-2y turnover.
- Zoned schools: Homewood-Flossmoor High School (math 21% / reading 27%, grade F, #304 of 693 statewide, top 44%, 2,798 students, 0% FRL).
- Market conditions: 101 active listings in the ZIP; 5 comparable units currently listed for rent nearby; rentals leasing fast (median 11d on market — plan ~1-2 weeks tenant-placement turnaround); 6,272 units permitted in Cook County in 2024 (4,658 in 5+ unit buildings).
Forward outlook
- Local home prices are declining (-3.0%/yr); year-one equity from $2k of loan paydown is wiped out by about $7k of value loss. Plan a longer hold.
Negotiation context
- Only 9 days on market — expect competitive offers; lowballing is unlikely to land.
- 4 sale attempts since 16y ago; this cycle's ask is 117% above the opening price — seller raised mid-cycle; expect resistance to lowballs.
- Current owner paid $107k; list at $250k implies a 134% gain — meaningful room to come down on a strong offer.
Risks & watch-outs
- Watch-outs: built in 1955 — expect roof / HVAC / electrical / plumbing capex.
Questions for the listing agent
- What do current leases actually rent for vs. the listed asking? Can we see a recent rent roll and the last 12 months of T-12 income?
- Built in 1955 — when were the roof, HVAC, electrical panel, plumbing, and water heater last replaced?
- Is there a deadline driving the sale (1031 exchange, divorce, estate, relocation)? That informs how much negotiation room exists.
- Schools are D-rated, which usually means shorter tenancies and higher turnover. Who's the typical renter profile here, and what's been the actual vacancy rate?
- The area grade is low — what's the realistic commute time and amenity access for the typical tenant pool here? Any planned neighborhood developments (good or bad) we should know about?
- What's the average days-on-market for RENTAL listings here right now (not sales)? A rising rental-DOM trend means longer vacancies and softer asking-rent achievability than the comps imply.
- What's the recent tenant-quality profile in this submarket — average credit score on applications, eviction rate, late-payment / NSF rate, and stable-employment percentage? A property-management company in the area should have these aggregated.
- How much new for-sale + rental construction is in the pipeline within 1–3 miles? Heavy new supply typically softens prices + rents 12–24 months out; constrained supply supports both.
Investment metrics
- 1% rule
- 0.86% ✗
- Cap rate
- 6.07%
- Cash-on-cash
- -0.78%
- DSCR
- 0.97
- GRM
- 9.7
CMA / ARV
- ARV (on-the-fly)
- $229,950
- Comps found
- 12
Show comp detail 12 sales within ~0.75 mi
| Address | Dist | Beds/Ba | Sqft | Sold | Price | $/sf | Match |
|---|---|---|---|---|---|---|---|
| 18404 Dixie Hwy | 0.19mi | 3/1.5 | 1,039 (-1%) | 0mo | $255,000 | $245 | 87 |
| 18532 Morris Ave | 0.12mi | 4/2.0 (+1) | 1,050 (0%) | 9mo | $230,000 | $219 | 82 |
| 18646 Martin Ave | 0.14mi | 3/1.0 | 1,085 (+3%) | 6mo | $218,300 | $201 | 79 |
| 18512 Dixie Hwy | 0.03mi | 3/1.0 | 900 (-14%) | 0mo | $170,000 | $189 | 71 |
| 2311 Clyde Ter | 0.40mi | 3/1.5 | 1,121 (+7%) | 2mo | $310,000 | $277 | 67 |
| 18524 Dundee Ave | 0.56mi | 3/2.0 | 1,016 (-3%) | 7mo | $232,990 | $229 | 63 |
| 18625 Golfview Ave | 0.33mi | 2/1.0 (-1) | 965 (-8%) | 4mo | $116,000 | $120 | 59 |
| 1710 187th St | 0.42mi | 2/1.0 (-1) | 971 (-8%) | 1mo | $225,000 | $232 | 58 |
| 18521 Highland Ave | 0.29mi | 2/1.0 (-1) | 1,198 (+14%) | 6mo | $249,000 | $208 | 48 |
| 18439 Marshfield Ave | 0.49mi | 4/2.0 (+1) | 1,184 (+13%) | 7mo | $350,000 | $296 | 45 |
| 18314 Dundee Ave | 0.63mi | 3/1.0 | 914 (-13%) | 6mo | $174,000 | $190 | 40 |
| 1728 Olive Rd | 0.59mi | 3/1.0 | 1,200 (+14%) | 8mo | $250,000 | $208 | 38 |
Match score weights: distance 35% · size 25% · config 20% · recency 20%. Top-matched comps best support the ARV.
Projected returns pro-forma
-3.0% appreciation · 3.0% rent growth · sell at horizon
- IRR
- -17.6%
- Equity multiple
- 0.38×
- Total profit
- $-43,361
- Equity at exit
- $37,261
- IRR
- -9.6%
- Equity multiple
- 0.41×
- Total profit
- $-41,343
- Equity at exit
- $21,607
Cash invested: $69,972 (down + closing). Projections, not guarantees.
Landlord ↔ Tenant lean methodology
- Overall (STATE)
- 43 Moderately Tenant-Leaning
- State Illinois
- 43 Moderately Tenant-Leaning · D+7
- County
- — inherits STATE
- City
- — inherits STATE
ZIP-level market 60430
- Home prices YoY
- -32.1%
- Active inventory
- 101
- Price-to-rent
- 9.7×
Monthly cashflow live
- Estimated rent
- $2,140 high interval (Pro) →
- Mortgage (P&I)
- −$1,311
- Tax from tax record
- −$322 /mo · $3,861/yr
- Insurance
- −$104
- HOA
- −$0
- Vacancy / Maint / Mgmt
- −$449
- Net cashflow
- $-46
Break-even live
UW: 25.0% down · 7.5% · 30yr · 1.5% tax · 5.0% vac · 8.0% maint · 8.0% mgmt
Financing live
Cash to close
- Down payment
- $62,475
- Closing costs
- $7,497
- Reserves months
- —
- Total cash needed
- —
Loan-product check · same deal, 3 products live
Conventional
25% down · 7.5% · 30yr
- Down + closing
- —
- Monthly P&I
- —
- Monthly cashflow
- —
- DSCR
- —
- Eligible?
- —
Personal DTI + credit; lowest rate.
DSCR
20% down · 8.5% · 30yr
- Down + closing
- —
- Monthly P&I
- —
- Monthly cashflow
- —
- DSCR
- —
- Eligible?
- —
No personal income docs; deal must DSCR.
Hard money
10% down · 12.0% · 12mo
- Down + closing
- —
- Monthly P&I
- —
- Monthly cashflow
- —
- DSCR
- —
- Eligible?
- —
Short-term bridge; refi at stabilization.
Rent comps 5 comps
| Address | Beds | Baths | Sqft | Rent | $/sqft | DOM | Units | Dist |
|---|---|---|---|---|---|---|---|---|
| 2420 183rd St Homewood, IL | 2.0 | 1.0 | 1100 | $1,750 | $1.59 | 10d | 1 | 0.59mi |
| 18117 Loomis Ave Homewood, IL | 4.0 | 2.0 | 1500 | $2,800 | $1.87 | 3d | 1 | 0.95mi |
| 2640 Flossmoor Rd Unit 2S Flossmoor, IL | 2.0 | 1.5 | 800 | $1,800 | $2.25 | 15d | 1 | 1.09mi |
| 17561 Hillside Ave Homewood, IL | 3.0 | 1.0 | 1174 | $2,500 | $2.13 | 16d | 1 | 1.21mi |
| 17561 Hillside Ave Homewood, IL | 3.0 | 1.0 | 1174 | $2,300 | $1.96 | 1d | 1 | 1.21mi |
Listing history 35 events
-
2026-06-18days on market $249,900 Active 9 DOM
-
2026-06-17days on market $249,900 Active 8 DOM
-
2026-06-16days on market $249,900 Active 7 DOM
-
2026-06-15days on market $249,900 Active 6 DOM
-
2026-06-13days on market $249,900 Active 4 DOM
-
2026-06-10days on market $249,900 Active 1 DOM
-
2026-06-09days on market $249,900 Active 15 DOM
-
2026-06-08days on market $249,900 Active 14 DOM
-
2026-06-07pricedays on market $249,900 Active 13 DOM
-
2026-06-04days on market $250,000 Active 10 DOM
-
2026-06-03days on market $250,000 Active 9 DOM
-
2026-06-02days on market $250,000 Active 8 DOM
-
2026-06-01days on market $250,000 Active 7 DOM
-
2026-05-31days on market $250,000 Active 6 DOM
-
2026-03-08historical
-
2026-02-05Active
-
2026-02-04historical
-
2026-01-11price
-
2025-11-16Active
-
2025-11-16historical
-
2025-11-06price
-
2025-10-15price
-
2025-10-09price
-
2025-10-03price
-
2025-09-18price
-
2025-09-02price
-
2025-08-13price
-
2025-08-08price
-
2025-08-04Active
-
2011-02-16soldstatus $107,000
-
2011-02-11soldstatus $107,000 Closed Sale
-
2011-01-11historical Contingent
-
2010-12-18$115,000 New
-
1996-11-22soldstatus $99,000
-
1991-11-14soldstatus $84,000
ⓘ Source: listings_history table (triggers on properties + properties_extension) + one-shot
backfill from property_details.listing_events for pre-trigger history.
Tax reassessment forecast IL · Partial reset (capped growth)
- Current annual tax
- $3,861 · $322/mo
- Projected year-2 tax
- $4,767 · $397/mo
- Expected delta
- +$906/yr (+$76/mo · 23.5%)
ⓘ Screening estimate from a state-policy table — verify with the county assessor before closing.
Climate risk First Street
- Flood 1/10 Low FEMA zone X (unshaded) · 0% chance over 30 yrs
- Wildfire 1/10 Low
- Heat 3/10 Moderate 7 d/yr ≥101°F today · 15 d/yr by 30 yrs out
- Wind 2/10 Low
- Air quality 3/10 Moderate 4 unhealthy d/yr today · 4 by 30 yrs out
Nearby sold comps map
Loading sold comps map…
Walkable amenities ~0.75 mi
Loading nearby amenities…
Taxation est. · year 1
- Rental income
- $25,682
- − Mortgage interest
- −$13,998
- − Property taxes
- −$3,861
- − Insurance
- −$1,250
- − Repairs & maintenance
- −$2,055
- − Management
- −$2,055
- − Depreciation
- −$7,270
- Taxable loss
- −$4,805
- Est. tax savings @ 24.0%
- +$1,153
- After-tax cash flow
- $606/yr
For passive investors: Depreciation is non-cash, so a rental often shows a tax loss while cash-flowing — sheltering income. Rental losses are passive: they offset passive income freely, and up to $25,000/yr can offset ordinary (W-2) income if you actively participate and your MAGI is under $100k (phasing out to $0 by $150k); unused losses carry forward. On sale, claimed depreciation is recaptured at up to 25%, and gains may owe capital-gains tax (a 1031 exchange can defer both). Figures are a year-1 estimate at your 24.0% rate — not tax advice; consult a CPA.
Schools (NCES district)
- District
- Homewood Flossmoor Chsd 233
- NCES district ID
- 1719560
- Math proficiency
- 21% ▼ -15.00%
- Reading proficiency
- 27% ▼ -13.00%
- Median HH income
- $83,564
- Composite
- 24.42/100
- National rank
- #7681
- State rank
- #272 of 620 in IL
Livability — Homewood
- Score
- 81/100
- State rank
- #81
- US rank
- #1314
Category grades
Schools grade is shown separately in the Schools card above.
Census & demographics
- Census place
- Homewood, IL
- City population
- 19,993
- Population (ZIP)
- 19,993
Population outlook (Cook County) Hauer SSP2
- Today (2025)
- 5,347,519 people
- By 2030
- 5,357,703 · +0.2%
- By 2040
- 5,324,924 · -0.4%
- By 2050
- 5,230,762 · -2.2%
- By 2075
- 4,785,735 · -10.5%
- By 2100
- 4,188,836 · -21.7%
Race, ethnicity, and origin ACS 2023
- Neighborhood character
- Diverse neighborhood (Simpson 0.62)
- Race & ethnicity
- Black 44% White 42% Hispanic / Latino 9% Two or more races 6% Asian 1%
- Hispanic origin (detail)
- Mexican 7%
- Common ancestry
- Romanian 5% Iranian 2% Italian 2%
- Foreign-born
- 6% · Canada, Dominican Republic
- Languages at home
- 91% English-only · Spanish 5% Russian/Polish/Slavic 1% German/W. Germanic 1%
Political lean MEDSL · Cook
- 2024 margin
- Solid D (+42.0) · D 70.4% · R 28.4% · Other 1.2%
- 2008→2024 swing
- -11.4pp toward R · 2008: 53.4pp · 2024: 42.0pp
- All cycles
- 2024: D+42.0 2020: D+50.3 2016: D+53.0 2012: D+49.4 2008: D+53.4
Not yet ingested
- Civics
- —
Market trends
- HPI YoY
- ▼ -105.00%
- Current HPI
- 222.2923
- Rent YoY
- —
- Metro
- —
- State GDP YoY
- ▲ 1.59%
- F500 in state
- 60
Industry mix (Fortune 500 HQ in IL)
| Industry | F500 HQs | Revenue |
|---|---|---|
| Insurance | 4 | $201B |
|
||
| Consumer Goods | 4 | $87B |
|
||
| Industrial Machinery | 3 | $64B |
|
||
| Healthcare | 2 | $55B |
|
||
| Retail / Pharmacy | 1 | $148B |
|
||
| Agriculture / Food | 1 | $86B |
|
||
Price history
+27.4% since first listed21 events — show timeline
- 2026-03-08 Listing Removed — MRED as Distributed by MLS Grid
- 2026-02-05 Listed — MRED as Distributed by MLS Grid
- 2026-02-04 Listing Removed — MRED as Distributed by MLS Grid
- 2026-01-11 Price Changed — MRED as Distributed by MLS Grid
- 2025-11-16 Listing Removed — MRED as Distributed by MLS Grid
- 2025-11-16 Listed — MRED as Distributed by MLS Grid
- 2025-11-06 Price Changed — MRED as Distributed by MLS Grid
- 2025-10-15 Price Changed — MRED as Distributed by MLS Grid
- 2025-10-09 Price Changed — MRED as Distributed by MLS Grid
- 2025-10-03 Price Changed — MRED as Distributed by MLS Grid
- 2025-09-18 Price Changed — MRED as Distributed by MLS Grid
- 2025-09-02 Price Changed — MRED as Distributed by MLS Grid
- 2025-08-13 Price Changed — MRED as Distributed by MLS Grid
- 2025-08-08 Price Changed — MRED as Distributed by MLS Grid
- 2025-08-04 Listed — MRED as Distributed by MLS Grid
- 2011-02-16 Sold (Public Records) $107,000 Public Records
- 2011-02-11 Sold (MLS) $107,000 MRED as Distributed by MLS Grid
- 2011-01-11 Contingent — MRED as Distributed by MLS Grid
- 2010-12-18 Listed $115,000 MRED as Distributed by MLS Grid
- 1996-11-22 Sold (Public Records) $99,000 Public Records
- 1991-11-14 Sold (Public Records) $84,000 Public Records
Property tax history
+3.4%/yrLatest (2023): $3,861 · +41.3% YoY. Source: county tax records.
Cash-flow waterfall
monthlySold comps — $/sqft
last 12 mo · ≤1 miLoading sold comps…