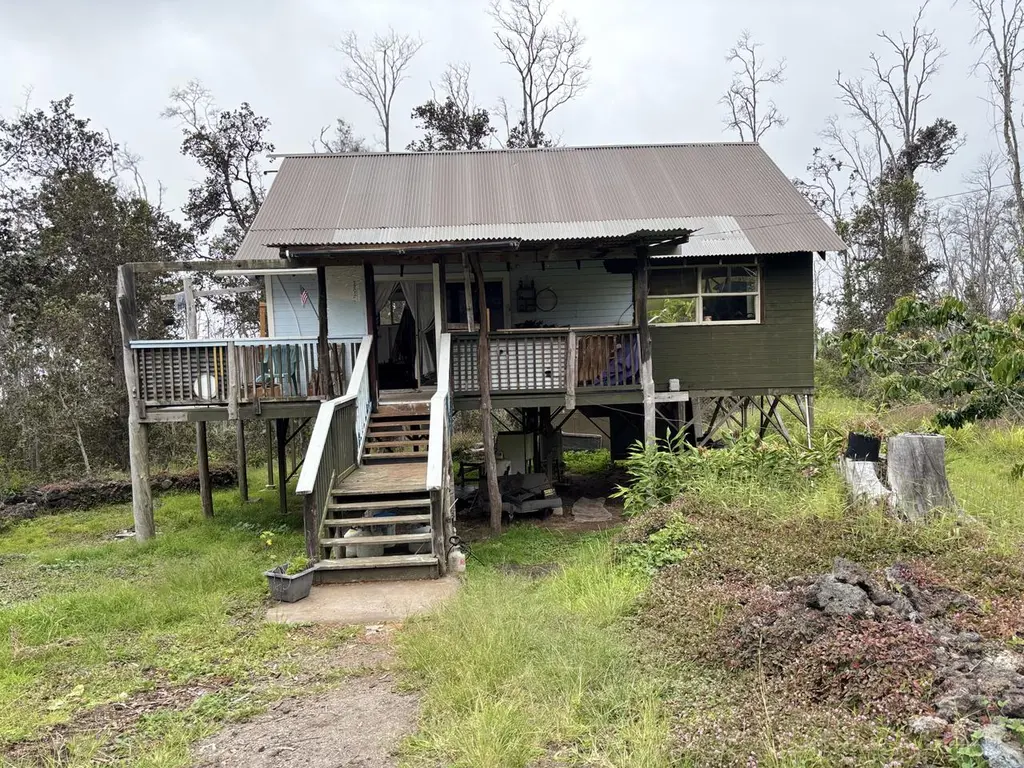
92-8823 Trade Wind Blvd · Hawaiian Ocean View, HI
Flood risk 1/10 · Minimal
- FEMA flood zone
- X (unshaded)
- Chance of flooding over 30 yrs
- 0.0%
- Est. flood insurance / yr
- $507 – $1,088
Fire risk No data
- Est. fire insurance / yr
- —
Heat risk No data
- Hot days now (above threshold)
- —
- Hot days in 30 yrs
- —
Wind risk No data
- Chance of severe wind over 30 yrs
- —
Air-quality risk 1/10 · Minimal
- Unhealthy air days now
- —
- Unhealthy air days in 30 yrs
- —
Risk factors via First Street. Map © Google.
Why this score? — see what drove the B+ grade
The composite is a weighted blend of 9 inputs, each scored 0–100. Each bar is that input's sub-score; the figure is the points it added to the 100-point composite (weight × sub-score).
- Cash flow +30.0/30.0
- ARV discount +15.0/15.0
- DSCR +10.0/10.0
- 1% rule +9.3/10.0
- Appreciation +5.0/10.0
- Schools +3.7/10.0
- Rent growth +2.5/5.0
- Livability +2.4/5.0
- Condition / age +1.0/5.0
$129,000
🖨 Deal sheet 📄 Offer letter ✓ Due diligence
Listing remarks MLS
Surrounded by Koa & Ohia Forest, has peaceful ambiance. The Catchment Tank and Structure were permitted originally. The house is ready for clean and finish with potential for quaint living. Adjacent Acre shall be part of sale to be total of two acres! Corrugated metal roofing. Cedar exterior. And a "loft" up in the Trusses with ladder there. Best with new stairway. Being Sold "As Is".
Key facts
- Catchment tank
- Loft in the trusses
- Cedar exterior
Tags
Neighborhood map
What this means for you Summary
Snapshot
- This is a 1-bed/1.0-bath single-family listed at $129k. Condition is rated poor.
Deal economics
- At list price, monthly cash flow is $566 ($7k/yr) — positive.
- The deal already cash-flows at list — no discount required.
- Meets the 1% rule at list price ($2k rent vs $129k).
- Recommended offer: $114k (12.0% below list) — sets the bar for market timing.
- Cap rate 11.6% vs local median 4.2% in Hawaiian Ocean View — top-decile yield for the area; either an underpriced asset or a hidden risk that comps aren't pricing in. Stress-test before assuming the spread holds.
Location & tenants
- Location reads 48/100 on livability (#151 in HI) — a working-class tenant base; expect higher turnover. Watch: housing C-, health & safety C-, schools D.
- Hawaii Department Of Education (suburban): math 32% / reading 50% proficiency, ranked #1 of 1 in HI (top 100%) — families likely to look elsewhere, expect single-tenant / working-renter base with shorter leases.
- Market conditions: 247 active listings in the ZIP; 982 units permitted in Hawaii County in 2024 (0 in 5+ unit buildings).
Forward outlook
- In year one you build about $5k of equity ($892 loan paydown + $4k appreciation (3.0% local appreciation)).
- Hawaii County population projected at +24% by 2050 — long-run rental-demand tailwind backs the buy-and-hold thesis.
- At projected returns (3.0% appreciation + 3.0% rent growth), your $36k cash investment doubles in ~3 years — after that, you're playing with house money.
- By year 7, paydown + projected appreciation supports a ~$30k cash-out refi (75% LTV) — recoverable capital for the next deal without selling this one.
Negotiation context
- It's been on market 154 days — a 12% lower offer ($114k) is reasonable based on typical stale-listing flexibility.
- 2 sale attempts with the ask held roughly flat each time — persistent listings suggest the price (not the market) is what's stuck; bring a comps-based counter.
Questions for the listing agent
- It's been on market 154 days. Have you received any prior offers? Is the seller open to a 12% concession, seller financing, or rate buy-down credit?
- Have any recent inspections been done? Can we get a copy of the seller's disclosures and any deferred-maintenance estimates?
- Why hasn't it sold? Are there any deal-killer items the seller is aware of (foundation, flood, title, zoning, code violations)?
- Is there a deadline driving the sale (1031 exchange, divorce, estate, relocation)? That informs how much negotiation room exists.
- Schools are D-rated, which usually means shorter tenancies and higher turnover. Who's the typical renter profile here, and what's been the actual vacancy rate?
- What's the average days-on-market for RENTAL listings here right now (not sales)? A rising rental-DOM trend means longer vacancies and softer asking-rent achievability than the comps imply.
- What's the recent tenant-quality profile in this submarket — average credit score on applications, eviction rate, late-payment / NSF rate, and stable-employment percentage? A property-management company in the area should have these aggregated.
- How much new for-sale + rental construction is in the pipeline within 1–3 miles? Heavy new supply typically softens prices + rents 12–24 months out; constrained supply supports both.
Investment metrics
- 1% rule
- 1.43% ✓
- Cap rate
- 11.56%
- Cash-on-cash
- 18.80%
- DSCR
- 1.84
- GRM
- 5.8
CMA / ARV
- ARV (median comp)
- $163,973
- List price
- $129,000
- Delta
- -21.33%
- Verdict
- UNDERPRICED
- Comps
- 3 within 1.0 mi
Show comp detail 2 sales within ~0.75 mi
| Address | Dist | Beds/Ba | Sqft | Sold | Price | $/sf | Match |
|---|---|---|---|---|---|---|---|
| 92-8886 Reef Pkwy Lot 27 | 0.16mi | 2/1.0 (+1) | 576 (+7%) | 20mo | $185,000 | $321 | 60 |
| 92-8693 Koa Ln | 0.49mi | 1/1.0 | 600 (+11%) | 20mo | $165,000 | $275 | 42 |
Match score weights: distance 35% · size 25% · config 20% · recency 20%. Top-matched comps best support the ARV.
Projected returns pro-forma
3.0% appreciation · 3.0% rent growth · sell at horizon
- IRR
- 25.2%
- Equity multiple
- 2.43×
- Total profit
- $51,601
- Equity at exit
- $58,004
- IRR
- 25.9%
- Equity multiple
- 4.69×
- Total profit
- $133,254
- Equity at exit
- $89,391
Cash invested: $36,120 (down + closing). Projections, not guarantees.
Landlord ↔ Tenant lean methodology
- Overall (STATE)
- 37 Tenant-Leaning
- State Hawaii
- 37 Tenant-Leaning · D+13
- County
- — inherits STATE
- City
- — inherits STATE
ZIP-level market 96737
- Active inventory
- 247
- Price-to-rent
- 5.8×
Monthly cashflow live
- Estimated rent
- $1,845 medium interval (Pro) →
- Mortgage (P&I)
- −$676
- Tax est. 1.5%
- −$161 /mo · $1,935/yr
- Insurance
- −$54
- HOA
- −$0
- Vacancy / Maint / Mgmt
- −$387
- Net cashflow
- $566
Break-even live
UW: 25.0% down · 7.5% · 30yr · 1.5% tax · 5.0% vac · 8.0% maint · 8.0% mgmt
Financing live
Cash to close
- Down payment
- $32,250
- Closing costs
- $3,870
- Reserves months
- —
- Total cash needed
- —
Loan-product check · same deal, 3 products live
Conventional
25% down · 7.5% · 30yr
- Down + closing
- —
- Monthly P&I
- —
- Monthly cashflow
- —
- DSCR
- —
- Eligible?
- —
Personal DTI + credit; lowest rate.
DSCR
20% down · 8.5% · 30yr
- Down + closing
- —
- Monthly P&I
- —
- Monthly cashflow
- —
- DSCR
- —
- Eligible?
- —
No personal income docs; deal must DSCR.
Hard money
10% down · 12.0% · 12mo
- Down + closing
- —
- Monthly P&I
- —
- Monthly cashflow
- —
- DSCR
- —
- Eligible?
- —
Short-term bridge; refi at stabilization.
Listing history 7 events
-
2026-06-03days on market $129,000 Active 154 DOM
-
2026-06-02days on market $129,000 Active 153 DOM
-
2026-06-01days on market $129,000 Active 152 DOM
-
2026-05-31days on market $129,000 Active 151 DOM
-
2025-12-31$129,000 Active 413-char remark
Show marketing remark (413 chars)
Surrounded by Koa & Ohia Forest, has peaceful ambiance. The Catchment Tank and Structure were permitted originally. The house is ready for clean and finish with potential for quaint living. Adjacent Acre shall be part of sale to be total of two acres! Corrugated metal roofing. Cedar exterior. And a "loft" up in the Trusses with ladder there. Best with new stairway. Being Sold "As Is".
-
2025-12-22historical
-
2025-12-19$145,000 Active
ⓘ Source: listings_history table (triggers on properties + properties_extension) + one-shot
backfill from property_details.listing_events for pre-trigger history.
Climate risk First Street
- Flood 1/10 Low FEMA zone X (unshaded) · 0% chance over 30 yrs
- Air quality 1/10 Low
Nearby sold comps map
Loading sold comps map…
Walkable amenities ~0.75 mi
Loading nearby amenities…
Taxation est. · year 1
- Rental income
- $22,135
- − Mortgage interest
- −$7,226
- − Property taxes
- −$1,935
- − Insurance
- −$645
- − Repairs & maintenance
- −$1,771
- − Management
- −$1,771
- − Depreciation
- −$3,753
- Taxable income
- $5,035
- Est. tax owed @ 24.0%
- −$1,208
- After-tax cash flow
- $5,581/yr
For passive investors: Depreciation is non-cash, so a rental often shows a tax loss while cash-flowing — sheltering income. Rental losses are passive: they offset passive income freely, and up to $25,000/yr can offset ordinary (W-2) income if you actively participate and your MAGI is under $100k (phasing out to $0 by $150k); unused losses carry forward. On sale, claimed depreciation is recaptured at up to 25%, and gains may owe capital-gains tax (a 1031 exchange can defer both). Figures are a year-1 estimate at your 24.0% rate — not tax advice; consult a CPA.
Condition & rehab AI · 12 photos
This property requires extensive repairs and maintenance to improve its condition and increase its value for resale and rental.
Repairs flagged
- Major kitchen cabinets — cluttered and in need of cleaning
- Major bathroom fixtures — cluttered and in need of cleaning
- Major exterior siding — exposed structural elements
- Major roof — visible rust and wear
- Major windows — broken glass and frames in need of repair
- Major HVAC/mechanicals — no visible systems, likely in need of maintenance
Value-add opportunities
- Both extensive cleaning and organization — improves both resale and rental value
- Both extensive landscaping and curb appeal — enhances both resale and rental value
- Both HVAC system replacement — improves comfort and energy efficiency
- Both extensive structural repairs — restores structural integrity and enhances safety
Renovation cost estimate screening
| Repair item | Severity | Est. cost |
|---|---|---|
| kitchen cabinets · cluttered and in need of cleaning | Major | $15,000–50,000 |
| bathroom fixtures · cluttered and in need of cleaning | Major | $15,000–50,000 |
| exterior siding · exposed structural elements | Major | $15,000–50,000 |
| roof · visible rust and wear | Major | $15,000–50,000 |
| windows · broken glass and frames in need of repair | Major | $15,000–50,000 |
| HVAC/mechanicals · no visible systems, likely in need of maintenance | Major | $15,000–50,000 |
| Total estimated repair cost · 6 items | $90,000–300,000 |
Value-add ROI direction
- Both extensive cleaning and organization — improves both resale and rental value ↑
- Both extensive landscaping and curb appeal — enhances both resale and rental value ↑
- Both HVAC system replacement — improves comfort and energy efficiency ↑
- Both extensive structural repairs — restores structural integrity and enhances safety ↑
ⓘ Cost ranges are severity-bucket heuristics (US national rule-of-thumb). Get contractor quotes + a written scope before underwriting a rehab budget.
Schools (NCES district)
- District
- Hawaii Department Of Education
- NCES district ID
- 1500030
- Math proficiency
- 32% ▼ -10.00%
- Reading proficiency
- 50% ▼ -3.00%
- Median HH income
- $69,005
- Composite
- 37.07/100
- National rank
- #4504
- State rank
- #1 of 1 in HI
Livability — Hawaiian Ocean View
- Score
- 48/100
- State rank
- #151
- US rank
- #26127
Category grades
Schools grade is shown separately in the Schools card above.
Census & demographics
- Census place
- Hawaiian Ocean View, HI
- City population
- 3,781
- Population (ZIP)
- 3,781
Population outlook (Hawaii County) Hauer SSP2
- Today (2025)
- 220,733 people
- By 2030
- 232,156 · +5.2%
- By 2040
- 252,486 · +14.4%
- By 2050
- 272,703 · +23.5%
- By 2075
- 332,113 · +50.5%
- By 2100
- 398,342 · +80.5%
Race, ethnicity, and origin ACS 2023
- Neighborhood character
- Highly diverse neighborhood (Simpson 0.81)
- Race & ethnicity
- Two or more races 42% White 39% Hispanic / Latino 16% Asian 6% Pacific Islander 6% Black 1% Native American 1%
- Hispanic origin (detail)
- Mexican 6% Puerto Rican 10%
- Common ancestry
- Portuguese 5% Scotch-Irish 4% Hispanic 4%
- Foreign-born
- 6% · Canada
- Languages at home
- 75% English-only · Other Asian/Pacific 10% Spanish 3% Russian/Polish/Slavic 2%
Political lean MEDSL · Hawaii
- 2024 margin
- Strong D (+28.3) · D 63.0% · R 34.7% · Other 2.3%
- 2008→2024 swing
- -25.4pp toward R · 2008: 53.7pp · 2024: 28.3pp
- All cycles
- 2024: D+28.3 2020: D+36.2 2016: D+36.6 2012: D+51.3 2008: D+53.7
Not yet ingested
- Civics
- —
Market trends
- HPI YoY
- —
- Current HPI
- —
- Rent YoY
- —
- Metro
- —
- State GDP YoY
- —
- F500 in state
- 0
Price history
-11.0% since first listed3 events — show timeline
- 2025-12-31 Listed $129,000 HI Information Service
- 2025-12-22 Listing Removed — HI Information Service
- 2025-12-19 Listed $145,000 HI Information Service
Cash-flow waterfall
monthlySold comps — $/sqft
last 12 mo · ≤1 miLoading sold comps…