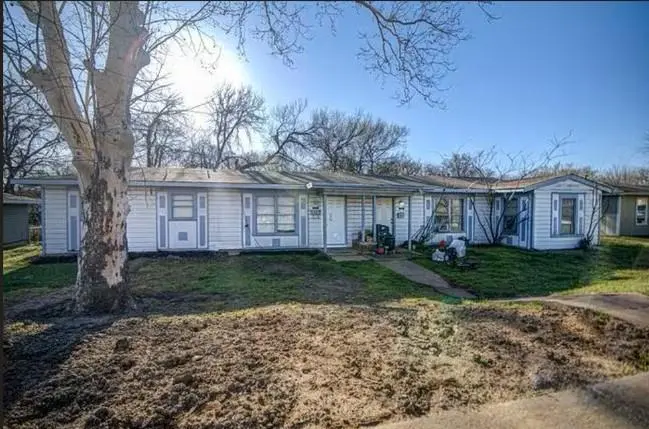
3 Pershing Dr Unit A · Denison, TX
Flood risk 1/10 · Minimal
- FEMA flood zone
- X (unshaded)
- Chance of flooding over 30 yrs
- 0.0%
- Est. flood insurance / yr
- $507 – $1,088
Fire risk 7/10 · Major
- Est. fire insurance / yr
- $1,222 – $2,270
Heat risk 6/10 · Moderate
- Hot days now (above 107°F)
- 7 days/yr
- Hot days in 30 yrs
- 21 days/yr
Wind risk 4/10 · Minor
- Chance of severe wind over 30 yrs
- 18.0%
Air-quality risk 3/10 · Minor
- Unhealthy air days now
- 2 days/yr
- Unhealthy air days in 30 yrs
- 3 days/yr
Risk factors via First Street. Map © Google.
Why this score? — see what drove the C- grade
The composite is a weighted blend of 9 inputs, each scored 0–100. Each bar is that input's sub-score; the figure is the points it added to the 100-point composite (weight × sub-score).
- Cash flow +22.3/30.0
- ARV discount +7.5/15.0
- DSCR +7.1/10.0
- 1% rule +5.4/10.0
- Livability +3.7/5.0
- Schools +2.9/10.0
- Rent growth +2.5/5.0
- Condition / age +2.5/5.0
- Appreciation +0.0/10.0
$190,000
🖨 Deal sheet 📄 Offer letter ✓ Due diligence
Listing remarks
Fantastic investment opportunity with endless potential! This duplex offers flexibility for investors and owner-occupants alike — live in one unit while renovating the other, or create an income-producing property with strong upside potential. Unit A features 3 bedrooms and 1 full bath and is ready for a complete refresh, making it the perfect project for buyers looking to add value and customize the space to their vision. Unit B is move-in ready and offers 2 bedrooms and 1.5 bathrooms with numerous updates already completed, including a new AC unit, updated plumbing and stylish luxury vinyl flooring throughout. The interior also features stainless steel appliances, modern LED lightin
Key facts
- 0.25 acre lot
- Built 1945
- Listed 35 days
Property features AI
Finance
- Other: Property listed as For Sale with standard listing conditions; Parcel and lot recorded in public records; Horse not permitted
- Financial info: Listing accepts Cash, Conventional, FHA, and VA financing; No second mortgage indicated
- HOA & community: No homeowners association; No municipal utility district
Exterior
- Parking: Common / on-street / open / outside parking
- Security: Smoke detector(s); Carbon monoxide detector(s); Security lights
- Utilities: City water; City sewer; Cable available; All-weather road access
- Home design: Single family residence; One story; Residential property; Not attached to another unit
- Construction: Built in 1945 (preowned); Siding and wood construction; Composition/shingle roof; Slab foundation
- Exterior features: Lighting; Few trees; Interior lot; Large backyard with grass; Curbs
Interior
- Kitchen: Gas cooktop, gas oven, gas range; Plumbed for gas in kitchen
- Bedrooms: 5 bedrooms (all on main level)
- Flooring: Luxury vinyl plank; Wood
- Bathrooms: 2 full bathrooms; 1 half bathroom
- Heating & cooling: Central heating (electric); Central air (electric); Ceiling fan(s)
- Interior features: Open floorplan; Eat-in kitchen; Pantry; Walk-in closet(s); Decorative lighting; Cable TV available; High speed internet available
- Laundry & utility: Washer hookup
Neighborhood map
What this means for you Summary
Snapshot
- This is a 5-bed/2.5-bath other listed at $190k.
Deal economics
- At list price, monthly cash flow is $311 ($4k/yr) — positive.
- The deal already cash-flows at list — no discount required.
- Meets the 1% rule at list price ($2k rent vs $190k).
- Recommended offer: $184k (3.0% below list) — sets the bar for market timing.
- Cap rate 8.3% vs local median 3.8% in Denison — top-decile yield for the area; either an underpriced asset or a hidden risk that comps aren't pricing in. Stress-test before assuming the spread holds.
Location & tenants
- Location reads 73/100 on livability (#221 in TX) — a middle-class / working-renter tenant base. Strengths: cost of living A+, housing A+, crime A; Watch: health & safety D+, schools D-, amenities F.
- Sherman ISD (urban): math 31% / reading 37% proficiency, ranked #546 of 826 in TX (top 66%) — families likely to look elsewhere, expect single-tenant / working-renter base with shorter leases.
- Market conditions: Rents flat; 485 active listings in the ZIP; 2,272 units permitted in Grayson County in 2024 (750 in 5+ unit buildings).
- This rent runs 33% of the median local income ($72k/yr) — at the standard rent-burdened threshold; future hikes will face affordability resistance.
Forward outlook
- Local home prices are declining (-3.0%/yr); year-one equity from $1k of loan paydown is wiped out by about $6k of value loss. Plan a longer hold.
- Grayson County population projected at +12% by 2050 — modest demand growth; plan on rents tracking national, not racing it.
Negotiation context
- It's been on market 36 days — a 3% lower offer ($184k) is reasonable based on typical stale-listing flexibility.
Risks & watch-outs
- Watch-outs: built in 1945 — expect roof / HVAC / electrical / plumbing capex.
- Climate carrying-cost: major wildfire risk; extreme-heat days projected 7→21/yr by 2055 (HVAC capex compounding) — expect insurance premiums to compound above CPI over the hold.
Questions for the listing agent
- It's been on market 36 days. Have you received any prior offers? Is the seller open to a 3% concession, seller financing, or rate buy-down credit?
- Built in 1945 — when were the roof, HVAC, electrical panel, plumbing, and water heater last replaced?
- Is there a deadline driving the sale (1031 exchange, divorce, estate, relocation)? That informs how much negotiation room exists.
- Schools are D-rated, which usually means shorter tenancies and higher turnover. Who's the typical renter profile here, and what's been the actual vacancy rate?
- What's the average days-on-market for RENTAL listings here right now (not sales)? A rising rental-DOM trend means longer vacancies and softer asking-rent achievability than the comps imply.
- What's the recent tenant-quality profile in this submarket — average credit score on applications, eviction rate, late-payment / NSF rate, and stable-employment percentage? A property-management company in the area should have these aggregated.
- How much new for-sale + rental construction is in the pipeline within 1–3 miles? Heavy new supply typically softens prices + rents 12–24 months out; constrained supply supports both.
Investment metrics
- 1% rule
- 1.04% ✓
- Cap rate
- 8.26%
- Cash-on-cash
- 7.02%
- DSCR
- 1.31
- GRM
- 8.0
CMA / ARV
No comps found within radius.
Projected returns pro-forma
-3.0% appreciation · 0.05% rent growth · sell at horizon
- IRR
- -8.8%
- Equity multiple
- 0.69×
- Total profit
- $-16,663
- Equity at exit
- $28,330
- IRR
- -3.6%
- Equity multiple
- 0.79×
- Total profit
- $-11,033
- Equity at exit
- $16,428
Cash invested: $53,200 (down + closing). Projections, not guarantees.
Landlord ↔ Tenant lean methodology
- Overall (STATE)
- 87 Strongly Landlord-Friendly
- State Texas
- 87 Strongly Landlord-Friendly · R+5
- County
- — inherits STATE
- City
- — inherits STATE
ZIP-level market 75020
- Rents YoY
- 0.1%
- Active inventory
- 485
- Price-to-rent
- 8.0×
Monthly cashflow live
- Estimated rent
- $1,973 medium interval (Pro) →
- Mortgage (P&I)
- −$996
- Tax from tax record
- −$172 /mo · $2,066/yr
- Insurance
- −$79
- HOA
- −$0
- Vacancy / Maint / Mgmt
- −$414
- Net cashflow
- $311
Break-even live
UW: 25.0% down · 7.5% · 30yr · 1.5% tax · 5.0% vac · 8.0% maint · 8.0% mgmt
Financing live
Cash to close
- Down payment
- $47,500
- Closing costs
- $5,700
- Reserves months
- —
- Total cash needed
- —
Loan-product check · same deal, 3 products live
Conventional
25% down · 7.5% · 30yr
- Down + closing
- —
- Monthly P&I
- —
- Monthly cashflow
- —
- DSCR
- —
- Eligible?
- —
Personal DTI + credit; lowest rate.
DSCR
20% down · 8.5% · 30yr
- Down + closing
- —
- Monthly P&I
- —
- Monthly cashflow
- —
- DSCR
- —
- Eligible?
- —
No personal income docs; deal must DSCR.
Hard money
10% down · 12.0% · 12mo
- Down + closing
- —
- Monthly P&I
- —
- Monthly cashflow
- —
- DSCR
- —
- Eligible?
- —
Short-term bridge; refi at stabilization.
Listing history 21 events
-
2026-06-19days on market $190,000 Active 36 DOM
-
2026-06-18days on market $190,000 Active 35 DOM
-
2026-06-17days on market $190,000 Active 34 DOM
-
2026-06-16days on market $190,000 Active 33 DOM
-
2026-06-15days on market $190,000 Active 32 DOM
-
2026-06-14days on market $190,000 Active 30 DOM
-
2026-06-13days on market $190,000 Active 29 DOM
-
2026-06-10days on market $190,000 Active 27 DOM
-
2026-06-09days on market $190,000 Active 26 DOM
-
2026-06-08days on market $190,000 Active 25 DOM
-
2026-06-07days on market $190,000 Active 24 DOM
-
2026-06-03days on market $190,000 Active 20 DOM
-
2026-06-02days on market $190,000 Active 19 DOM
-
2026-06-01days on market $190,000 Active 18 DOM
-
2026-05-31days on market $190,000 Active 17 DOM
-
2026-05-30days on market $190,000 Active 16 DOM
-
2026-05-14$190,000 Active 1079-char remark
-
2022-06-03price $1,050
-
2021-12-21soldstatus
-
2021-12-21soldstatus
-
1980-01-16soldstatus
ⓘ Source: listings_history table (triggers on properties + properties_extension) + one-shot
backfill from property_details.listing_events for pre-trigger history.
Tax reassessment forecast TX · Resets to sale price
- Current annual tax
- $2,066 · $172/mo
- Projected year-2 tax
- $3,477 · $290/mo
- Expected delta
- +$1,411/yr (+$118/mo · 68.3%)
ⓘ Screening estimate from a state-policy table — verify with the county assessor before closing.
Climate risk First Street
- Flood 1/10 Low FEMA zone X (unshaded) · 0% chance over 30 yrs
- Wildfire 7/10 Severe
- Heat 6/10 Major 7 d/yr ≥107°F today · 21 d/yr by 30 yrs out
- Wind 4/10 Moderate 18% chance of damaging wind over 30 yrs
- Air quality 3/10 Moderate 2 unhealthy d/yr today · 3 by 30 yrs out
Nearby sold comps map
Loading sold comps map…
Walkable amenities ~0.75 mi
Loading nearby amenities…
Taxation est. · year 1
- Rental income
- $23,681
- − Mortgage interest
- −$10,643
- − Property taxes
- −$2,066
- − Insurance
- −$950
- − Repairs & maintenance
- −$1,895
- − Management
- −$1,895
- − Depreciation
- −$5,527
- Taxable income
- $706
- Est. tax owed @ 24.0%
- −$169
- After-tax cash flow
- $3,566/yr
For passive investors: Depreciation is non-cash, so a rental often shows a tax loss while cash-flowing — sheltering income. Rental losses are passive: they offset passive income freely, and up to $25,000/yr can offset ordinary (W-2) income if you actively participate and your MAGI is under $100k (phasing out to $0 by $150k); unused losses carry forward. On sale, claimed depreciation is recaptured at up to 25%, and gains may owe capital-gains tax (a 1031 exchange can defer both). Figures are a year-1 estimate at your 24.0% rate — not tax advice; consult a CPA.
Schools (NCES district)
- District
- Sherman ISD
- NCES district ID
- 4840080
- Math proficiency
- 31% ▼ -9.00%
- Reading proficiency
- 37% ▼ -2.00%
- Median HH income
- $42,587
- Composite
- 28.79/100
- National rank
- #6665
- State rank
- #546 of 826 in TX
Livability — Denison
- Score
- 73/100
- State rank
- #221
- US rank
- #5428
Category grades
Schools grade is shown separately in the Schools card above.
Census & demographics
- Census place
- Denison, TX
- County
- Grayson County · 108,053 people
- City population
- 34,008
- Metro
- Sherman-Denison, TX
- Population (ZIP)
- 24,835
- Household income
- $71,605
- Rent vs Own
- Severe rent burden
- 997.0
Population outlook (Grayson County) Hauer SSP2
- Today (2025)
- 134,540 people
- By 2030
- 138,653 · +3.1%
- By 2040
- 145,958 · +8.5%
- By 2050
- 151,218 · +12.4%
- By 2075
- 161,802 · +20.3%
- By 2100
- 159,036 · +18.2%
Race, ethnicity, and origin ACS 2023
- Neighborhood character
- Predominantly White (73%)
- Race & ethnicity
- White 73% Hispanic / Latino 13% Two or more races 9% Black 6%
- Hispanic origin (detail)
- Mexican 11%
- Common ancestry
- Slovak 5% Serbian 2% Portuguese 2%
- Foreign-born
- 4% · Canada
- Languages at home
- 93% English-only · Spanish 6%
Political lean MEDSL · Grayson
- 2024 margin
- Solid R (+54.3) · D 22.5% · R 76.7%
- 2008→2024 swing
- -16.4pp toward R · 2008: -37.9pp · 2024: -54.3pp
- All cycles
- 2024: R+54.3 2020: R+49.9 2016: R+53.1 2012: R+48.0 2008: R+37.9
Not yet ingested
- Civics
- —
Market trends
- HPI YoY
- ▼ -295.96%
- Current HPI
- 257.1806
- Rent YoY
- ▬ 0.05%
- Metro
- Sherman-Denison, TX
- State GDP YoY
- ▲ 3.95%
- F500 in state
- 110
Industry mix (Fortune 500 HQ in TX)
| Industry | F500 HQs | Revenue |
|---|---|---|
| Energy | 16 | $1,198B |
|
||
| Technology | 5 | $198B |
|
||
| Engineering / Construction | 4 | $72B |
|
||
| Energy Services | 3 | $60B |
|
||
| Utilities | 3 | $41B |
|
||
| Healthcare | 2 | $330B |
|
||
Price history
+17995.2% since first listed5 events — show timeline
- 2026-05-14 Listed $190,000 NTREIS
- 2022-06-03 Price Changed $1,050 RENT.
- 2021-12-21 Sold (Public Records) — Public Records
- 2021-12-21 Sold (Public Records) — Public Records
- 1980-01-16 Sold (Public Records) — Public Records
Property tax history
+6.7%/yrLatest (2025): $2,066 · +0.6% YoY. Source: county tax records.
Cash-flow waterfall
monthlySold comps — $/sqft
last 12 mo · ≤1 miLoading sold comps…