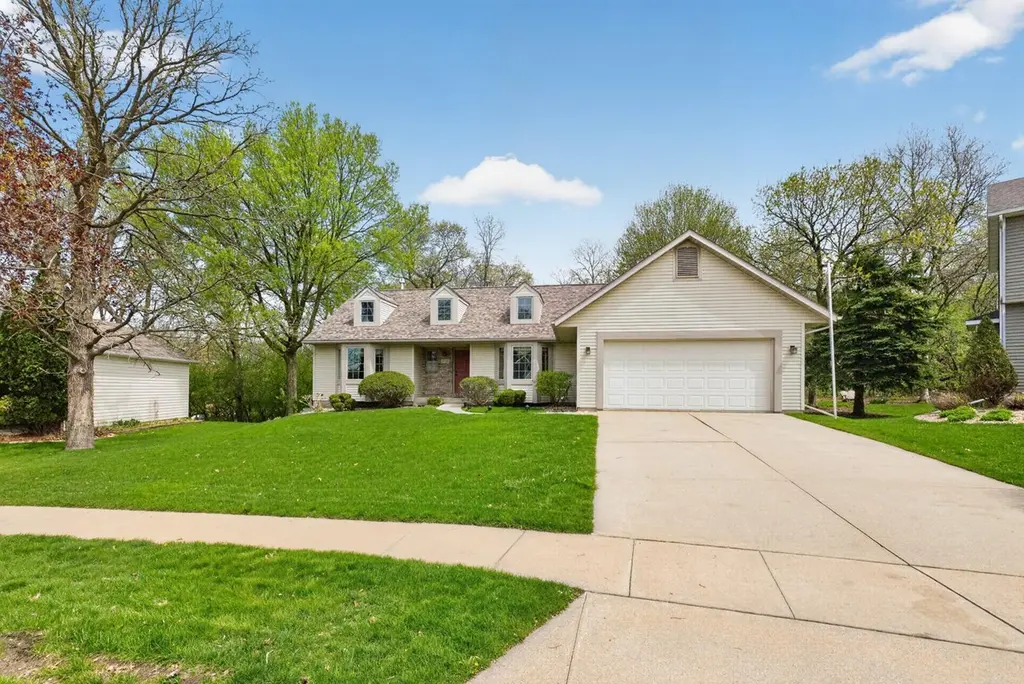
1131 Baird Ln NE · Rochester, MN
Flood risk 1/10 · Minimal
- FEMA flood zone
- X (unshaded)
- Chance of flooding over 30 yrs
- 0.0%
- Est. flood insurance / yr
- $473 – $860
Fire risk 1/10 · Minimal
- Est. fire insurance / yr
- $888 – $1,650
Heat risk 2/10 · Minimal
- Hot days now (above 98°F)
- 7 days/yr
- Hot days in 30 yrs
- 14 days/yr
Wind risk 2/10 · Minimal
- Chance of severe wind over 30 yrs
- —
Air-quality risk 2/10 · Minimal
- Unhealthy air days now
- 1 days/yr
- Unhealthy air days in 30 yrs
- 1 days/yr
Risk factors via First Street. Map © Google.
Why this score? — see what drove the D grade
The composite is a weighted blend of 9 inputs, each scored 0–100. Each bar is that input's sub-score; the figure is the points it added to the 100-point composite (weight × sub-score).
- ARV discount +14.6/15.0
- Cash flow +7.1/30.0
- Rent growth +4.8/5.0
- Livability +4.6/5.0
- Schools +4.1/10.0
- Condition / age +2.5/5.0
- 1% rule +1.5/10.0
- DSCR +1.3/10.0
- Appreciation +0.0/10.0
$489,900
🖨 Deal sheet 📄 Offer letter ✓ Due diligence
Listing remarks
Looking for main floor living? This lovely Viking Hills 3 bedroom, 3 bath ranch style is a gem! With a flat . 46 acre lot, near the end of a cul-de-sac and top of the hill, this well designed, one-owner home has many attractive features: Main floor primary bedroom w/ bath and walk-in closet, main floor laundry, kitchen with stainless appliances, granite countertops and center island. Bay windows in living & dining rooms provide an abundance of natural light and vaulted ceiling creates an open feeling. Main floor den features a wall of built-in cabinets surrounding the cozy 2-sided fireplace. Sip coffee in the screened porch or enjoy nature in the wooded backyard. Back inside, the lo
Key facts
- Walk-in closet
- Flat lot
- Main floor laundry
Tags
Property features AI
Finance
- Other: Not a fractional ownership property
Exterior
- Parking: Attached 2-car garage with concrete floor and automatic garage door opener
- Utilities: City water (connected); City sewer (connected); Natural gas fuel; 150 amp electrical service with circuit breakers
- Home design: Residential property; One level living with lower level finished space; Entry located at top of hill (per directions)
- Construction: Frame construction; Asphalt roof (age 8 years or less); Block foundation (basement)
- Exterior features: Covered screened porch; Stone and vinyl exterior; Medium tree coverage; Publicly maintained road access; Irregular lot shape
Interior
- Kitchen: Kitchen with center island and window; Dishwasher; Disposal; Range; Microwave; Refrigerator; Stainless steel appliances
- Bedrooms: 3 bedrooms (primary suite on main level); Additional bedrooms located on lower level
- Bathrooms: Primary bathroom is a 3/4 bath; One full bathroom in the basement; Half bathroom on the main floor
- Heating & cooling: Forced air heating; Central air conditioning
- Interior features: Vaulted ceilings; Paneled doors; Main floor primary bedroom; Primary bedroom walk-in closet; All living facilities on one level; Main floor bedroom; Main floor laundry; Primary bedroom suite; Separate formal dining room; Two-sided fireplace; Finished basement with daylight/lookout windows, egress window(s), tiled drain and storage space
- Laundry & utility: Main level laundry room; Washer; Dryer; Gas water heater; Humidifier; Owned water softener
Neighborhood map
What this means for you Summary
Snapshot
- This is a 3-bed/2.5-bath single-family listed at $490k.
Deal economics
- At list price, monthly cash flow is $-698 ($-8k/yr) — negative.
- To cash-flow at today's rent, offer at most $367k (25.2% below list).
- To meet the 1% rule (rent ≥ 1% of price), the offer needs to be $320k (34.8% below list).
- Recommended offer: $320k (34.8% below list) — sets the bar for 1% rule.
- Cap rate 4.6% vs local median 3.5% in Rochester — top-decile yield for the area; either an underpriced asset or a hidden risk that comps aren't pricing in. Stress-test before assuming the spread holds.
Location & tenants
- Location reads 92/100 on livability (#1 in MN, #27 nationally) — a professional / high-income tenant draw. Strengths: amenities A+, commute A+, employment A+.
- Rochester Public School District (urban): math 40% / reading 51% proficiency, ranked #152 of 301 in MN (top 50%) — families likely to look elsewhere, expect single-tenant / working-renter base with shorter leases.
- Zoned schools: Century Senior High (math 37% / reading 67%, grade D+, #111 of 471 statewide, top 26%, 1,698 students, 31% FRL) — zoned schools at 31% FRL track the district average.
- Market conditions: Rents rising fast (+9.2%/yr); 218 active listings in the ZIP; 3 comparable units currently listed for rent nearby; rentals leasing fast (median 14d on market — plan ~1-2 weeks tenant-placement turnaround); solid renter incomes; 1,267 units permitted in Olmsted County in 2024 (915 in 5+ unit buildings).
- This rent runs 41% of the median local income ($94k/yr) — at the standard rent-burdened threshold; future hikes will face affordability resistance.
Forward outlook
- Local home prices are declining (-3.0%/yr); year-one equity from $3k of loan paydown is wiped out by about $15k of value loss. Plan a longer hold.
- Olmsted County population projected at +16% by 2050 — long-run rental-demand tailwind backs the buy-and-hold thesis.
Negotiation context
- Only 6 days on market — expect competitive offers; lowballing is unlikely to land.
- Current owner paid $33k; list at $490k implies a 1385% gain — meaningful room to come down on a strong offer.
Questions for the listing agent
- What do current leases actually rent for vs. the listed asking? Can we see a recent rent roll and the last 12 months of T-12 income?
- Is there a deadline driving the sale (1031 exchange, divorce, estate, relocation)? That informs how much negotiation room exists.
- Schools are A-rated — typically a magnet for longer-tenancy family renters. What's the average tenant stay here, and is there a school-zone premium baked into asking?
- The area grade is low — what's the realistic commute time and amenity access for the typical tenant pool here? Any planned neighborhood developments (good or bad) we should know about?
- What's the average days-on-market for RENTAL listings here right now (not sales)? A rising rental-DOM trend means longer vacancies and softer asking-rent achievability than the comps imply.
- What's the recent tenant-quality profile in this submarket — average credit score on applications, eviction rate, late-payment / NSF rate, and stable-employment percentage? A property-management company in the area should have these aggregated.
- How much new for-sale + rental construction is in the pipeline within 1–3 miles? Heavy new supply typically softens prices + rents 12–24 months out; constrained supply supports both.
Investment metrics
- 1% rule
- 0.65% ✗
- Cap rate
- 4.58%
- Cash-on-cash
- -6.11%
- DSCR
- 0.73
- GRM
- 12.8
CMA / ARV
- ARV (median comp)
- $582,000
- List price
- $489,900
- Delta
- -15.82%
- Verdict
- UNDERPRICED
- Comps
- 5 within 1.0 mi
Show comp detail 2 sales within ~0.75 mi
| Address | Dist | Beds/Ba | Sqft | Sold | Price | $/sf | Match |
|---|---|---|---|---|---|---|---|
| 1404 Glendale Hills Dr NE | 0.50mi | 4/3.0 (+1) | 2,850 (+0%) | 6mo | $582,000 | $204 | 64 |
| 1414 Glendale Hills Dr NE | 0.51mi | 4/3.0 (+1) | 2,929 (+3%) | 15mo | $512,000 | $175 | 52 |
Match score weights: distance 35% · size 25% · config 20% · recency 20%. Top-matched comps best support the ARV.
Projected returns pro-forma
-3.0% appreciation · 8.0% rent growth · sell at horizon
- IRR
- -21.7%
- Equity multiple
- 0.22×
- Total profit
- $-107,017
- Equity at exit
- $73,046
- IRR
- -7.1%
- Equity multiple
- 0.46×
- Total profit
- $-73,803
- Equity at exit
- $42,358
Cash invested: $137,172 (down + closing). Projections, not guarantees.
Landlord ↔ Tenant lean methodology
- Overall (STATE)
- 46 Balanced
- State Minnesota
- 46 Balanced · D+2
- County
- — inherits STATE
- City
- — inherits STATE
ZIP-level market 55906
- Home prices YoY
- -33.0%
- Rents YoY
- 9.2%
- Active inventory
- 218
- Price-to-rent
- 12.8×
Monthly cashflow live
- Estimated rent
- $3,195 medium interval (Pro) →
- Mortgage (P&I)
- −$2,569
- Tax from tax record
- −$449 /mo · $5,390/yr
- Insurance
- −$204
- HOA
- −$0
- Vacancy / Maint / Mgmt
- −$671
- Net cashflow
- $-698
Break-even live
UW: 25.0% down · 7.5% · 30yr · 1.5% tax · 5.0% vac · 8.0% maint · 8.0% mgmt
Financing live
Cash to close
- Down payment
- $122,475
- Closing costs
- $14,697
- Reserves months
- —
- Total cash needed
- —
Loan-product check · same deal, 3 products live
Conventional
25% down · 7.5% · 30yr
- Down + closing
- —
- Monthly P&I
- —
- Monthly cashflow
- —
- DSCR
- —
- Eligible?
- —
Personal DTI + credit; lowest rate.
DSCR
20% down · 8.5% · 30yr
- Down + closing
- —
- Monthly P&I
- —
- Monthly cashflow
- —
- DSCR
- —
- Eligible?
- —
No personal income docs; deal must DSCR.
Hard money
10% down · 12.0% · 12mo
- Down + closing
- —
- Monthly P&I
- —
- Monthly cashflow
- —
- DSCR
- —
- Eligible?
- —
Short-term bridge; refi at stabilization.
Rent comps 3 comps
| Address | Beds | Baths | Sqft | Rent | $/sqft | DOM | Units | Dist |
|---|---|---|---|---|---|---|---|---|
| 4033 Cameo Pl NE Rochester, MN | 4.0 | 3.5 | 3480 | $4,900 | $1.41 | 13d | 1 | 0.51mi |
| 2669 Kathleen Ln NE Unit NA Rochester, MN | 4.0 | 3.5 | 3122 | $2,745 | $0.88 | 44d | 1 | 1.18mi |
| 808 Chalet Dr NW Rochester, MN | 4.0 | 3.0 | 2305 | $2,250 | $0.98 | 13d | 1 | 1.47mi |
Listing history 4 events
-
2026-05-06status Pending 996-char remark
-
2026-04-30$489,900 Active 996-char remark
-
1992-03-01soldstatus $33,000
-
1990-07-01soldstatus $40,900
ⓘ Source: listings_history table (triggers on properties + properties_extension) + one-shot
backfill from property_details.listing_events for pre-trigger history.
Tax reassessment forecast MN · Partial reset (capped growth)
- Current annual tax
- $5,390 · $449/mo
- Projected year-2 tax
- $5,438 · $453/mo
- Expected delta
- +$48/yr (+$4/mo · 0.9%)
ⓘ Screening estimate from a state-policy table — verify with the county assessor before closing.
Climate risk First Street
- Flood 1/10 Low FEMA zone X (unshaded) · 0% chance over 30 yrs
- Wildfire 1/10 Low
- Heat 2/10 Low 7 d/yr ≥98°F today · 14 d/yr by 30 yrs out
- Wind 2/10 Low
- Air quality 2/10 Low 1 unhealthy d/yr today · 1 by 30 yrs out
Nearby sold comps map
Loading sold comps map…
Walkable amenities ~0.75 mi
Loading nearby amenities…
Taxation est. · year 1
- Rental income
- $38,343
- − Mortgage interest
- −$27,442
- − Property taxes
- −$5,390
- − Insurance
- −$2,450
- − Repairs & maintenance
- −$3,067
- − Management
- −$3,067
- − Depreciation
- −$14,252
- Taxable loss
- −$17,325
- Est. tax savings @ 24.0%
- +$4,158
- After-tax cash flow
- $-4,220/yr
For passive investors: Depreciation is non-cash, so a rental often shows a tax loss while cash-flowing — sheltering income. Rental losses are passive: they offset passive income freely, and up to $25,000/yr can offset ordinary (W-2) income if you actively participate and your MAGI is under $100k (phasing out to $0 by $150k); unused losses carry forward. On sale, claimed depreciation is recaptured at up to 25%, and gains may owe capital-gains tax (a 1031 exchange can defer both). Figures are a year-1 estimate at your 24.0% rate — not tax advice; consult a CPA.
Schools (NCES district)
- District
- Rochester Public School District
- NCES district ID
- 2731800
- Math proficiency
- 40% ▼ -10.00%
- Reading proficiency
- 51% ▼ -4.00%
- Median HH income
- $66,540
- Composite
- 40.6/100
- National rank
- #3695
- State rank
- #152 of 301 in MN
Livability — Rochester
- Score
- 92/100
- State rank
- #1
- US rank
- #27
Category grades
Schools grade is shown separately in the Schools card above.
Census & demographics
- Census place
- Rochester, MN
- County
- Olmsted County · 135,035 people
- City population
- 135,035
- Metro
- Rochester, MN
- Population (ZIP)
- 20,437
- Household income
- $93,685
- Rent vs Own
- Severe rent burden
- 438.0
Population outlook (Olmsted County) Hauer SSP2
- Today (2025)
- 165,999 people
- By 2030
- 172,425 · +3.9%
- By 2040
- 183,785 · +10.7%
- By 2050
- 192,981 · +16.3%
- By 2075
- 215,284 · +29.7%
- By 2100
- 224,887 · +35.5%
Race, ethnicity, and origin ACS 2023
- Neighborhood character
- Predominantly White (75%)
- Race & ethnicity
- White 75% Asian 8% Black 6% Two or more races 6% Hispanic / Latino 5%
- Common ancestry
- Portuguese 14% Romanian 3% Italian 2%
- Foreign-born
- 11% · China, Canada
- Languages at home
- 86% English-only · Spanish 3% Chinese 3% Other Asian/Pacific 2%
Political lean MEDSL · Olmsted
- 2024 margin
- D (+10.7) · D 54.3% · R 43.6% · Other 2.1%
- 2008→2024 swing
- +7.4pp toward D · 2008: 3.3pp · 2024: 10.7pp
- All cycles
- 2024: D+10.7 2020: D+10.7 2016: D+0.8 2012: D+3.2 2008: D+3.3
Not yet ingested
- Civics
- —
Market trends
- HPI YoY
- ▼ -124.46%
- Current HPI
- 252.9003
- Rent YoY
- ▲ 9.18%
- Metro
- Rochester, MN
- State GDP YoY
- ▲ 2.41%
- F500 in state
- 34
Industry mix (Fortune 500 HQ in MN)
| Industry | F500 HQs | Revenue |
|---|---|---|
| Healthcare | 2 | $407B |
|
||
| Retail | 2 | $150B |
|
||
| Consumer Goods | 2 | $32B |
|
||
| Industrial Machinery | 2 | $6B |
|
||
| Agriculture | 1 | $40B |
|
||
| Healthcare / Medical Devices | 1 | $32B |
|
||
Price history
+1097.8% since first listed4 events — show timeline
- 2026-05-06 Pending — NORTHSTARMLS as Distributed by MLS Grid
- 2026-04-30 Listed $489,900 NORTHSTARMLS as Distributed by MLS Grid
- 1992-03-01 Sold (Public Records) $33,000 Public Records
- 1990-07-01 Sold (Public Records) $40,900 Public Records
Property tax history
+6.1%/yrLatest (2025): $5,390 · +18.6% YoY. Source: county tax records.
Cash-flow waterfall
monthlySold comps — $/sqft
last 12 mo · ≤1 miLoading sold comps…