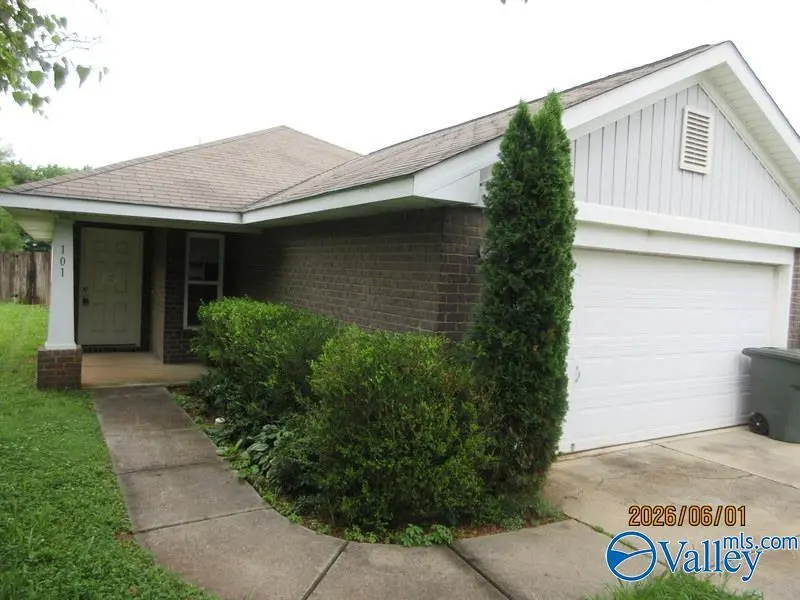
101 Valleyside Dr NE · Huntsville, AL
Flood risk 1/10 · Minimal
- FEMA flood zone
- X (unshaded)
- Chance of flooding over 30 yrs
- 0.0%
- Est. flood insurance / yr
- $507 – $1,088
Fire risk 3/10 · Minor
- Est. fire insurance / yr
- $916 – $1,700
Heat risk 6/10 · Moderate
- Hot days now (above 104°F)
- 7 days/yr
- Hot days in 30 yrs
- 20 days/yr
Wind risk 4/10 · Minor
- Chance of severe wind over 30 yrs
- 22.0%
Air-quality risk 2/10 · Minimal
- Unhealthy air days now
- 1 days/yr
- Unhealthy air days in 30 yrs
- 1 days/yr
Risk factors via First Street. Map © Google.
Why this score? — see what drove the C+ grade
The composite is a weighted blend of 9 inputs, each scored 0–100. Each bar is that input's sub-score; the figure is the points it added to the 100-point composite (weight × sub-score).
- Cash flow +24.1/30.0
- ARV discount +15.0/15.0
- DSCR +7.8/10.0
- 1% rule +5.5/10.0
- Livability +4.1/5.0
- Schools +2.9/10.0
- Rent growth +2.5/5.0
- Condition / age +2.5/5.0
- Appreciation +0.0/10.0
$149,500
🖨 Deal sheet 📄 Offer letter ✓ Due diligence
Listing remarks MLS
3 Beds and 2 baths with a 2-car attached garage and walk-in closets. Separate shower and double vanity in the master suite . Closing costs paid w/use of preferred lender. Photos used are similar to the actual home. Model Open Daily. Ask about our current specials. Adams pays all closing cost with use of preferred lenders.
Key facts
- Double vanity
- Open floor plan
- Easy access
Tags
Property features AI
Finance
- HOA & community: No homeowners association; Subdivision: Valleybrook; Community has curbs
Exterior
- Parking: Attached two-car garage with front-facing garage
- Utilities: Public sewer
- Home design: Single-family residence; One story; Built in 2018
- Construction: Slab foundation
- Exterior features: Front porch; Patio; Curb and gutters; Sidewalk; Corner lot; Public water
Interior
- Kitchen: Range
- Bathrooms: Two full bathrooms
- Heating & cooling: Central heating; Central cooling
- Interior features: Six total rooms
Neighborhood map
What this means for you Summary
Snapshot
- This is a 3-bed/1.0-bath single-family listed at $150k.
Deal economics
- At list price, monthly cash flow is $297 ($4k/yr) — positive.
- The deal already cash-flows at list — no discount required.
- Meets the 1% rule at list price ($2k rent vs $150k).
- Cap rate 8.7% vs local median 3.8% in Huntsville — top-decile yield for the area; either an underpriced asset or a hidden risk that comps aren't pricing in. Stress-test before assuming the spread holds.
Location & tenants
- Location reads 82/100 on livability (#3 in AL, #1,082 nationally) — a professional / high-income tenant draw. Strengths: commute A+, cost of living A+, housing A+; Watch: crime F.
- Huntsville City (urban): math 21% / reading 46% proficiency, ranked #48 of 129 in AL (top 37%) — families likely to look elsewhere, expect single-tenant / working-renter base with shorter leases.
- Zoned schools: Martin Luther King Jr Elementary School (math 4% / reading 18%, grade F, #560 of 627 statewide, top 90%, 464 students, 89% FRL); Chapman Middle School (math 2% / reading 23%, grade F, #216 of 257 statewide, top 86%, 368 students, 88% FRL); Lee High School (math 2% / reading 17%, grade F, #252 of 305 statewide, top 84%, 840 students, 77% FRL) — zoned schools average 85% FRL vs 46% district-wide (38 pts higher); higher-poverty schools than district average — tighter screening recommended.
- Zoned-school proficiency averages 11% at this address vs 34% district-wide (-22 pts) — the specific schools serving this property underperform the Huntsville City average; the district grade overstates school quality for this exact location.
- Market conditions: Rents soft (-0.1%/yr); 337 active listings in the ZIP; 12 comparable units currently listed for rent nearby; rentals lingering (median 44d on market — plan ~5-8 weeks vacancy on turnover, expect pricing pressure); 50% of comp listings sitting > 30 days — soft ceiling on asking rent; 4,709 units permitted in Madison County in 2024 (1,186 in 5+ unit buildings).
- This rent runs 37% of the median local income ($51k/yr) — at the standard rent-burdened threshold; future hikes will face affordability resistance.
Forward outlook
- Local home prices are declining (-3.0%/yr); year-one equity from $1k of loan paydown is wiped out by about $4k of value loss. Plan a longer hold.
- Madison County population projected at +18% by 2050 — long-run rental-demand tailwind backs the buy-and-hold thesis.
Negotiation context
- Only 10 days on market — expect competitive offers; lowballing is unlikely to land.
- 2 sale attempts since 8y ago with the ask held roughly flat each time — persistent listings suggest the price (not the market) is what's stuck; bring a comps-based counter.
Risks & watch-outs
- Climate carrying-cost: extreme-heat days projected 7→20/yr by 2055 (HVAC capex compounding) — expect insurance premiums to compound above CPI over the hold.
Questions for the listing agent
- Is there a deadline driving the sale (1031 exchange, divorce, estate, relocation)? That informs how much negotiation room exists.
- Crime grade is F in this area — have there been break-ins, vandalism, or insurance claims at this property in the last 3 years? What carrier currently insures it and at what premium?
- What's the average days-on-market for RENTAL listings here right now (not sales)? A rising rental-DOM trend means longer vacancies and softer asking-rent achievability than the comps imply.
- What's the recent tenant-quality profile in this submarket — average credit score on applications, eviction rate, late-payment / NSF rate, and stable-employment percentage? A property-management company in the area should have these aggregated.
- How much new for-sale + rental construction is in the pipeline within 1–3 miles? Heavy new supply typically softens prices + rents 12–24 months out; constrained supply supports both.
Investment metrics
- 1% rule
- 1.05% ✓
- Cap rate
- 8.67%
- Cash-on-cash
- 8.50%
- DSCR
- 1.38
- GRM
- 8.0
CMA / ARV
- ARV (on-the-fly)
- $226,512
- Comps found
- 12
Show comp detail 12 sales within ~0.75 mi
| Address | Dist | Beds/Ba | Sqft | Sold | Price | $/sf | Match |
|---|---|---|---|---|---|---|---|
| 265 Valleyside Dr | 0.36mi | 3/2.0 | 1,434 (-1%) | 1mo | $225,000 | $157 | 76 |
| 310 Mertle Dr NE | 0.09mi | 3/2.0 | 1,503 (+4%) | 13mo | $234,900 | $156 | 75 |
| 334 Mertle Dr | 0.21mi | 3/2.0 | 1,457 (+0%) | 14mo | $220,000 | $151 | 74 |
| 345 Ruby Elm Ave NE | 0.42mi | 3/2.0 | 1,475 (+2%) | 2mo | $279,900 | $190 | 72 |
| 259 Valleyside Dr | 0.34mi | 3/1.5 | 1,454 (+0%) | 12mo | $225,000 | $155 | 72 |
| 145 Dormont Dr NE | 0.34mi | 3/2.0 | 1,520 (+5%) | 2mo | $195,000 | $128 | 71 |
| 341 Ruby Elm Ave NE | 0.41mi | 3/2.0 | 1,475 (+2%) | 6mo | $283,400 | $192 | 70 |
| 336 Ruby Elm Ave NE | 0.49mi | 3/2.0 | 1,475 (+2%) | 6mo | $285,900 | $194 | 66 |
| 126 Whitestone Dr NE | 0.42mi | 3/2.0 | 1,328 (-8%) | 1mo | $183,000 | $138 | 61 |
| 343 Ruby Elm Ave NE | 0.48mi | 3/2.0 | 1,558 (+7%) | 2mo | $283,900 | $182 | 60 |
| 127 Whitestone Dr NE | 0.39mi | 3/2.5 | 1,655 (+14%) | 6mo | $204,900 | $124 | 48 |
| 236 Whitestone Dr NE | 0.55mi | 3/2.0 | 1,305 (-10%) | 8mo | $188,000 | $144 | 47 |
Match score weights: distance 35% · size 25% · config 20% · recency 20%. Top-matched comps best support the ARV.
Projected returns pro-forma
-3.0% appreciation · 0.0% rent growth · sell at horizon
- IRR
- -6.6%
- Equity multiple
- 0.76×
- Total profit
- $-9,950
- Equity at exit
- $22,291
- IRR
- -0.9%
- Equity multiple
- 0.95×
- Total profit
- $-2,195
- Equity at exit
- $12,926
Cash invested: $41,860 (down + closing). Projections, not guarantees.
Landlord ↔ Tenant lean methodology
- Overall (STATE)
- 90 Strongly Landlord-Friendly
- State Alabama
- 90 Strongly Landlord-Friendly · R+15
- County
- — inherits STATE
- City
- — inherits STATE
ZIP-level market 35810
- Home prices YoY
- -23.5%
- Rents YoY
- -0.1%
- Active inventory
- 337
- Price-to-rent
- 8.0×
Monthly cashflow live
- Estimated rent
- $1,565 high interval (Pro) →
- Mortgage (P&I)
- −$784
- Tax from tax record
- −$93 /mo · $1,120/yr
- Insurance
- −$62
- HOA
- −$0
- Vacancy / Maint / Mgmt
- −$329
- Net cashflow
- $297
Break-even live
UW: 25.0% down · 7.5% · 30yr · 1.5% tax · 5.0% vac · 8.0% maint · 8.0% mgmt
Financing live
Cash to close
- Down payment
- $37,375
- Closing costs
- $4,485
- Reserves months
- —
- Total cash needed
- —
Loan-product check · same deal, 3 products live
Conventional
25% down · 7.5% · 30yr
- Down + closing
- —
- Monthly P&I
- —
- Monthly cashflow
- —
- DSCR
- —
- Eligible?
- —
Personal DTI + credit; lowest rate.
DSCR
20% down · 8.5% · 30yr
- Down + closing
- —
- Monthly P&I
- —
- Monthly cashflow
- —
- DSCR
- —
- Eligible?
- —
No personal income docs; deal must DSCR.
Hard money
10% down · 12.0% · 12mo
- Down + closing
- —
- Monthly P&I
- —
- Monthly cashflow
- —
- DSCR
- —
- Eligible?
- —
Short-term bridge; refi at stabilization.
Rent comps 12 comps
| Address | Beds | Baths | Sqft | Rent | $/sqft | DOM | Units | Dist |
|---|---|---|---|---|---|---|---|---|
| 114 Whitestone Dr NE Huntsville, AL | 3.0 | 2.0 | 1784 | $1,356 | $0.76 | 44d | 1 | 0.39mi |
| 148 Whitestone Dr NE Huntsville, AL | 3.0 | 2.0 | 1594 | $1,550 | $0.97 | 23d | 1 | 0.42mi |
| 200 Whitestone Dr NE Huntsville, AL | 3.0 | 2.0 | 1300 | $1,525 | $1.17 | 44d | 1 | 0.43mi |
| 228 Dormont Dr NE Huntsville, AL | 3.0 | 2.0 | 1328 | $1,745 | $1.31 | 23d | 1 | 0.46mi |
| 2032 Ricky Rd NW Huntsville, AL | 4.0 | 2.0 | 1181 | $1,523 | $1.29 | 21d | 1 | 0.91mi |
| 133 Ann Bradley Dr Huntsville, AL | 3.0 | 2.0 | 1140 | $1,606 | $1.41 | 44d | 1 | 0.97mi |
| 123 Ann Bradley Dr Huntsville, AL | 3.0 | 2.0 | 1165 | $1,500 | $1.29 | 44d | 1 | 1.06mi |
| 2212 Ricky Rd NW Huntsville, AL | 3.0 | 2.0 | 1539 | $1,400 | $0.91 | 23d | 1 | 1.14mi |
| 6214 Belgrade Dr NW Huntsville, AL | 3.0 | 1.5 | 1350 | $1,095 | $0.81 | 44d | 1 | 1.30mi |
| 6207 Belgrade Dr NW Huntsville, AL | 3.0 | 1.5 | 1050 | $1,395 | $1.33 | 44d | 1 | 1.34mi |
| 6022 Belgrade Dr NW Huntsville, AL | 3.0 | 1.5 | 1015 | $1,320 | $1.30 | 23d | 1 | 1.35mi |
| 2117 Atkins Dr NW Huntsville, AL | 3.0 | 2.0 | 1250 | $1,699 | $1.36 | 23d | 1 | 1.42mi |
Listing history 7 events
-
2026-06-14statusdays on market $149,500 Pending 10 DOM
-
2026-06-10days on market $149,500 Active 8 DOM
-
2026-06-09days on market $149,500 Active 7 DOM
-
2026-06-08days on market $149,500 Active 6 DOM
-
2026-06-07days on market $149,500 Active 5 DOM
-
2026-06-03remarks 466-char remark
-
2026-06-03$149,500 Active 1 DOM
ⓘ Source: listings_history table (triggers on properties + properties_extension) + one-shot
backfill from property_details.listing_events for pre-trigger history.
Tax reassessment forecast AL · Resets to sale price
- Current annual tax
- $1,120 · $93/mo
- Projected year-2 tax
- $1,120 · $93/mo
- Expected delta
- $0/yr ($0/mo · 0.0%)
ⓘ Screening estimate from a state-policy table — verify with the county assessor before closing.
Climate risk First Street
- Flood 1/10 Low FEMA zone X (unshaded) · 0% chance over 30 yrs
- Wildfire 3/10 Moderate
- Heat 6/10 Major 7 d/yr ≥104°F today · 20 d/yr by 30 yrs out
- Wind 4/10 Moderate 22% chance of damaging wind over 30 yrs
- Air quality 2/10 Low 1 unhealthy d/yr today · 1 by 30 yrs out
Nearby sold comps map
Loading sold comps map…
Walkable amenities ~0.75 mi
Loading nearby amenities…
Taxation est. · year 1
- Rental income
- $18,779
- − Mortgage interest
- −$8,374
- − Property taxes
- −$1,120
- − Insurance
- −$748
- − Repairs & maintenance
- −$1,502
- − Management
- −$1,502
- − Depreciation
- −$4,349
- Taxable income
- $1,184
- Est. tax owed @ 24.0%
- −$284
- After-tax cash flow
- $3,276/yr
For passive investors: Depreciation is non-cash, so a rental often shows a tax loss while cash-flowing — sheltering income. Rental losses are passive: they offset passive income freely, and up to $25,000/yr can offset ordinary (W-2) income if you actively participate and your MAGI is under $100k (phasing out to $0 by $150k); unused losses carry forward. On sale, claimed depreciation is recaptured at up to 25%, and gains may owe capital-gains tax (a 1031 exchange can defer both). Figures are a year-1 estimate at your 24.0% rate — not tax advice; consult a CPA.
Schools (NCES district)
- District
- Huntsville City
- NCES district ID
- 0101800
- Math proficiency
- 21% ▼ -23.00%
- Reading proficiency
- 46% ▬ 0.00%
- Median HH income
- $48,264
- Composite
- 28.84/100
- National rank
- #6647
- State rank
- #48 of 129 in AL
Livability — Huntsville
- Score
- 82/100
- State rank
- #3
- US rank
- #1082
Category grades
Schools grade is shown separately in the Schools card above.
Census & demographics
- Census place
- Huntsville, AL
- County
- Madison County · 380,832 people
- City population
- 220,435
- Metro
- Huntsville, AL
- Population (ZIP)
- 32,843
- Household income
- $51,233
- Rent vs Own
- Severe rent burden
- 1223.0
Population outlook (Madison County) Hauer SSP2
- Today (2025)
- 392,086 people
- By 2030
- 409,788 · +4.5%
- By 2040
- 440,557 · +12.4%
- By 2050
- 460,990 · +17.6%
- By 2075
- 502,872 · +28.3%
- By 2100
- 513,623 · +31.0%
Race, ethnicity, and origin ACS 2023
- Neighborhood character
- Predominantly Black (69%)
- Race & ethnicity
- Black 69% White 18% Hispanic / Latino 9% Two or more races 5%
- Hispanic origin (detail)
- Mexican 3% Puerto Rican 2% Dominican 2%
- Common ancestry
- Italian 2% Lithuanian 0%
- Foreign-born
- 6% · Canada
- Languages at home
- 92% English-only · Spanish 7%
Political lean MEDSL · Madison
- 2024 margin
- Lean R (+9.0) · D 44.7% · R 53.7% · Other 1.6%
- 2008→2024 swing
- +6.0pp toward D · 2008: -14.9pp · 2024: -9.0pp
- All cycles
- 2024: R+9.0 2020: R+8.0 2016: R+16.8 2012: R+18.7 2008: R+14.9
Not yet ingested
- Civics
- —
Market trends
- HPI YoY
- ▼ -61.00%
- Current HPI
- 198.9629
- Rent YoY
- ▬ -0.05%
- Metro
- Huntsville, AL
- State GDP YoY
- ▲ 2.94%
- F500 in state
- 4
Industry mix (Fortune 500 HQ in AL)
| Industry | F500 HQs | Revenue |
|---|---|---|
| Financial Services | 1 | $8B |
|
||
| Healthcare | 1 | $5B |
|
||
Price history
+11.7% since first listed3 events — show timeline
- 2026-06-02 Listed $149,500 VMLS
- 2018-07-13 Sold (MLS) $133,900 VMLS
- 2018-05-03 Listed $133,900 VMLS
Property tax history
+17.8%/yrLatest (2024): $1,120 · +16.1% YoY. Source: county tax records.
Cash-flow waterfall
monthlySold comps — $/sqft
last 12 mo · ≤1 miLoading sold comps…