2961 Vineyards Pkwy #1 · Branson, MO
Flood risk 5/10 · Moderate
- FEMA flood zone
- X (unshaded)
- Chance of flooding over 30 yrs
- 0.27%
- Est. flood insurance / yr
- $473 – $860
Fire risk 3/10 · Minor
- Est. fire insurance / yr
- $1,054 – $1,958
Heat risk 5/10 · Moderate
- Hot days now (above 106°F)
- 7 days/yr
- Hot days in 30 yrs
- 20 days/yr
Wind risk 2/10 · Minimal
- Chance of severe wind over 30 yrs
- 0.0%
Air-quality risk 2/10 · Minimal
- Unhealthy air days now
- 0 days/yr
- Unhealthy air days in 30 yrs
- 1 days/yr
Risk factors via First Street. Map © Google.
Why this score? — see what drove the D grade
The composite is a weighted blend of 9 inputs, each scored 0–100. Each bar is that input's sub-score; the figure is the points it added to the 100-point composite (weight × sub-score).
- ARV discount +12.1/15.0
- Cash flow +8.4/30.0
- Schools +4.2/10.0
- Livability +3.9/5.0
- 1% rule +3.8/10.0
- Rent growth +3.2/5.0
- Condition / age +2.5/5.0
- DSCR +2.3/10.0
- Appreciation +0.0/10.0
$209,000
🖨 Deal sheet 📄 Offer letter ✓ Due diligence
Listing remarks MLS
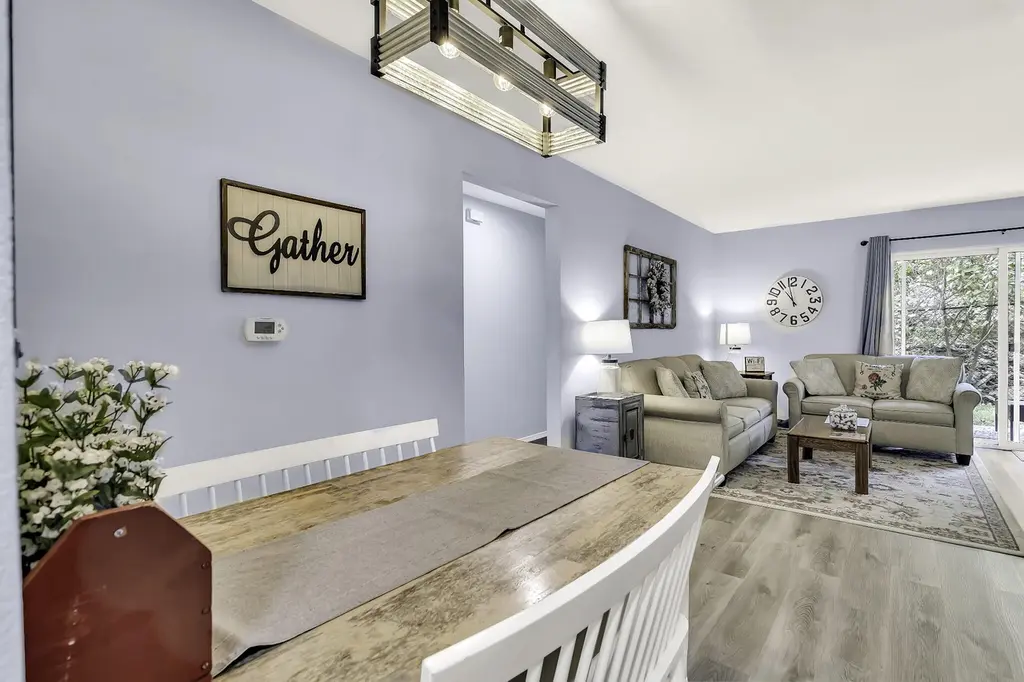
FURNISHED, TURN-KEY, AND READY TO GO! This stylish 3 bed, 2 bath condo offers the perfect blend of comfort and convenience in one of Branson's hottest locations. Whether you're looking for a profitable nightly rental or your own Ozarks retreat, this property delivers! Enjoy luxury vinyl plank flooring, granite countertops, and tasteful furnishings throughout. No restrictions on self-management give you the freedom to run your short-term rental your way. Community amenities include an inground pool and basketball courts, plus you're just minutes from Table Rock Lake, Silver Dollar City, and the Branson Strip. Don't miss out--schedule a showing today!
Key facts
- Close to table rock
- Granite counter tops
- Basketball courts
Tags
Neighborhood map
What this means for you Summary
Snapshot
- This is a 3-bed/2.0-bath condo listed at $209k.
Deal economics
- At list price, monthly cash flow is $-189 ($-2k/yr) — negative.
- To cash-flow at today's rent, offer at most $176k (16.0% below list).
- To meet the 1% rule (rent ≥ 1% of price), the offer needs to be $184k (12.0% below list).
- Recommended offer: $176k (16.0% below list) — sets the bar for cash-flow.
- Cap rate 5.2% vs local median 2.5% in Branson — top-decile yield for the area; either an underpriced asset or a hidden risk that comps aren't pricing in. Stress-test before assuming the spread holds.
Location & tenants
- Location reads 77/100 on livability (#32 in MO, #2,940 nationally) — a middle-class / working-renter tenant base. Strengths: commute A+, cost of living A+, health & safety A+; Watch: employment C-, crime F.
- Branson R-IV (rural): math 48% / reading 52% proficiency, ranked #44 of 324 in MO (top 14%) — acceptable for families but not a draw, mixed tenant base, ~2y average lease.
- Market conditions: Rents rising (+2.9%/yr); 1048 active listings in the ZIP; 5 comparable units currently listed for rent nearby; rentals lingering (median 44d on market — plan ~5-8 weeks vacancy on turnover, expect pricing pressure); 100% of comp listings sitting > 30 days — soft ceiling on asking rent; 331 units permitted in Taney County in 2024 (50 in 5+ unit buildings).
- This rent runs 37% of the median local income ($60k/yr) — at the standard rent-burdened threshold; future hikes will face affordability resistance.
Forward outlook
- Local home prices are declining (-3.0%/yr); year-one equity from $1k of loan paydown is wiped out by about $6k of value loss. Plan a longer hold.
- Taney County population projected at +17% by 2050 — long-run rental-demand tailwind backs the buy-and-hold thesis.
Negotiation context
- It's been on market 319 days — a 12% lower offer ($184k) is reasonable based on typical stale-listing flexibility.
- 4 sale attempts since 6y ago with the ask held roughly flat each time — persistent listings suggest the price (not the market) is what's stuck; bring a comps-based counter.
Risks & watch-outs
- Climate carrying-cost: moderate flood risk; extreme-heat days projected 7→20/yr by 2055 (HVAC capex compounding) — expect insurance premiums to compound above CPI over the hold.
Questions for the listing agent
- What do current leases actually rent for vs. the listed asking? Can we see a recent rent roll and the last 12 months of T-12 income?
- It's been on market 319 days. Have you received any prior offers? Is the seller open to a 16% concession, seller financing, or rate buy-down credit?
- What does the HOA fee cover, when was the last increase, and are there any pending special assessments or reserve-fund shortfalls?
- Any open or pending special assessments — roof, HVAC, plumbing, elevator, façade? What's the per-unit balance and payoff schedule, and is the seller paying it off at close or rolling it to the buyer?
- Why hasn't it sold? Are there any deal-killer items the seller is aware of (foundation, flood, title, zoning, code violations)?
- Is there a deadline driving the sale (1031 exchange, divorce, estate, relocation)? That informs how much negotiation room exists.
- Crime grade is F in this area — have there been break-ins, vandalism, or insurance claims at this property in the last 3 years? What carrier currently insures it and at what premium?
- The area grade is low — what's the realistic commute time and amenity access for the typical tenant pool here? Any planned neighborhood developments (good or bad) we should know about?
- What's the average days-on-market for RENTAL listings here right now (not sales)? A rising rental-DOM trend means longer vacancies and softer asking-rent achievability than the comps imply.
- What's the recent tenant-quality profile in this submarket — average credit score on applications, eviction rate, late-payment / NSF rate, and stable-employment percentage? A property-management company in the area should have these aggregated.
- How much new apartment / multifamily construction is in the pipeline within 1–3 miles? Heavy new supply (>2% of stock underway) typically softens rents 12–24 months out; light construction supports rent growth.
Investment metrics
- 1% rule
- 0.88% ✗
- Cap rate
- 5.21%
- Cash-on-cash
- -3.88%
- DSCR
- 0.83
- GRM
- 9.5
CMA / ARV
- ARV (median comp)
- $232,746
- List price
- $209,000
- Delta
- -10.20%
- Verdict
- UNDERPRICED
- Comps
- 20 within 1.0 mi
Projected returns pro-forma
-3.0% appreciation · 2.9% rent growth · sell at horizon
- IRR
- -22.8%
- Equity multiple
- 0.21×
- Total profit
- $-45,940
- Equity at exit
- $31,163
- IRR
- -17.3%
- Equity multiple
- 0.05×
- Total profit
- $-55,654
- Equity at exit
- $18,071
Cash invested: $58,520 (down + closing). Projections, not guarantees.
Landlord ↔ Tenant lean methodology
- Overall (STATE)
- 81 Strongly Landlord-Friendly
- State Missouri
- 81 Strongly Landlord-Friendly · R+10
- County
- — inherits STATE
- City
- — inherits STATE
ZIP-level market 65616
- Home prices YoY
- -24.3%
- Rents YoY
- 2.9%
- Active inventory
- 1048
- Price-to-rent
- 9.5×
Monthly cashflow live
- Estimated rent
- $1,840 high interval (Pro) →
- Mortgage (P&I)
- −$1,096
- Tax from tax record
- −$195 /mo · $2,335/yr
- Insurance
- −$87
- HOA
- −$265
- Vacancy / Maint / Mgmt
- −$386
- Net cashflow
- $-189
Break-even live
UW: 25.0% down · 7.5% · 30yr · 1.5% tax · 5.0% vac · 8.0% maint · 8.0% mgmt
Financing live
Cash to close
- Down payment
- $52,250
- Closing costs
- $6,270
- Reserves months
- —
- Total cash needed
- —
Loan-product check · same deal, 3 products live
Conventional
25% down · 7.5% · 30yr
- Down + closing
- —
- Monthly P&I
- —
- Monthly cashflow
- —
- DSCR
- —
- Eligible?
- —
Personal DTI + credit; lowest rate.
DSCR
20% down · 8.5% · 30yr
- Down + closing
- —
- Monthly P&I
- —
- Monthly cashflow
- —
- DSCR
- —
- Eligible?
- —
No personal income docs; deal must DSCR.
Hard money
10% down · 12.0% · 12mo
- Down + closing
- —
- Monthly P&I
- —
- Monthly cashflow
- —
- DSCR
- —
- Eligible?
- —
Short-term bridge; refi at stabilization.
Rent comps 5 comps
| Address | Beds | Baths | Sqft | Rent | $/sqft | DOM | Units | Dist |
|---|---|---|---|---|---|---|---|---|
| 2905 Vineyards Pkwy #5 Branson, MO | 3.0 | 2.0 | 1147 | $1,850 | $1.61 | 43d | 1 | 0.10mi |
| 2907 Vineyards Pkwy #2 Branson, MO | 3.0 | 2.0 | 1147 | $1,850 | $1.61 | 43d | 1 | 0.10mi |
| 3515 Arlene St Branson, MO | 2.0 | 2.0 | 880 | $1,025 | $1.16 | 43d | 1 | 0.72mi |
| 513 Lakewood Rd Branson, MO | 3.0 | 3.0 | 1487 | $1,750 | $1.18 | 43d | 1 | 1.04mi |
| 325 Majestic Dr Branson, MO | 1.0–3.0 | 1.0–2.0 | 941 | $1,650 | $1.75 | 43d | 2 | 1.34mi |
HOA detail condo
- Monthly dues
- $265 · $3,180/yr
- Likely covers
- pool
- Assessments
- None detected in remarks — confirm with the listing agent.
Listing history 27 events
-
2026-06-19days on market $209,000 Active 319 DOM
-
2026-06-18days on market $209,000 Active 318 DOM
-
2026-06-17days on market $209,000 Active 317 DOM
-
2026-06-16days on market $209,000 Active 316 DOM
-
2026-06-15days on market $209,000 Active 315 DOM
-
2026-06-14days on market $209,000 Active 313 DOM
-
2026-06-12days on market $209,000 Active 312 DOM
-
2026-06-09days on market $209,000 Active 309 DOM
-
2026-06-08days on market $209,000 Active 308 DOM
-
2026-06-07days on market $209,000 Active 307 DOM
-
2026-06-03days on market $209,000 Active 303 DOM
-
2026-06-02days on market $209,000 Active 302 DOM
-
2026-06-01days on market $209,000 Active 301 DOM
-
2026-05-31days on market $209,000 Active 300 DOM
-
2026-05-30days on market $209,000 Active 299 DOM
-
2025-12-08price $209,000
-
2025-11-06price $209,000 657-char remark
Show marketing remark (657 chars)
FURNISHED, TURN-KEY, AND READY TO GO! This stylish 3 bed, 2 bath condo offers the perfect blend of comfort and convenience in one of Branson's hottest locations. Whether you're looking for a profitable nightly rental or your own Ozarks retreat, this property delivers! Enjoy luxury vinyl plank flooring, granite countertops, and tasteful furnishings throughout. No restrictions on self-management give you the freedom to run your short-term rental your way. Community amenities include an inground pool and basketball courts, plus you're just minutes from Table Rock Lake, Silver Dollar City, and the Branson Strip. Don't miss out--schedule a showing today!
-
2025-08-09$215,000 Active
-
2025-08-04$215,000 Active 657-char remark
Show marketing remark (657 chars)
FURNISHED, TURN-KEY, AND READY TO GO! This stylish 3 bed, 2 bath condo offers the perfect blend of comfort and convenience in one of Branson's hottest locations. Whether you're looking for a profitable nightly rental or your own Ozarks retreat, this property delivers! Enjoy luxury vinyl plank flooring, granite countertops, and tasteful furnishings throughout. No restrictions on self-management give you the freedom to run your short-term rental your way. Community amenities include an inground pool and basketball courts, plus you're just minutes from Table Rock Lake, Silver Dollar City, and the Branson Strip. Don't miss out--schedule a showing today!
-
2022-09-22soldstatus
-
2022-09-19soldstatus Closed
-
2022-08-23status Pending
-
2022-08-18$244,000 Active
-
2020-04-09soldstatus
-
2020-04-08soldstatus
-
2020-04-07soldstatus
-
2020-03-13$89,995
ⓘ Source: listings_history table (triggers on properties + properties_extension) + one-shot
backfill from property_details.listing_events for pre-trigger history.
Tax reassessment forecast MO · Resets to sale price
- Current annual tax
- $2,335 · $195/mo
- Projected year-2 tax
- $2,335 · $195/mo
- Expected delta
- $0/yr ($0/mo · 0.0%)
ⓘ Screening estimate from a state-policy table — verify with the county assessor before closing.
Climate risk First Street
- Flood 5/10 Major FEMA zone X (unshaded) · 27% chance over 30 yrs
- Wildfire 3/10 Moderate
- Heat 5/10 Major 7 d/yr ≥106°F today · 20 d/yr by 30 yrs out
- Wind 2/10 Low 0% chance of damaging wind over 30 yrs
- Air quality 2/10 Low 0 unhealthy d/yr today · 1 by 30 yrs out
Nearby sold comps map
Loading sold comps map…
Walkable amenities ~0.75 mi
Loading nearby amenities…
Taxation est. · year 1
- Rental income
- $22,081
- − Mortgage interest
- −$11,707
- − Property taxes
- −$2,335
- − Insurance
- −$1,045
- − Repairs & maintenance
- −$1,767
- − Management
- −$1,767
- − HOA
- −$3,180
- − Depreciation
- −$6,080
- Taxable loss
- −$5,799
- Est. tax savings @ 24.0%
- +$1,392
- After-tax cash flow
- $-876/yr
For passive investors: Depreciation is non-cash, so a rental often shows a tax loss while cash-flowing — sheltering income. Rental losses are passive: they offset passive income freely, and up to $25,000/yr can offset ordinary (W-2) income if you actively participate and your MAGI is under $100k (phasing out to $0 by $150k); unused losses carry forward. On sale, claimed depreciation is recaptured at up to 25%, and gains may owe capital-gains tax (a 1031 exchange can defer both). Figures are a year-1 estimate at your 24.0% rate — not tax advice; consult a CPA.
Schools (NCES district)
- District
- Branson R-IV
- NCES district ID
- 2905760
- Math proficiency
- 48% ▼ -6.00%
- Reading proficiency
- 52% ▼ -3.00%
- Median HH income
- $41,473
- Composite
- 41.96/100
- National rank
- #3347
- State rank
- #44 of 324 in MO
Livability — Branson
- Score
- 77/100
- State rank
- #32
- US rank
- #2940
Category grades
Schools grade is shown separately in the Schools card above.
Census & demographics
- Census place
- Branson, MO
- County
- Taney County · 28,460 people
- City population
- 28,460
- Metro
- Branson, MO
- Population (ZIP)
- 28,460
- Household income
- $60,489
- Rent vs Own
- Severe rent burden
- 1065.0
Population outlook (Taney County) Hauer SSP2
- Today (2025)
- 59,017 people
- By 2030
- 61,235 · +3.8%
- By 2040
- 65,225 · +10.5%
- By 2050
- 68,842 · +16.6%
- By 2075
- 77,705 · +31.7%
- By 2100
- 82,002 · +38.9%
Race, ethnicity, and origin ACS 2023
- Neighborhood character
- Predominantly White (82%)
- Race & ethnicity
- White 82% Two or more races 10% Hispanic / Latino 10% Black 2% Asian 2%
- Hispanic origin (detail)
- Mexican 6% Puerto Rican 2%
- Common ancestry
- Italian 4% Lithuanian 3% Slovak 2%
- Foreign-born
- 5% · Canada
- Languages at home
- 89% English-only · Spanish 7% Other Indo-European 1% Russian/Polish/Slavic 1%
Political lean MEDSL · Taney
- 2024 margin
- Solid R (+59.3) · D 19.9% · R 79.2%
- 2008→2024 swing
- -22.2pp toward R · 2008: -37.2pp · 2024: -59.3pp
- All cycles
- 2024: R+59.3 2020: R+57.7 2016: R+59.3 2012: R+47.4 2008: R+37.2
Not yet ingested
- Civics
- —
Market trends
- HPI YoY
- ▼ -64.45%
- Current HPI
- 200.8392
- Rent YoY
- ▲ 2.90%
- Metro
- Branson, MO
- State GDP YoY
- ▲ 1.84%
- F500 in state
- 20
Industry mix (Fortune 500 HQ in MO)
| Industry | F500 HQs | Revenue |
|---|---|---|
| Healthcare | 1 | $163B |
|
||
| Insurance | 1 | $21B |
|
||
| Industrial Technology | 1 | $17B |
|
||
| Retail | 1 | $16B |
|
||
| Industrial Distribution | 1 | $10B |
|
||
| Utilities | 1 | $9B |
|
||
Price history
+132.2% since first listed12 events — show timeline
- 2025-12-08 Price Changed $209,000 MARIS as Distributed by MLS Grid
- 2025-11-06 Price Changed $209,000 SOMO
- 2025-08-09 Listed $215,000 MARIS as Distributed by MLS Grid
- 2025-08-04 Listed $215,000 SOMO
- 2022-09-22 Sold (Public Records) — Public Records
- 2022-09-19 Sold (MLS) — SOMO
- 2022-08-23 Pending — SOMO
- 2022-08-18 Listed $244,000 SOMO
- 2020-04-09 Sold (Public Records) — Public Records
- 2020-04-08 Sold (Public Records) — Public Records
- 2020-04-07 Sold (MLS) — SOMO
- 2020-03-13 Listed $89,995 SOMO
Property tax history
+16.2%/yrLatest (2025): $2,335 · +187.0% YoY. Source: county tax records.
Cash-flow waterfall
monthlySold comps — $/sqft
last 12 mo · ≤1 miLoading sold comps…