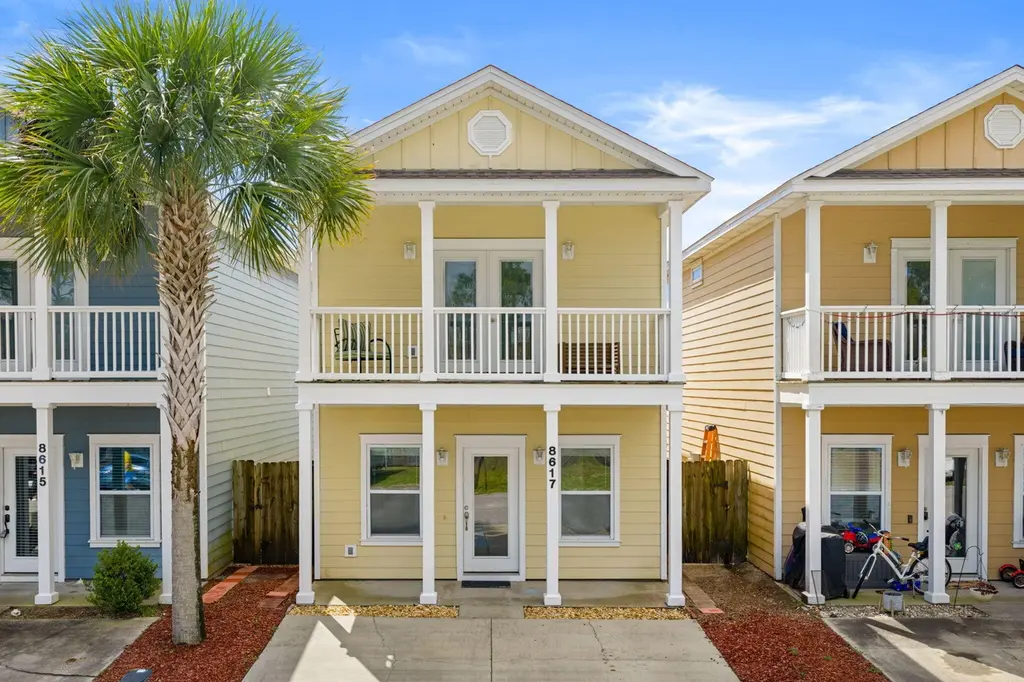
8617 Marlin Pl · Upper Grand Lagoon, FL
Flood risk 1/10 · Minimal
- FEMA flood zone
- X (unshaded)
- Chance of flooding over 30 yrs
- 0.0%
- Est. flood insurance / yr
- $507 – $1,088
Fire risk 4/10 · Minor
- Est. fire insurance / yr
- $947 – $1,759
Heat risk 10/10 · Severe
- Hot days now (above 106°F)
- 7 days/yr
- Hot days in 30 yrs
- 21 days/yr
Wind risk 9/10 · Severe
- Chance of severe wind over 30 yrs
- 99.0%
Air-quality risk 1/10 · Minimal
- Unhealthy air days now
- 0 days/yr
- Unhealthy air days in 30 yrs
- 0 days/yr
Risk factors via First Street. Map © Google.
Why this score? — see what drove the D grade
The composite is a weighted blend of 9 inputs, each scored 0–100. Each bar is that input's sub-score; the figure is the points it added to the 100-point composite (weight × sub-score).
- ARV discount +15.0/15.0
- Cash flow +8.6/30.0
- Schools +4.3/10.0
- Livability +3.4/5.0
- Rent growth +3.1/5.0
- Condition / age +2.5/5.0
- 1% rule +2.4/10.0
- DSCR +2.3/10.0
- Appreciation +0.0/10.0
$320,000
🖨 Deal sheet (PDF) 📄 Offer letter ✓ Due diligence
Listing remarks MLS
Priced to sell, 8617 Marlin Place offers an incredible opportunity to own in a gated community in Panama City Beach. Built in 2015 and recently refreshed with new interior paint, this 3-bedroom, 2.5-bath home features nearly 1,600 square feet of well-designed living space. The primary bedroom is located on the first floor with a walk-in closet and private bath with tiled shower. The open living area offers 9-foot ceilings, and the kitchen includes granite countertops, white shaker cabinetry, and stainless appliances. Upstairs features two additional bedrooms, including one with a private balcony. Community pool and low-maintenance living with HOA covering lawn care, trash, and gated access. Convenient to the Navy base, St. Andrews State Park, and the beach.
Key facts
- Gated community
- Community pool
- Private balcony
Tags
Neighborhood map
What this means for you Summary
Snapshot
- This is a 3-bed/3.0-bath single-family listed at $320k.
Deal economics
- At list price, monthly cash flow is $-278 ($-3k/yr) — negative.
- To cash-flow at today's rent, offer at most $271k (15.3% below list).
- To meet the 1% rule (rent ≥ 1% of price), the offer needs to be $237k (25.9% below list).
- Recommended offer: $237k (25.9% below list) — sets the bar for 1% rule.
- Cap rate 5.3% vs local median 3.2% in Upper Grand Lagoon — top-decile yield for the area; either an underpriced asset or a hidden risk that comps aren't pricing in. Stress-test before assuming the spread holds.
Location & tenants
- Location reads 67/100 on livability (#583 in FL) — a middle-class / working-renter tenant base. Strengths: housing A+, crime A, cost of living B+; Watch: amenities F, commute F, health & safety F.
- Bay (suburban): math 51% / reading 51% proficiency, ranked #29 of 73 in FL (top 40%) — acceptable for families but not a draw, mixed tenant base, ~2y average lease.
- Zoned schools: Breakfast Point Academy (math 62% / reading 57%, grade B-, #690 of 2,144 statewide, top 34%, 1,058 students, 47% FRL); J.R. Arnold High School (math 41% / reading 54%, grade D, #204 of 667 statewide, top 31%, 1,617 students, 36% FRL).
- Market conditions: Rents rising (+2.5%/yr); 1032 active listings in the ZIP; 23 comparable units currently listed for rent nearby; rentals at typical pace (median 15d on market — plan ~3-4 weeks tenant-placement turnaround); solid renter incomes; 2,473 units permitted in Bay County in 2024 (559 in 5+ unit buildings).
- This rent runs 35% of the median local income ($81k/yr) — at the standard rent-burdened threshold; future hikes will face affordability resistance.
Forward outlook
- Local home prices are declining (-3.0%/yr); year-one equity from $2k of loan paydown is wiped out by about $10k of value loss. Plan a longer hold.
- Bay County population projected at +24% by 2050 — long-run rental-demand tailwind backs the buy-and-hold thesis.
Negotiation context
- It's been on market 89 days — a 6% lower offer ($301k) is reasonable based on typical stale-listing flexibility.
Risks & watch-outs
- Climate carrying-cost: severe wind risk, 99% chance of damaging wind over 30y; extreme-heat days projected 7→21/yr by 2055 (HVAC capex compounding) — expect insurance premiums to compound above CPI over the hold.
Questions for the listing agent
- What do current leases actually rent for vs. the listed asking? Can we see a recent rent roll and the last 12 months of T-12 income?
- It's been on market 89 days. Have you received any prior offers? Is the seller open to a 26% concession, seller financing, or rate buy-down credit?
- What does the HOA fee cover, when was the last increase, and are there any pending special assessments or reserve-fund shortfalls?
- Why hasn't it sold? Are there any deal-killer items the seller is aware of (foundation, flood, title, zoning, code violations)?
- Is there a deadline driving the sale (1031 exchange, divorce, estate, relocation)? That informs how much negotiation room exists.
- Schools are D-rated, which usually means shorter tenancies and higher turnover. Who's the typical renter profile here, and what's been the actual vacancy rate?
- The area grade is low — what's the realistic commute time and amenity access for the typical tenant pool here? Any planned neighborhood developments (good or bad) we should know about?
- What's the average days-on-market for RENTAL listings here right now (not sales)? A rising rental-DOM trend means longer vacancies and softer asking-rent achievability than the comps imply.
- What's the recent tenant-quality profile in this submarket — average credit score on applications, eviction rate, late-payment / NSF rate, and stable-employment percentage? A property-management company in the area should have these aggregated.
- How much new for-sale + rental construction is in the pipeline within 1–3 miles? Heavy new supply typically softens prices + rents 12–24 months out; constrained supply supports both.
Investment metrics
- 1% rule
- 0.74% ✗
- Cap rate
- 5.25%
- Cash-on-cash
- -3.72%
- DSCR
- 0.83
- GRM
- 11.3
CMA / ARV
- ARV (median comp)
- $397,190
- List price
- $320,000
- Delta
- -19.43%
- Verdict
- UNDERPRICED
- Comps
- 20 within 1.0 mi
Show comp detail 12 sales within ~0.75 mi
| Address | Dist | Beds/Ba | Sqft | Sold | Price | $/sf | Match |
|---|---|---|---|---|---|---|---|
| 8615 Marlin Pl | 0.00mi | 3/2.5 | 1,536 (0%) | 1mo | $268,000 | $174 | 97 |
| 8611 Marlin Pl | 0.01mi | 3/2.5 | 1,512 (-2%) | 2mo | $267,500 | $177 | 94 |
| 8645 Marlin Pl | 0.06mi | 3/2.5 | 1,458 (-5%) | 3mo | $262,000 | $180 | 84 |
| 8437 Warner Pl | 0.10mi | 3/2.5 | 1,647 (+7%) | 2mo | $400,000 | $243 | 80 |
| 609 Sabal Palm Way | 0.49mi | 3/2.0 | 1,526 (-1%) | 9mo | $415,000 | $272 | 65 |
| 8911 Laird St | 0.33mi | 3/2.0 | 1,594 (+4%) | 13mo | $404,000 | $253 | 64 |
| 198 Laird Cir | 0.41mi | 3/2.0 | 1,613 (+5%) | 13mo | $485,000 | $301 | 58 |
| 218 Hidden Pines Dr | 0.65mi | 3/2.0 | 1,622 (+6%) | 0mo | $385,375 | $238 | 56 |
| 149 Sandollar Dr | 0.48mi | 3/2.0 | 1,412 (-8%) | 6mo | $375,000 | $266 | 55 |
| 9129 Abba Ln | 0.74mi | 3/2.0 | 1,468 (-4%) | 0mo | $420,000 | $286 | 54 |
| 3116 Laurie Ave | 0.66mi | 3/2.0 | 1,594 (+4%) | 6mo | $485,000 | $304 | 54 |
| 1840 Annabellas Dr | 0.58mi | 2/2.5 (-1) | 1,404 (-9%) | 2mo | $190,000 | $135 | 50 |
Match score weights: distance 35% · size 25% · config 20% · recency 20%. Top-matched comps best support the ARV.
Projected returns pro-forma
-3.0% appreciation · 2.55% rent growth · sell at horizon
- IRR
- -23.0%
- Equity multiple
- 0.21×
- Total profit
- $-70,599
- Equity at exit
- $47,713
- IRR
- -18.7%
- Equity multiple
- 0.01×
- Total profit
- $-88,587
- Equity at exit
- $27,668
Cash invested: $89,600 (down + closing). Projections, not guarantees.
Landlord ↔ Tenant lean methodology
- Overall (STATE)
- 87 Strongly Landlord-Friendly
- State Florida
- 87 Strongly Landlord-Friendly · R+3
- County
- — inherits STATE
- City
- — inherits STATE
ZIP-level market 32408
- Rents YoY
- 2.5%
- Active inventory
- 1032
- Price-to-rent
- 11.3×
Monthly cashflow live
- Estimated rent
- $2,370 high interval (Pro) →
- Mortgage (P&I)
- −$1,678
- Tax from tax record
- −$139 /mo · $1,663/yr
- Insurance
- −$133
- HOA
- −$200
- Vacancy / Maint / Mgmt
- −$498
- Net cashflow
- $-278
Break-even live
Sensitivity live
| Price | -10% $-96 | -5% $-187 | +0% $-278 | +5% $-368 | +10% $-459 |
|---|---|---|---|---|---|
| Rent | -10% $-465 | -5% $-371 | +0% $-278 | +5% $-184 | +10% $-90 |
| Rate | -1.0pp $-116 | -0.5pp $-196 | base $-278 | +0.5pp $-360 | +1.0pp $-445 |
UW: 25.0% down · 7.5% · 30yr · 1.5% tax · 5.0% vac · 8.0% maint · 8.0% mgmt
Financing live
Cash to close
- Down payment
- $80,000
- Closing costs
- $9,600
- Reserves months
- —
- Total cash needed
- —
Loan-product check · same deal, 3 products live
Conventional
25% down · 7.5% · 30yr
- Down + closing
- —
- Monthly P&I
- —
- Monthly cashflow
- —
- DSCR
- —
- Eligible?
- —
Personal DTI + credit; lowest rate.
DSCR
20% down · 8.5% · 30yr
- Down + closing
- —
- Monthly P&I
- —
- Monthly cashflow
- —
- DSCR
- —
- Eligible?
- —
No personal income docs; deal must DSCR.
Hard money
10% down · 12.0% · 12mo
- Down + closing
- —
- Monthly P&I
- —
- Monthly cashflow
- —
- DSCR
- —
- Eligible?
- —
Short-term bridge; refi at stabilization.
Rent comps 23 comps
| Address | Beds | Baths | Sqft | Rent | $/sqft | DOM | Units | Dist |
|---|---|---|---|---|---|---|---|---|
| 8604 Whelch Dr Panama City, FL | 1.0–3.0 | 1.0–3.0 | 1087 | $2,950 | $2.71 | 15d | 18 | 0.15mi |
| 8700 Front Beach Rd Panama City Beach, FL | 2.0–3.0 | 2.5 | 1543 | $2,400 | $1.56 | 15d | 2 | 0.35mi |
| 140 Treasure Palm Dr Panama City, FL | 3.0 | 2.0 | 1564 | $2,350 | $1.50 | 23d | 1 | 0.39mi |
| 1744 Annabellas Dr Panama City Beach, FL | 3.0 | 2.5 | 1578 | $2,100 | $1.33 | 15d | 1 | 0.49mi |
| 8551 Panama City Beach Pkwy Panama City Beach, FL | 1.0–3.0 | 1.0–2.0 | 964 | $2,184 | $2.26 | 15d | 12 | 0.50mi |
| 1734 Annabellas Dr Panama City Beach, FL | 3.0 | 2.5 | 1578 | $2,100 | $1.33 | 23d | 1 | 0.51mi |
| 1609 Vecuna Cir Panama City Beach, FL | 3.0 | 2.0 | 1268 | $2,100 | $1.66 | 15d | 1 | 0.53mi |
| 1846 Annabellas Dr Panama City Beach, FL | 2.0 | 2.5 | 1404 | $1,850 | $1.32 | 23d | 1 | 0.55mi |
| 2195 Wilkinson St Panama City, FL | 1.0–3.0 | 1.0–2.0 | 1017 | $2,355 | $2.31 | 15d | 41 | 0.60mi |
| 2110 Sterling Cove Blvd Panama City, FL | 2.0 | 2.0 | 1156 | $1,800 | $1.56 | 23d | 1 | 0.63mi |
| 2917 Allison Ave Panama City Beach, FL | 3.0 | 2.0 | 1592 | $1,700 | $1.07 | 23d | 1 | 0.67mi |
| 2148 Sterling Cove Blvd Unit 1 Panama City Beach, FL | 2.0 | 1.5 | 1152 | $1,695 | $1.47 | 23d | 1 | 0.70mi |
| 8623 N Lagoon Dr Panama City Beach, FL | 2.0 | 2.5 | 1600 | $2,350 | $1.47 | 23d | 1 | 0.89mi |
| 2858 Joan Ave Unit 1523343P Panama City, FL | 4.0 | 3.0 | 1754 | $5,270 | $3.00 | 15d | 1 | 0.91mi |
| 7110 London St Panama City Beach, FL | 2.0–3.0 | 2.5 | 1419 | $2,157 | $1.52 | 15d | 6 | 0.99mi |
| 7682 Shadow Lake Dr Panama City Beach, FL | 3.0 | 2.5 | 1496 | $1,875 | $1.25 | 23d | 1 | 1.02mi |
| 7664 Shadow Lake Dr Unit 1523352P Panama City Beach, FL | 3.0 | 2.0 | 1539 | $3,210 | $2.09 | 15d | 1 | 1.04mi |
| 8715 Surf Dr Unit 1523323P Panama City Beach, FL | 2.0 | 2.0 | 1194 | $5,377 | $4.50 | 15d | 1 | 1.09mi |
| 204 Potters Bluff Dr Panama City Beach, FL | 1.0–3.0 | 1.0–2.0 | 1035 | $1,947 | $1.88 | 15d | 12 | 1.31mi |
| 7813 N Lagoon Dr Panama City, FL | 2.0 | 2.0 | 1060 | $1,900 | $1.79 | 23d | 1 | 1.36mi |
| 7405A Beach Dr Unit 1355031P Panama City Beach, FL | 2.0 | 2.0 | 1291 | $2,124 | $1.65 | 23d | 1 | 1.38mi |
| 9902 S Thomas Dr Unit 1354966P Panama City Beach, FL | 2.0 | 2.0 | 1259 | $1,970 | $1.56 | 15d | 1 | 1.39mi |
| 9815 S Thomas Dr Unit 1523339P Panama City, FL | 3.0 | 2.0 | 1259 | $4,018 | $3.19 | 23d | 1 | 1.43mi |
HOA detail
- Monthly dues
- $200 · $2,400/yr
- Likely covers
- trashlandscapingpoolsecurity
Listing history 19 events
-
2026-06-21days on market $320,000 Active 89 DOM
-
2026-06-19days on market $320,000 Active 87 DOM
-
2026-06-18days on market $320,000 Active 86 DOM
-
2026-06-17days on market $320,000 Active 85 DOM
-
2026-06-16days on market $320,000 Active 84 DOM
-
2026-06-15days on market $320,000 Active 83 DOM
-
2026-06-14days on market $320,000 Active 81 DOM
-
2026-06-13days on market $320,000 Active 80 DOM
-
2026-06-10days on market $320,000 Active 78 DOM
-
2026-06-09days on market $320,000 Active 77 DOM
-
2026-06-08days on market $320,000 Active 76 DOM
-
2026-06-07days on market $320,000 Active 75 DOM
-
2026-06-05days on market $320,000 Active 72 DOM
-
2026-06-03days on market $320,000 Active 71 DOM
-
2026-06-02days on market $320,000 Active 70 DOM
-
2026-06-01days on market $320,000 Active 69 DOM
-
2026-05-31days on market $320,000 Active 68 DOM
-
2026-05-30days on market $320,000 Active 67 DOM
-
2026-03-24$320,000 Active 767-char remark
Show marketing remark (767 chars)
Priced to sell, 8617 Marlin Place offers an incredible opportunity to own in a gated community in Panama City Beach. Built in 2015 and recently refreshed with new interior paint, this 3-bedroom, 2.5-bath home features nearly 1,600 square feet of well-designed living space. The primary bedroom is located on the first floor with a walk-in closet and private bath with tiled shower. The open living area offers 9-foot ceilings, and the kitchen includes granite countertops, white shaker cabinetry, and stainless appliances. Upstairs features two additional bedrooms, including one with a private balcony. Community pool and low-maintenance living with HOA covering lawn care, trash, and gated access. Convenient to the Navy base, St. Andrews State Park, and the beach.
ⓘ Source: listings_history table (triggers on properties + properties_extension) + one-shot
backfill from property_details.listing_events for pre-trigger history.
Tax reassessment forecast FL · Resets to sale price
- Current annual tax
- $1,663 · $139/mo
- Projected year-2 tax
- $2,656 · $221/mo
- Expected delta
- +$993/yr (+$83/mo · 59.7%)
ⓘ Screening estimate from a state-policy table — verify with the county assessor before closing.
Climate risk First Street
- Flood 1/10 Low FEMA zone X (unshaded) · 0% chance over 30 yrs
- Wildfire 4/10 Moderate
- Heat 10/10 Extreme 7 d/yr ≥106°F today · 21 d/yr by 30 yrs out
- Wind 9/10 Extreme 99% chance of damaging wind over 30 yrs
- Air quality 1/10 Low 0 unhealthy d/yr today · 0 by 30 yrs out
Nearby sold comps map
Loading sold comps map…
Walkable amenities ~0.75 mi
Loading nearby amenities…
Taxation est. · year 1
- Rental income
- $28,444
- − Mortgage interest
- −$17,925
- − Property taxes
- −$1,663
- − Insurance
- −$1,600
- − Repairs & maintenance
- −$2,276
- − Management
- −$2,276
- − HOA
- −$2,400
- − Depreciation
- −$9,309
- Taxable loss
- −$9,005
- Est. tax savings @ 24.0%
- +$2,161
- After-tax cash flow
- $-1,169/yr
For passive investors: Depreciation is non-cash, so a rental often shows a tax loss while cash-flowing — sheltering income. Rental losses are passive: they offset passive income freely, and up to $25,000/yr can offset ordinary (W-2) income if you actively participate and your MAGI is under $100k (phasing out to $0 by $150k); unused losses carry forward. On sale, claimed depreciation is recaptured at up to 25%, and gains may owe capital-gains tax (a 1031 exchange can defer both). Figures are a year-1 estimate at your 24.0% rate — not tax advice; consult a CPA.
Schools (NCES district)
- District
- Bay
- NCES district ID
- 1200090
- Math proficiency
- 51% ▼ -8.00%
- Reading proficiency
- 51% ▼ -7.00%
- Median HH income
- $47,740
- Composite
- 43.41/100
- National rank
- #3014
- State rank
- #29 of 73 in FL
Livability — Upper Grand Lagoon
- Score
- 67/100
- State rank
- #583
- US rank
- #11085
Category grades
Schools grade is shown separately in the Schools card above.
Census & demographics
- Census place
- Upper Grand Lagoon, FL
- County
- Bay County · 163,593 people
- City population
- 50,689
- Metro
- Panama City, FL
- Population (ZIP)
- 18,832
- Household income
- $80,822
- Rent vs Own
- Severe rent burden
- 817.0
Population outlook (Bay County) Hauer SSP2
- Today (2025)
- 206,264 people
- By 2030
- 217,740 · +5.6%
- By 2040
- 238,738 · +15.7%
- By 2050
- 255,545 · +23.9%
- By 2075
- 288,295 · +39.8%
- By 2100
- 288,638 · +39.9%
Race, ethnicity, and origin ACS 2023
- Neighborhood character
- Predominantly White (81%)
- Race & ethnicity
- White 81% Hispanic / Latino 7% Two or more races 6% Black 3% Asian 2%
- Hispanic origin (detail)
- Mexican 2% Puerto Rican 2%
- Common ancestry
- Romanian 4% Lithuanian 4% Italian 2%
- Foreign-born
- 11% · Canada, South Korea
- Languages at home
- 88% English-only · Spanish 5% Russian/Polish/Slavic 4% Tagalog/Filipino 1%
Political lean MEDSL · Bay
- 2024 margin
- Solid R (+47.4) · D 25.8% · R 73.1% · Other 1.1%
- 2008→2024 swing
- -6.6pp toward R · 2008: -40.7pp · 2024: -47.4pp
- All cycles
- 2024: R+47.4 2020: R+43.5 2016: R+46.3 2012: R+43.6 2008: R+40.7
Not yet ingested
- Civics
- —
Market trends
- HPI YoY
- ▼ -202.52%
- Current HPI
- 246.9126
- Rent YoY
- ▲ 2.55%
- Metro
- Panama City, FL
- State GDP YoY
- ▲ 3.28%
- F500 in state
- 36
Industry mix (Fortune 500 HQ in FL)
| Industry | F500 HQs | Revenue |
|---|---|---|
| Industrial Technology | 2 | $29B |
|
||
| Insurance | 2 | $17B |
|
||
| Retail | 1 | $60B |
|
||
| Technology Distribution | 1 | $58B |
|
||
| Homebuilding | 1 | $35B |
|
||
| Technology Manufacturing | 1 | $35B |
|
||
Price history
1 event — show timeline
- 2026-03-24 Listed $320,000 ECAR
Property tax history
+32.5%/yrLatest (2025): $1,663 · +3.5% YoY. Source: county tax records.
Cash-flow waterfall
monthlySold comps — $/sqft
last 12 mo · ≤1 miLoading sold comps…