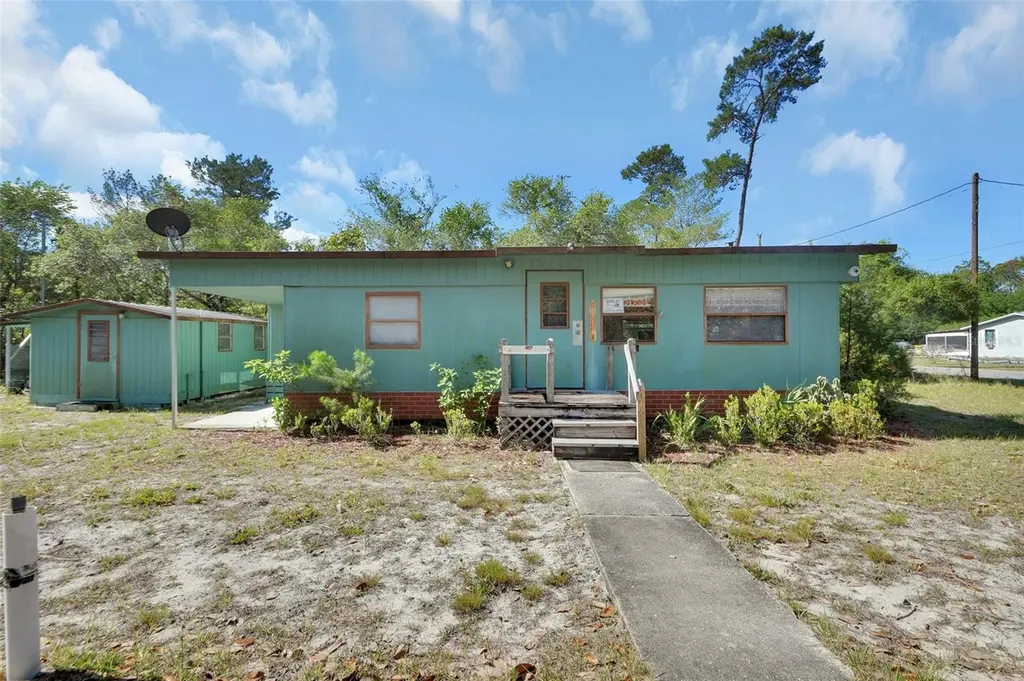
45742 Ohio St · Lake Kathryn, FL
Flood risk 1/10 · Minimal
- FEMA flood zone
- X (unshaded)
- Chance of flooding over 30 yrs
- 0.0%
- Est. flood insurance / yr
- $507 – $1,088
Fire risk 4/10 · Minor
- Est. fire insurance / yr
- $947 – $1,759
Heat risk 9/10 · Severe
- Hot days now (above 107°F)
- 7 days/yr
- Hot days in 30 yrs
- 22 days/yr
Wind risk 9/10 · Severe
- Chance of severe wind over 30 yrs
- 99.0%
Air-quality risk 2/10 · Minimal
- Unhealthy air days now
- 1 days/yr
- Unhealthy air days in 30 yrs
- 1 days/yr
Risk factors via First Street. Map © Google.
Why this score? — see what drove the B grade
The composite is a weighted blend of 9 inputs, each scored 0–100. Each bar is that input's sub-score; the figure is the points it added to the 100-point composite (weight × sub-score).
- Cash flow +30.0/30.0
- 1% rule +10.0/10.0
- DSCR +10.0/10.0
- Appreciation +10.0/10.0
- Schools +4.2/10.0
- Rent growth +2.5/5.0
- Condition / age +2.5/5.0
- Livability +2.3/5.0
- ARV discount +0.0/15.0
$79,900
🖨 Deal sheet (PDF) 📄 Offer letter ✓ Due diligence
Listing remarks
Under contract-accepting backup offers. One or more photo(s) has been virtually staged. Country Fixer Opportunity on Nearly Half an Acre ! Looking for a peaceful slice of the countryside with room to make it your own? This vintage 2-bedroom, 1-bath manufactured home sits on approximately 0.49 acres in a beautifully wooded setting filled with natural wildlife. (This Lot can be split if a person wanted to build another home) This 735 sq ft home is full of character and ready for someone with vision. The possibilities here are endless—whether you’re looking for a renovation project, investment property, or a quiet getaway spot for the Winter or the weekend, this is the place! Prope
Key facts
- 0.49 acre lot
- Built 1968
- Listed 22 days
Property features AI
Finance
- Other: Property type: Residential - Mobile Home; Lot: approximately 0.49 acre (200 x 107), level, private, in county, paved; Number of lots: 3; Has additional parcels; Zoning: R-7; Number of wells: 1; Number of septics: 1; Furnished
- HOA & community: No association
Exterior
- Parking: Public maintained paved road access
- Utilities: Well water; Septic tank; Broadband/high-speed internet available
- Home design: Residential mobile home (single wide); Attached property; One story; Faces east
- Construction: Metal siding and frame construction; Metal roof; Pillar/post/pier foundation; Built as a fixer
- Exterior features: Storage; Shed(s)
Interior
- Kitchen: Range; Refrigerator
- Bedrooms: 2 bedrooms
- Flooring: Carpet; Linoleum
- Bathrooms: 1 full bathroom
- Heating & cooling: No central heating; Wall/window AC units
- Interior features: Ceiling fans; Eat-in kitchen; Living room/dining room combo; Open floorplan
- Laundry & utility: Laundry room; Outside laundry
Neighborhood map
What this means for you Summary
Snapshot
- This is a 2-bed/1.0-bath manufactured listed at $80k.
Deal economics
- At list price, monthly cash flow is $645 ($8k/yr) — positive.
- The deal already cash-flows at list — no discount required.
- Meets the 1% rule at list price ($2k rent vs $80k).
- Recommended offer: $79k (1.5% below list) — sets the bar for market timing.
Location & tenants
- Location reads 46/100 on livability (#896 in FL) — a working-class tenant base; expect higher turnover. Strengths: crime A, cost of living B; Watch: amenities F, commute F, employment F.
- Lake (suburban): math 49% / reading 50% proficiency, ranked #37 of 73 in FL (top 51%) — families likely to look elsewhere, expect single-tenant / working-renter base with shorter leases.
- Zoned schools: Spring Creek Charter School (math 45% / reading 44%, grade F, #1,288 of 2,144 statewide, top 62%, 630 students, 100% FRL, charter); Umatilla Middle School (math 58% / reading 46%, grade C+, #217 of 571 statewide, top 40%, 595 students, 57% FRL); Umatilla High School (math 24% / reading 29%, grade F, #489 of 667 statewide, top 74%, 861 students, 51% FRL) — zoned schools average 69% FRL vs 49% district-wide (20 pts higher); higher-poverty schools than district average — tighter screening recommended.
- Market conditions: 85 active listings in the ZIP; 4,799 units permitted in Lake County in 2024 (814 in 5+ unit buildings).
Forward outlook
- In year one you build about $9k of equity ($552 loan paydown + $8k appreciation (10.0% local appreciation)).
- Lake County population projected at +37% by 2050 — long-run rental-demand tailwind backs the buy-and-hold thesis.
- At projected returns (10.0% appreciation + 3.0% rent growth), your $22k cash investment doubles in ~2 years — after that, you're playing with house money.
- By year 4, paydown + projected appreciation supports a ~$30k cash-out refi (75% LTV) — recoverable capital for the next deal without selling this one.
Negotiation context
- It's been on market 22 days — a 2% lower offer ($79k) is reasonable based on typical stale-listing flexibility.
- Current owner paid $9k; list at $80k implies a 759% gain — meaningful room to come down on a strong offer.
Risks & watch-outs
- Climate carrying-cost: severe wind risk, 99% chance of damaging wind over 30y; extreme-heat days projected 7→22/yr by 2055 (HVAC capex compounding) — expect insurance premiums to compound above CPI over the hold.
Questions for the listing agent
- Built in 1968 — when were the roof, HVAC, electrical panel, plumbing, and water heater last replaced?
- Is there a deadline driving the sale (1031 exchange, divorce, estate, relocation)? That informs how much negotiation room exists.
- Schools are F-rated, which usually means shorter tenancies and higher turnover. Who's the typical renter profile here, and what's been the actual vacancy rate?
- What's the average days-on-market for RENTAL listings here right now (not sales)? A rising rental-DOM trend means longer vacancies and softer asking-rent achievability than the comps imply.
- What's the recent tenant-quality profile in this submarket — average credit score on applications, eviction rate, late-payment / NSF rate, and stable-employment percentage? A property-management company in the area should have these aggregated.
- How much new for-sale + rental construction is in the pipeline within 1–3 miles? Heavy new supply typically softens prices + rents 12–24 months out; constrained supply supports both.
Investment metrics
- 1% rule
- 1.88% ✓
- Cap rate
- 15.99%
- Cash-on-cash
- 34.62%
- DSCR
- 2.54
- GRM
- 4.4
CMA / ARV
- ARV (on-the-fly)
- $54,168
- Comps found
- 3
Show comp detail 3 sales within ~0.75 mi
| Address | Dist | Beds/Ba | Sqft | Sold | Price | $/sf | Match |
|---|---|---|---|---|---|---|---|
| 27721 Nancy Ave | 0.47mi | 2/1.0 | 644 (-12%) | 5mo | $40,000 | $62 | 54 |
| 28710 County Road 42 | 0.72mi | 2/1.0 | 784 (+7%) | 5mo | $65,000 | $83 | 50 |
| 45411 Carolina St | 0.55mi | 2/1.0 | 672 (-8%) | 14mo | $49,900 | $74 | 49 |
Match score weights: distance 35% · size 25% · config 20% · recency 20%. Top-matched comps best support the ARV.
Projected returns pro-forma
10.0% appreciation · 3.0% rent growth · sell at horizon
- IRR
- 50.8%
- Equity multiple
- 4.78×
- Total profit
- $84,637
- Equity at exit
- $71,980
- IRR
- 44.5%
- Equity multiple
- 10.70×
- Total profit
- $216,950
- Equity at exit
- $155,228
Cash invested: $22,372 (down + closing). Projections, not guarantees.
Landlord ↔ Tenant lean methodology
- Overall (STATE)
- 87 Strongly Landlord-Friendly
- State Florida
- 87 Strongly Landlord-Friendly · R+3
- County
- — inherits STATE
- City
- — inherits STATE
ZIP-level market 32767
- Home prices YoY
- 3.0%
- Active inventory
- 85
- Price-to-rent
- 4.4×
Monthly cashflow live
- Estimated rent
- $1,504 medium interval (Pro) →
- Mortgage (P&I)
- −$419
- Tax from tax record
- −$90 /mo · $1,084/yr
- Insurance
- −$33
- HOA
- −$0
- Vacancy / Maint / Mgmt
- −$316
- Net cashflow
- $645
Break-even live
Sensitivity live
| Price | -10% $691 | -5% $668 | +0% $645 | +5% $623 | +10% $600 |
|---|---|---|---|---|---|
| Rent | -10% $527 | -5% $586 | +0% $645 | +5% $705 | +10% $764 |
| Rate | -1.0pp $686 | -0.5pp $666 | base $645 | +0.5pp $625 | +1.0pp $604 |
UW: 25.0% down · 7.5% · 30yr · 1.5% tax · 5.0% vac · 8.0% maint · 8.0% mgmt
Financing live
Cash to close
- Down payment
- $19,975
- Closing costs
- $2,397
- Reserves months
- —
- Total cash needed
- —
Loan-product check · same deal, 3 products live
Conventional
25% down · 7.5% · 30yr
- Down + closing
- —
- Monthly P&I
- —
- Monthly cashflow
- —
- DSCR
- —
- Eligible?
- —
Personal DTI + credit; lowest rate.
DSCR
20% down · 8.5% · 30yr
- Down + closing
- —
- Monthly P&I
- —
- Monthly cashflow
- —
- DSCR
- —
- Eligible?
- —
No personal income docs; deal must DSCR.
Hard money
10% down · 12.0% · 12mo
- Down + closing
- —
- Monthly P&I
- —
- Monthly cashflow
- —
- DSCR
- —
- Eligible?
- —
Short-term bridge; refi at stabilization.
Listing history 2 events
-
2026-05-06$79,900 Active
-
1979-01-01soldstatus $9,300
ⓘ Source: listings_history table (triggers on properties + properties_extension) + one-shot
backfill from property_details.listing_events for pre-trigger history.
Tax reassessment forecast FL · Resets to sale price
- Current annual tax
- $1,084 · $90/mo
- Projected year-2 tax
- $1,084 · $90/mo
- Expected delta
- $0/yr ($0/mo · 0.0%)
ⓘ Screening estimate from a state-policy table — verify with the county assessor before closing.
Climate risk First Street
- Flood 1/10 Low FEMA zone X (unshaded) · 0% chance over 30 yrs
- Wildfire 4/10 Moderate
- Heat 9/10 Extreme 7 d/yr ≥107°F today · 22 d/yr by 30 yrs out
- Wind 9/10 Extreme 99% chance of damaging wind over 30 yrs
- Air quality 2/10 Low 1 unhealthy d/yr today · 1 by 30 yrs out
Nearby sold comps map
Loading sold comps map…
Walkable amenities ~0.75 mi
Loading nearby amenities…
Taxation est. · year 1
- Rental income
- $18,045
- − Mortgage interest
- −$4,476
- − Property taxes
- −$1,084
- − Insurance
- −$400
- − Repairs & maintenance
- −$1,444
- − Management
- −$1,444
- − Depreciation
- −$2,324
- Taxable income
- $6,875
- Est. tax owed @ 24.0%
- −$1,650
- After-tax cash flow
- $6,095/yr
For passive investors: Depreciation is non-cash, so a rental often shows a tax loss while cash-flowing — sheltering income. Rental losses are passive: they offset passive income freely, and up to $25,000/yr can offset ordinary (W-2) income if you actively participate and your MAGI is under $100k (phasing out to $0 by $150k); unused losses carry forward. On sale, claimed depreciation is recaptured at up to 25%, and gains may owe capital-gains tax (a 1031 exchange can defer both). Figures are a year-1 estimate at your 24.0% rate — not tax advice; consult a CPA.
Schools (NCES district)
- District
- Lake
- NCES district ID
- 1201050
- Math proficiency
- 49% ▼ -7.00%
- Reading proficiency
- 50% ▼ -4.00%
- Median HH income
- $46,632
- Composite
- 42.05/100
- National rank
- #3327
- State rank
- #37 of 73 in FL
Livability — Lake Kathryn
- Score
- 46/100
- State rank
- #896
- US rank
- #26433
Category grades
Schools grade is shown separately in the Schools card above.
Census & demographics
- Census place
- Lake Kathryn, FL
- Population (ZIP)
- 2,839
Population outlook (Lake County) Hauer SSP2
- Today (2025)
- 386,640 people
- By 2030
- 417,107 · +7.9%
- By 2040
- 476,676 · +23.3%
- By 2050
- 531,296 · +37.4%
- By 2075
- 648,303 · +67.7%
- By 2100
- 698,530 · +80.7%
Race, ethnicity, and origin ACS 2023
- Neighborhood character
- Predominantly White (96%)
- Race & ethnicity
- White 96% Hispanic / Latino 2% Two or more races 1%
- Common ancestry
- Italian 3% Russian 3% Lithuanian 1%
- Foreign-born
- 1%
- Languages at home
- 98% English-only · Spanish 2%
Political lean MEDSL · Lake
- 2024 margin
- Strong R (+24.7) · D 37.3% · R 62.0%
- 2008→2024 swing
- -11.2pp toward R · 2008: -13.5pp · 2024: -24.7pp
- All cycles
- 2024: R+24.7 2020: R+20.0 2016: R+23.1 2012: R+17.1 2008: R+13.5
Not yet ingested
- Civics
- —
Market trends
- HPI YoY
- ▲ 11.00%
- Current HPI
- 372.7
- Rent YoY
- —
- Metro
- —
- State GDP YoY
- ▲ 3.28%
- F500 in state
- 36
Industry mix (Fortune 500 HQ in FL)
| Industry | F500 HQs | Revenue |
|---|---|---|
| Industrial Technology | 2 | $29B |
|
||
| Insurance | 2 | $17B |
|
||
| Retail | 1 | $60B |
|
||
| Technology Distribution | 1 | $58B |
|
||
| Homebuilding | 1 | $35B |
|
||
| Technology Manufacturing | 1 | $35B |
|
||
Price history
+759.1% since first listed2 events — show timeline
- 2026-05-06 Listed $79,900 Stellar MLS as Distributed by MLS Grid
- 1979-01-01 Sold (Public Records) $9,300 Public Records
Property tax history
+17.1%/yrLatest (2025): $1,084 · +1.2% YoY. Source: county tax records.
Cash-flow waterfall
monthlySold comps — $/sqft
last 12 mo · ≤1 miLoading sold comps…