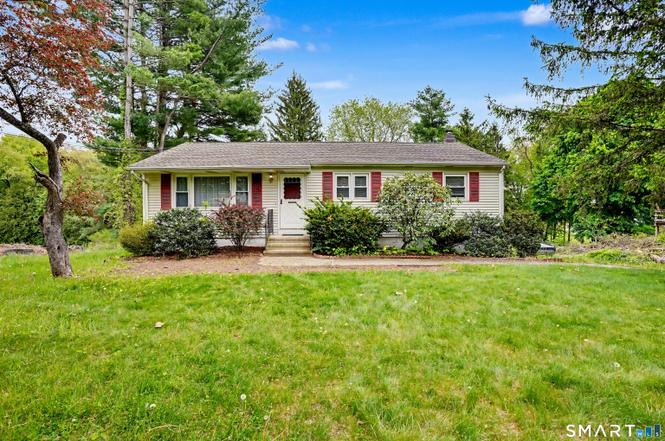
39 Sullivan Rd · New Milford, CT
Flood risk 1/10 · Minimal
- FEMA flood zone
- X
- Chance of flooding over 30 yrs
- 0.0%
- Est. flood insurance / yr
- $473 – $860
Fire risk 1/10 · Minimal
- Est. fire insurance / yr
- $829 – $1,539
Heat risk 5/10 · Moderate
- Hot days now (above 98°F)
- 7 days/yr
- Hot days in 30 yrs
- 15 days/yr
Wind risk 4/10 · Minor
- Chance of severe wind over 30 yrs
- 21.0%
Air-quality risk 3/10 · Minor
- Unhealthy air days now
- 3 days/yr
- Unhealthy air days in 30 yrs
- 4 days/yr
Risk factors via First Street. Map © Google.
Why this score? — see what drove the C- grade
The composite is a weighted blend of 9 inputs, each scored 0–100. Each bar is that input's sub-score; the figure is the points it added to the 100-point composite (weight × sub-score).
- Cash flow +16.7/30.0
- ARV discount +15.0/15.0
- DSCR +5.2/10.0
- Livability +4.3/5.0
- 1% rule +4.2/10.0
- Schools +3.6/10.0
- Rent growth +2.5/5.0
- Condition / age +2.5/5.0
- Appreciation +0.0/10.0
$369,000
🖨 Deal sheet 📄 Offer letter ✓ Due diligence
Listing remarks
* * Highest and Best due by Monday May 18 at 11 am. * * Welcome to 39 Sullivan Rd. This three bedroom, ranch-style home, is conveniently located in southern New Milford just off of Route 7 making commuting as easy as possible. The finished lower level adds 500 SqFt. Additional features include a one-car garage, enclosed back deck and central air conditioning. Whether you are looking for a nice starter home or downsizing, this home is ready for you. Close to schools, shopping, restaraunts and more. Estate. Home is being sold "As is". Please make offer out to: Estate of Anthony M Marsicano on Standard Form Real Estate Contract with the wording: "Subject to Probate Tax Clear
Key facts
- Close to schools
- Close to restaurants
- Enclosed back deck
Tags
Property features AI
Exterior
- Parking: Under-house garage (1 car)
- Utilities: Private well water; Septic sewage system; Oil fuel tank located in garage
- Home design: Single-family home
- Construction: Frame construction; Vinyl siding; Asphalt shingle roof; Concrete foundation; White exterior color
- Exterior features: Gutters; Covered deck; Lightly wooded, sloping lot
Interior
- Kitchen: Oven/Range; Microwave; Refrigerator; Dishwasher
- Bedrooms: 3 bedrooms
- Bathrooms: 1 full bathroom
- Heating & cooling: Hot water heat powered by oil; Central air; Electric domestic hot water
- Interior features: Auto garage door opener; Partial, heated basement with interior access and garage access; Partially finished basement with some liveable space and a partial walk-out; Attic with hatch access
- Laundry & utility: Washer and Dryer; Laundry located in the garage (lower level)
Neighborhood map
What this means for you Summary
Snapshot
- This is a 3-bed/1.0-bath single-family listed at $369k.
Deal economics
- At list price, monthly cash flow is $228 ($3k/yr) — positive.
- The deal already cash-flows at list — no discount required.
- To meet the 1% rule (rent ≥ 1% of price), the offer needs to be $338k (8.4% below list).
- Recommended offer: $338k (8.4% below list) — sets the bar for 1% rule.
- Cap rate 7.0% vs local median 3.6% in New Milford — top-decile yield for the area; either an underpriced asset or a hidden risk that comps aren't pricing in. Stress-test before assuming the spread holds.
Location & tenants
- Location reads 86/100 on livability (#2 in CT, #371 nationally) — a professional / high-income tenant draw. Strengths: crime A+, commute A+, housing A+; Watch: cost of living C-, amenities D-.
- New Milford School District (suburban): math 29% / reading 47% proficiency, ranked #100 of 153 in CT (top 65%) — families likely to look elsewhere, expect single-tenant / working-renter base with shorter leases; only 15% free/reduced lunch — higher-income household profile.
- Zoned schools: Hill And Plain School (377 students, 47% FRL); New Milford High School (math 33% / reading 62%, grade D, #91 of 194 statewide, top 47%, 1,247 students, 31% FRL) — zoned schools average 39% FRL vs 15% district-wide (24 pts higher); higher-poverty schools than district average — tighter screening recommended.
- Market conditions: 147 active listings in the ZIP; 4 comparable units currently listed for rent nearby; rentals lingering (median 44d on market — plan ~5-8 weeks vacancy on turnover, expect pricing pressure); 75% of comp listings sitting > 30 days — soft ceiling on asking rent; solid renter incomes; 1,151 units permitted in Western Connecticut Planning Region in 2024 (714 in 5+ unit buildings).
- This rent runs 39% of the median local income ($104k/yr) — at the standard rent-burdened threshold; future hikes will face affordability resistance.
Forward outlook
- Local home prices are declining (-3.0%/yr); year-one equity from $3k of loan paydown is wiped out by about $11k of value loss. Plan a longer hold.
Negotiation context
- It's been on market 35 days — a 3% lower offer ($358k) is reasonable based on typical stale-listing flexibility.
- Current owner paid $236k; list at $369k implies a 56% gain — meaningful room to come down on a strong offer.
Risks & watch-outs
- Climate carrying-cost: extreme-heat days projected 7→15/yr by 2055 (HVAC capex compounding) — expect insurance premiums to compound above CPI over the hold.
Questions for the listing agent
- It's been on market 35 days. Have you received any prior offers? Is the seller open to a 8% concession, seller financing, or rate buy-down credit?
- Built in 1962 — when were the roof, HVAC, electrical panel, plumbing, and water heater last replaced?
- Is there a deadline driving the sale (1031 exchange, divorce, estate, relocation)? That informs how much negotiation room exists.
- What's the average days-on-market for RENTAL listings here right now (not sales)? A rising rental-DOM trend means longer vacancies and softer asking-rent achievability than the comps imply.
- What's the recent tenant-quality profile in this submarket — average credit score on applications, eviction rate, late-payment / NSF rate, and stable-employment percentage? A property-management company in the area should have these aggregated.
- How much new for-sale + rental construction is in the pipeline within 1–3 miles? Heavy new supply typically softens prices + rents 12–24 months out; constrained supply supports both.
Investment metrics
- 1% rule
- 0.92% ✗
- Cap rate
- 7.03%
- Cash-on-cash
- 2.65%
- DSCR
- 1.12
- GRM
- 9.1
CMA / ARV
- ARV (median comp)
- $498,526
- List price
- $369,000
- Delta
- -25.98%
- Verdict
- UNDERPRICED
- Comps
- 20 within 1.0 mi
Show comp detail 2 sales within ~0.75 mi
| Address | Dist | Beds/Ba | Sqft | Sold | Price | $/sf | Match |
|---|---|---|---|---|---|---|---|
| 27 Lanesville Rd | 0.51mi | 3/2.0 | 1,290 (+13%) | 1mo | $435,000 | $337 | 50 |
| 134 Lone Oak Dr | 0.63mi | 3/1.0 | 1,212 (+6%) | 22mo | $420,000 | $347 | 42 |
Match score weights: distance 35% · size 25% · config 20% · recency 20%. Top-matched comps best support the ARV.
Projected returns pro-forma
-3.0% appreciation · 3.0% rent growth · sell at horizon
- IRR
- -12.1%
- Equity multiple
- 0.56×
- Total profit
- $-45,303
- Equity at exit
- $55,019
- IRR
- -3.0%
- Equity multiple
- 0.80×
- Total profit
- $-20,830
- Equity at exit
- $31,904
Cash invested: $103,320 (down + closing). Projections, not guarantees.
Landlord ↔ Tenant lean methodology
- Overall (STATE)
- 27 Tenant-Leaning
- State Connecticut
- 27 Tenant-Leaning · D+7
- County
- — inherits STATE
- City
- — inherits STATE
ZIP-level market 06776
- Active inventory
- 147
- Price-to-rent
- 9.1×
Monthly cashflow live
- Estimated rent
- $3,381 medium interval (Pro) →
- Mortgage (P&I)
- −$1,935
- Tax from tax record
- −$354 /mo · $4,252/yr
- Insurance
- −$154
- HOA
- −$0
- Vacancy / Maint / Mgmt
- −$710
- Net cashflow
- $228
Break-even live
UW: 25.0% down · 7.5% · 30yr · 1.5% tax · 5.0% vac · 8.0% maint · 8.0% mgmt
Financing live
Cash to close
- Down payment
- $92,250
- Closing costs
- $11,070
- Reserves months
- —
- Total cash needed
- —
Loan-product check · same deal, 3 products live
Conventional
25% down · 7.5% · 30yr
- Down + closing
- —
- Monthly P&I
- —
- Monthly cashflow
- —
- DSCR
- —
- Eligible?
- —
Personal DTI + credit; lowest rate.
DSCR
20% down · 8.5% · 30yr
- Down + closing
- —
- Monthly P&I
- —
- Monthly cashflow
- —
- DSCR
- —
- Eligible?
- —
No personal income docs; deal must DSCR.
Hard money
10% down · 12.0% · 12mo
- Down + closing
- —
- Monthly P&I
- —
- Monthly cashflow
- —
- DSCR
- —
- Eligible?
- —
Short-term bridge; refi at stabilization.
Rent comps 4 comps
| Address | Beds | Baths | Sqft | Rent | $/sqft | DOM | Units | Dist |
|---|---|---|---|---|---|---|---|---|
| 123 Willow Spgs #123 New Milford, CT | 2.0 | 1.0 | 1025 | $2,325 | $2.27 | 43d | 1 | 0.91mi |
| 7 Haviland Rd New Milford, CT | 2.0 | 2.0 | 1127 | $3,050 | $2.71 | 3d | 1 | 0.95mi |
| 67 Lake Lillinonah Rd N Bridgewater, CT | 2.0 | 1.5 | 1152 | $3,500 | $3.04 | 43d | 1 | 1.45mi |
| 75 Lake Lillinonah Rd N Bridgewater, CT | 2.0 | 2.0 | 1344 | $7,500 | $5.58 | 43d | 1 | 1.48mi |
Listing history 17 events
-
2026-06-17status $369,000 Under Contract 35 DOM
-
2026-06-16days on market $369,000 Under Contract - Continue to Show 35 DOM
-
2026-06-15days on market $369,000 Under Contract - Continue to Show 34 DOM
-
2026-06-14days on market $369,000 Under Contract - Continue to Show 32 DOM
-
2026-06-13days on market $369,000 Under Contract - Continue to Show 31 DOM
-
2026-06-10days on market $369,000 Under Contract - Continue to Show 29 DOM
-
2026-06-09days on market $369,000 Under Contract - Continue to Show 28 DOM
-
2026-06-08days on market $369,000 Under Contract - Continue to Show 27 DOM
-
2026-06-07days on market $369,000 Under Contract - Continue to Show 26 DOM
-
2026-06-05days on market $369,000 Under Contract - Continue to Show 23 DOM
-
2026-06-03days on market $369,000 Under Contract - Continue to Show 22 DOM
-
2026-06-02days on market $369,000 Under Contract - Continue to Show 21 DOM
-
2026-06-01days on market $369,000 Under Contract - Continue to Show 20 DOM
-
2026-05-31days on market $369,000 Under Contract - Continue to Show 19 DOM
-
2026-05-30days on market $369,000 Under Contract - Continue to Show 18 DOM
-
2026-05-02$369,000 Active 499-char remark
-
2010-09-10soldstatus $236,500
ⓘ Source: listings_history table (triggers on properties + properties_extension) + one-shot
backfill from property_details.listing_events for pre-trigger history.
Tax reassessment forecast CT · Partial reset (capped growth)
- Current annual tax
- $4,252 · $354/mo
- Projected year-2 tax
- $6,074 · $506/mo
- Expected delta
- +$1,822/yr (+$152/mo · 42.9%)
ⓘ Screening estimate from a state-policy table — verify with the county assessor before closing.
Climate risk First Street
- Flood 1/10 Low FEMA zone X · 0% chance over 30 yrs
- Wildfire 1/10 Low
- Heat 5/10 Major 7 d/yr ≥98°F today · 15 d/yr by 30 yrs out
- Wind 4/10 Moderate 21% chance of damaging wind over 30 yrs
- Air quality 3/10 Moderate 3 unhealthy d/yr today · 4 by 30 yrs out
Nearby sold comps map
Loading sold comps map…
Walkable amenities ~0.75 mi
Loading nearby amenities…
Taxation est. · year 1
- Rental income
- $40,571
- − Mortgage interest
- −$20,670
- − Property taxes
- −$4,252
- − Insurance
- −$1,845
- − Repairs & maintenance
- −$3,246
- − Management
- −$3,246
- − Depreciation
- −$10,735
- Taxable loss
- −$3,422
- Est. tax savings @ 24.0%
- +$821
- After-tax cash flow
- $3,554/yr
For passive investors: Depreciation is non-cash, so a rental often shows a tax loss while cash-flowing — sheltering income. Rental losses are passive: they offset passive income freely, and up to $25,000/yr can offset ordinary (W-2) income if you actively participate and your MAGI is under $100k (phasing out to $0 by $150k); unused losses carry forward. On sale, claimed depreciation is recaptured at up to 25%, and gains may owe capital-gains tax (a 1031 exchange can defer both). Figures are a year-1 estimate at your 24.0% rate — not tax advice; consult a CPA.
Schools (NCES district)
- District
- New Milford School District
- NCES district ID
- 0902850
- Math proficiency
- 29% ▼ -22.00%
- Reading proficiency
- 47% ▼ -11.00%
- Median HH income
- $81,576
- Composite
- 35.78/100
- National rank
- #4839
- State rank
- #100 of 153 in CT
Livability — New Milford
- Score
- 86/100
- State rank
- #2
- US rank
- #371
Category grades
Schools grade is shown separately in the Schools card above.
Census & demographics
- County
- Litchfield County · 81,203 people
- City population
- 27,010
- Metro
- Torrington, CT
- Population (ZIP)
- 27,010
- Household income
- $104,112
- Rent vs Own
- Severe rent burden
- 627.0
Population outlook (Western Connecticut County) Hauer SSP2
- By 2040
- 685,031
Race, ethnicity, and origin ACS 2023
- Neighborhood character
- Predominantly White (77%)
- Race & ethnicity
- White 77% Hispanic / Latino 12% Two or more races 7% Black 4% Asian 4%
- Hispanic origin (detail)
- Puerto Rican 4% Dominican 2%
- Common ancestry
- Romanian 4% Lithuanian 3% Italian 2%
- Foreign-born
- 12% · Canada, China
- Languages at home
- 86% English-only · Spanish 6% Other Indo-European 3% Chinese 1%
Political lean MEDSL · Western Connecticut
- 2024 margin
- D (+19.1) · D 58.8% · R 39.7% · Other 1.6%
- All cycles
- 2024: D+19.1
Not yet ingested
- Civics
- —
Market trends
- HPI YoY
- ▼ -264.52%
- Current HPI
- 305.6036
- Rent YoY
- —
- Metro
- Torrington, CT
- State GDP YoY
- ▲ 1.06%
- F500 in state
- 38
Industry mix (Fortune 500 HQ in CT)
| Industry | F500 HQs | Revenue |
|---|---|---|
| Industrial Machinery | 4 | $38B |
|
||
| Insurance | 3 | $71B |
|
||
| Financial Services | 2 | $25B |
|
||
| Transportation / Logistics | 2 | $18B |
|
||
| Healthcare | 1 | $247B |
|
||
| Telecommunications | 1 | $55B |
|
||
Price history
+56.0% since first listed4 events — show timeline
- 2026-06-16 Pending — Smart MLS
- 2026-05-19 Contingent — Smart MLS
- 2026-05-02 Listed $369,000 Smart MLS
- 2010-09-10 Sold (Public Records) $236,500 Public Records
Property tax history
+1.0%/yrLatest (2023): $4,252 · +2.2% YoY. Source: county tax records.
Cash-flow waterfall
monthlySold comps — $/sqft
last 12 mo · ≤1 miLoading sold comps…