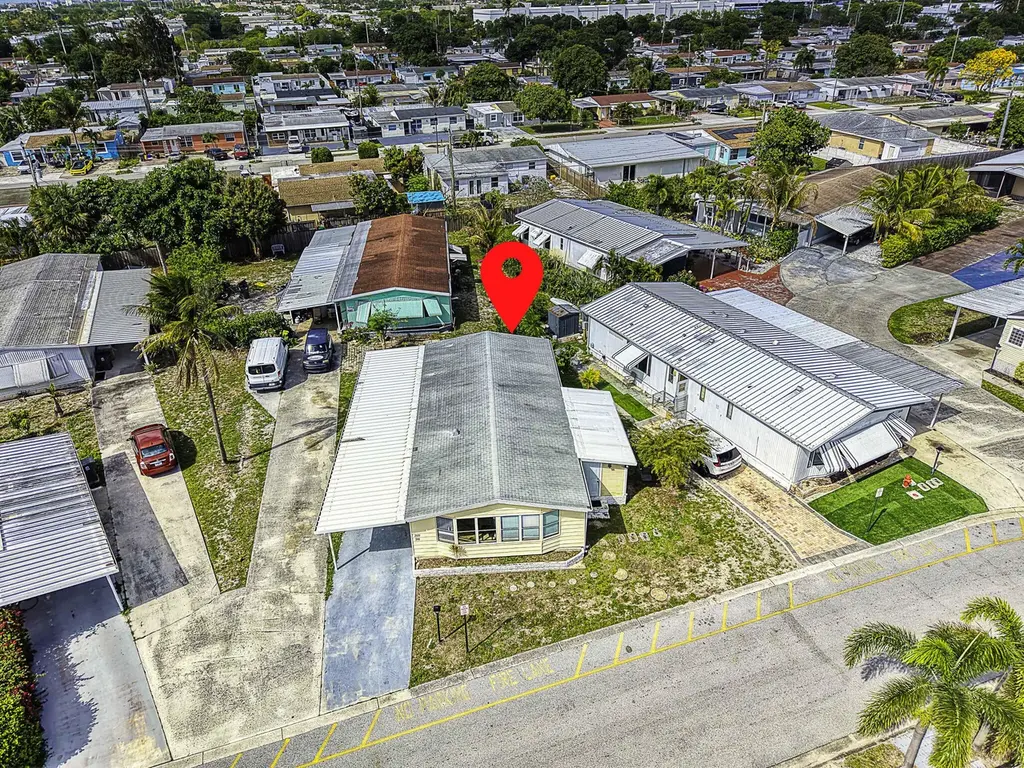
2681 Riviera Blvd · Westgate, FL
Flood risk 4/10 · Minor
- FEMA flood zone
- X (unshaded)
- Chance of flooding over 30 yrs
- 0.22%
- Est. flood insurance / yr
- $507 – $1,088
Fire risk 1/10 · Minimal
- Est. fire insurance / yr
- $947 – $1,759
Heat risk 9/10 · Severe
- Hot days now (above 105°F)
- 7 days/yr
- Hot days in 30 yrs
- 23 days/yr
Wind risk 10/10 · Severe
- Chance of severe wind over 30 yrs
- 99.0%
Air-quality risk 2/10 · Minimal
- Unhealthy air days now
- 1 days/yr
- Unhealthy air days in 30 yrs
- 1 days/yr
Risk factors via First Street. Map © Google.
Why this score? — see what drove the B grade
The composite is a weighted blend of 9 inputs, each scored 0–100. Each bar is that input's sub-score; the figure is the points it added to the 100-point composite (weight × sub-score).
- Cash flow +30.0/30.0
- 1% rule +10.0/10.0
- DSCR +10.0/10.0
- ARV discount +7.5/15.0
- Schools +4.3/10.0
- Condition / age +3.8/5.0
- Livability +3.6/5.0
- Rent growth +2.5/5.0
- Appreciation +0.0/10.0
$135,000
🖨 Deal sheet (PDF) 📄 Offer letter ✓ Due diligence
Listing remarks
Centrally located with easy access to main roads, schools and shopping. Low monthly payment. Carport with space for 3 to 4 cars.
Key facts
- 4 parking spots
- Community pool
- Built 1983
Property features AI
Finance
- Financial info: Land lease in place (monthly $1,070) — lease expires 2026-03-31; Pets allowed with breed restrictions
- HOA & community: Community amenities include fitness center, game room, pool, spa/hot tub, and street lights; Association monthly fee: $1,070 (includes grounds maintenance, trash, recreation facility, and pool service)
Exterior
- Parking: Attached carport; Carport with 3 covered spaces (4 total parking spaces)
- Utilities: Public water; Public sewer; Electricity available; Water available
- Home design: Manufactured home; Double wide; One story; Model: Glen; Faces south
- Construction: Aluminum siding; Metal siding; Metal frame construction; Mobile width 48
- Exterior features: Corner lot; Zero lot line; Shingle roof; Aluminum skirt
Interior
- Kitchen: Microwave; Refrigerator; Electric cooktop
- Bedrooms: One bedroom on the main level
- Flooring: Laminate flooring; Wood flooring
- Bathrooms: Three full bathrooms (one on the main level)
- Heating & cooling: Central electric heating; Electric cooling
- Interior features: Partially furnished; Electric water heater; Microwave; Refrigerator; Electric cooktop
- Laundry & utility: Laundry room; Outside laundry access
Neighborhood map
What this means for you Summary
Snapshot
- This is a 4-bed/3.0-bath manufactured listed at $135k. Condition is rated good.
Deal economics
- At list price, monthly cash flow is $818 ($10k/yr) — positive.
- The deal already cash-flows at list — no discount required.
- Meets the 1% rule at list price ($4k rent vs $135k).
- Recommended offer: $133k (1.5% below list) — sets the bar for market timing.
Location & tenants
- Location reads 72/100 on livability (#328 in FL) — a middle-class / working-renter tenant base. Strengths: cost of living A+, housing A+, health & safety A+; Watch: amenities F, commute F, employment F.
- Palm Beach (suburban): math 46% / reading 53% proficiency, ranked #34 of 73 in FL (top 47%) — families likely to look elsewhere, expect single-tenant / working-renter base with shorter leases.
- Zoned schools: Belvedere Elementary School (math 33% / reading 37%, grade F, #1,697 of 2,144 statewide, top 80%, 477 students, 79% FRL); Jeaga Middle School (math 18% / reading 30%, grade F, #532 of 571 statewide, top 94%, 941 students, 78% FRL); Palm Beach Lakes High School (math 17% / reading 26%, grade F, #546 of 667 statewide, top 82%, 2,688 students, 70% FRL) — zoned schools average 76% FRL vs 52% district-wide (24 pts higher); higher-poverty schools than district average — tighter screening recommended.
- Zoned-school proficiency averages 27% at this address vs 50% district-wide (-23 pts) — the specific schools serving this property underperform the Palm Beach average; the district grade overstates school quality for this exact location.
- Market conditions: Rents soft (-0.1%/yr); 194 active listings in the ZIP; 13 comparable units currently listed for rent nearby; rentals at typical pace (median 21d on market — plan ~3-4 weeks tenant-placement turnaround); 3,974 units permitted in Palm Beach County in 2024 (1,012 in 5+ unit buildings).
- At $3,571/mo this rent would consume 64% of the median local household income ($67k/yr) (locally 1333% of renters already pay >50% of income on rent) — very limited rent-growth headroom before tenants either downsize or default.
Forward outlook
- Local home prices are declining (-3.0%/yr); year-one equity from $933 of loan paydown is wiped out by about $4k of value loss. Plan a longer hold.
- Palm Beach County population projected at +30% by 2050 — long-run rental-demand tailwind backs the buy-and-hold thesis.
- At projected returns (-3.0% appreciation + 0.0% rent growth), your $38k cash investment doubles in ~7 years — after that, you're playing with house money.
Negotiation context
- It's been on market 29 days — a 2% lower offer ($133k) is reasonable based on typical stale-listing flexibility.
Risks & watch-outs
- Watch-outs: HOA is 30% of rent.
- Climate carrying-cost: severe wind risk, 99% chance of damaging wind over 30y; extreme-heat days projected 7→23/yr by 2055 (HVAC capex compounding) — expect insurance premiums to compound above CPI over the hold.
Questions for the listing agent
- What does the HOA fee cover, when was the last increase, and are there any pending special assessments or reserve-fund shortfalls?
- Is there a deadline driving the sale (1031 exchange, divorce, estate, relocation)? That informs how much negotiation room exists.
- What's the average days-on-market for RENTAL listings here right now (not sales)? A rising rental-DOM trend means longer vacancies and softer asking-rent achievability than the comps imply.
- What's the recent tenant-quality profile in this submarket — average credit score on applications, eviction rate, late-payment / NSF rate, and stable-employment percentage? A property-management company in the area should have these aggregated.
- How much new for-sale + rental construction is in the pipeline within 1–3 miles? Heavy new supply typically softens prices + rents 12–24 months out; constrained supply supports both.
Investment metrics
- 1% rule
- 2.65% ✓
- Cap rate
- 13.56%
- Cash-on-cash
- 25.97%
- DSCR
- 2.16
- GRM
- 3.2
CMA / ARV
No comps found within radius.
Projected returns pro-forma
-3.0% appreciation · 0.0% rent growth · sell at horizon
- IRR
- 14.4%
- Equity multiple
- 1.54×
- Total profit
- $20,473
- Equity at exit
- $20,129
- IRR
- 19.2%
- Equity multiple
- 2.25×
- Total profit
- $47,364
- Equity at exit
- $11,672
Cash invested: $37,800 (down + closing). Projections, not guarantees.
Landlord ↔ Tenant lean methodology
- Overall (STATE)
- 87 Strongly Landlord-Friendly
- State Florida
- 87 Strongly Landlord-Friendly · R+3
- County
- — inherits STATE
- City
- — inherits STATE
ZIP-level market 33409
- Home prices YoY
- -25.6%
- Rents YoY
- -0.1%
- Active inventory
- 194
- Price-to-rent
- 3.2×
Monthly cashflow live
- Estimated rent
- $3,571 high interval (Pro) →
- Mortgage (P&I)
- −$708
- Tax est. 1.5%
- −$169 /mo · $2,025/yr
- Insurance
- −$56
- HOA
- −$1,070
- Vacancy / Maint / Mgmt
- −$750
- Net cashflow
- $818
Break-even live
Sensitivity live
| Price | -10% $911 | -5% $865 | +0% $818 | +5% $771 | +10% $725 |
|---|---|---|---|---|---|
| Rent | -10% $536 | -5% $677 | +0% $818 | +5% $959 | +10% $1,100 |
| Rate | -1.0pp $886 | -0.5pp $852 | base $818 | +0.5pp $783 | +1.0pp $747 |
UW: 25.0% down · 7.5% · 30yr · 1.5% tax · 5.0% vac · 8.0% maint · 8.0% mgmt
Financing live
Cash to close
- Down payment
- $33,750
- Closing costs
- $4,050
- Reserves months
- —
- Total cash needed
- —
Loan-product check · same deal, 3 products live
Conventional
25% down · 7.5% · 30yr
- Down + closing
- —
- Monthly P&I
- —
- Monthly cashflow
- —
- DSCR
- —
- Eligible?
- —
Personal DTI + credit; lowest rate.
DSCR
20% down · 8.5% · 30yr
- Down + closing
- —
- Monthly P&I
- —
- Monthly cashflow
- —
- DSCR
- —
- Eligible?
- —
No personal income docs; deal must DSCR.
Hard money
10% down · 12.0% · 12mo
- Down + closing
- —
- Monthly P&I
- —
- Monthly cashflow
- —
- DSCR
- —
- Eligible?
- —
Short-term bridge; refi at stabilization.
Rent comps 13 comps
| Address | Beds | Baths | Sqft | Rent | $/sqft | DOM | Units | Dist |
|---|---|---|---|---|---|---|---|---|
| 2018 Whitney Rd West Palm Beach, FL | 3.0 | 2.0 | 1169 | $3,100 | $2.65 | 0d | 1 | 0.20mi |
| 2016 Kenwood Rd West Palm Beach, FL | 4.0 | 2.0 | 1172 | $3,900 | $3.33 | 21d | 1 | 0.20mi |
| 2117 Longwood Rd West Palm Beach, FL | 4.0 | 2.0 | 1112 | $5,000 | $4.50 | 25d | 1 | 0.20mi |
| 2615 Hiawatha Ave West Palm Beach, FL | 3.0 | 2.0 | 1276 | $2,950 | $2.31 | 4d | 1 | 0.86mi |
| 2665 Hiawatha Ave West Palm Beach, FL | 3.0 | 2.0 | 1276 | $3,005 | $2.36 | 25d | 1 | 0.87mi |
| 2671 Hiawatha Ave West Palm Beach, FL | 3.0 | 2.0 | 1276 | $3,005 | $2.36 | 25d | 1 | 0.88mi |
| 2677 Hiawatha Ave West Palm Beach, FL | 3.0 | 2.0 | 1276 | $3,005 | $2.36 | 25d | 1 | 0.88mi |
| 2683 Hiawatha Ave West Palm Beach, FL | 3.0 | 2.0 | 1276 | $3,005 | $2.36 | 25d | 1 | 0.88mi |
| 2689 Hiawatha Ave West Palm Beach, FL | 3.0 | 2.0 | 1276 | $2,950 | $2.31 | 4d | 1 | 0.89mi |
| 904 Ortega Rd West Palm Beach, FL | 3.0 | 1.0 | 910 | $3,500 | $3.85 | 6d | 1 | 1.29mi |
| 833 Ardmore Rd West Palm Beach, FL | 3.0 | 2.5 | 1132 | $4,500 | $3.98 | 18d | 1 | 1.32mi |
| 833 Ardmore Rd West Palm Beach, FL | 3.0 | 2.5 | 1132 | $4,500 | $3.98 | 16d | 1 | 1.32mi |
| 290 Courtney Lakes Cir West Palm Beach, FL | 1.0–3.0 | 1.0–2.0 | 1069 | $3,250 | $3.04 | 21d | 19 | 1.46mi |
HOA detail
- Monthly dues
- $1,070 · $12,840/yr
Listing history 2 events
-
2026-04-29status Pending
-
2026-03-29$135,000 Active
ⓘ Source: listings_history table (triggers on properties + properties_extension) + one-shot
backfill from property_details.listing_events for pre-trigger history.
Climate risk First Street
- Flood 4/10 Moderate FEMA zone X (unshaded) · 22% chance over 30 yrs
- Wildfire 1/10 Low
- Heat 9/10 Extreme 7 d/yr ≥105°F today · 23 d/yr by 30 yrs out
- Wind 10/10 Extreme 99% chance of damaging wind over 30 yrs
- Air quality 2/10 Low 1 unhealthy d/yr today · 1 by 30 yrs out
Nearby sold comps map
Loading sold comps map…
Walkable amenities ~0.75 mi
Loading nearby amenities…
Taxation est. · year 1
- Rental income
- $42,851
- − Mortgage interest
- −$7,562
- − Property taxes
- −$2,025
- − Insurance
- −$675
- − Repairs & maintenance
- −$3,428
- − Management
- −$3,428
- − HOA
- −$12,840
- − Depreciation
- −$3,927
- Taxable income
- $8,965
- Est. tax owed @ 24.0%
- −$2,152
- After-tax cash flow
- $7,665/yr
For passive investors: Depreciation is non-cash, so a rental often shows a tax loss while cash-flowing — sheltering income. Rental losses are passive: they offset passive income freely, and up to $25,000/yr can offset ordinary (W-2) income if you actively participate and your MAGI is under $100k (phasing out to $0 by $150k); unused losses carry forward. On sale, claimed depreciation is recaptured at up to 25%, and gains may owe capital-gains tax (a 1031 exchange can defer both). Figures are a year-1 estimate at your 24.0% rate — not tax advice; consult a CPA.
Condition & rehab AI · 13 photos
This manufactured home is in good condition with cosmetic updates needed. It offers a good investment opportunity with potential for both resale and rental value improvements.
Value-add opportunities
- Both Painting exterior siding and trim — Enhances curb appeal and value
- Both Landscaping and trimming — Improves curb appeal and rental value
- Resale Upgrading kitchen appliances — Modernizes kitchen and attracts buyers
- Resale Upgrading bathrooms with new fixtures — Enhances bathroom appeal and value
Renovation cost estimate screening
Value-add ROI direction
- Both Painting exterior siding and trim — Enhances curb appeal and value ↑
- Both Landscaping and trimming — Improves curb appeal and rental value ↑
- Resale Upgrading kitchen appliances — Modernizes kitchen and attracts buyers ↑
- Resale Upgrading bathrooms with new fixtures — Enhances bathroom appeal and value ↑
ⓘ Cost ranges are severity-bucket heuristics (US national rule-of-thumb). Get contractor quotes + a written scope before underwriting a rehab budget.
Schools (NCES district)
- District
- Palm Beach
- NCES district ID
- 1201500
- Math proficiency
- 46% ▼ -16.00%
- Reading proficiency
- 53% ▼ -4.00%
- Median HH income
- $53,943
- Composite
- 42.72/100
- National rank
- #3160
- State rank
- #34 of 73 in FL
Livability — Westgate
- Score
- 72/100
- State rank
- #328
- US rank
- #5745
Category grades
Schools grade is shown separately in the Schools card above.
Census & demographics
- County
- Palm Beach County · 1,438,312 people
- Metro
- Miami-Fort Lauderdale-Pompano Beach, FL
- Population (ZIP)
- 33,489
- Household income
- $67,073
- Rent vs Own
- Severe rent burden
- 1333.0
Population outlook (Palm Beach County) Hauer SSP2
- Today (2025)
- 1,637,487 people
- By 2030
- 1,743,255 · +6.5%
- By 2040
- 1,948,712 · +19.0%
- By 2050
- 2,132,979 · +30.3%
- By 2075
- 2,530,027 · +54.5%
- By 2100
- 2,706,979 · +65.3%
Race, ethnicity, and origin ACS 2023
- Neighborhood character
- Highly diverse neighborhood (Simpson 0.70)
- Race & ethnicity
- Hispanic / Latino 36% Black 31% White 27% Two or more races 21% Asian 2%
- Hispanic origin (detail)
- Mexican 4% Puerto Rican 4% Cuban 8% Dominican 1%
- Common ancestry
- Hispanic 8% Romanian 1% Lithuanian 1%
- Foreign-born
- 34% · Canada, Jamaica
- Languages at home
- 55% English-only · Spanish 30% French/Haitian/Cajun 10% Other Indo-European 2%
Political lean MEDSL · Palm Beach
- 2024 margin
- Toss-up / Even · D 50.0% · R 49.2%
- 2008→2024 swing
- -22.1pp toward R · 2008: 22.9pp · 2024: 0.8pp
- All cycles
- 2024: D+0.8 2020: D+12.8 2016: D+15.3 2012: D+17.0 2008: D+22.9
Not yet ingested
- Civics
- —
Market trends
- HPI YoY
- ▼ -128.54%
- Current HPI
- 374.2506
- Rent YoY
- ▼ -0.15%
- Metro
- Miami-Fort Lauderdale-Pompano Beach, FL
- State GDP YoY
- ▲ 3.28%
- F500 in state
- 36
Industry mix (Fortune 500 HQ in FL)
| Industry | F500 HQs | Revenue |
|---|---|---|
| Industrial Technology | 2 | $29B |
|
||
| Insurance | 2 | $17B |
|
||
| Retail | 1 | $60B |
|
||
| Technology Distribution | 1 | $58B |
|
||
| Homebuilding | 1 | $35B |
|
||
| Technology Manufacturing | 1 | $35B |
|
||
Price history
2 events — show timeline
- 2026-04-29 Pending — Beaches MLS
- 2026-03-29 Listed $135,000 Beaches MLS
Cash-flow waterfall
monthlySold comps — $/sqft
last 12 mo · ≤1 miLoading sold comps…