 🏗️ New Construction
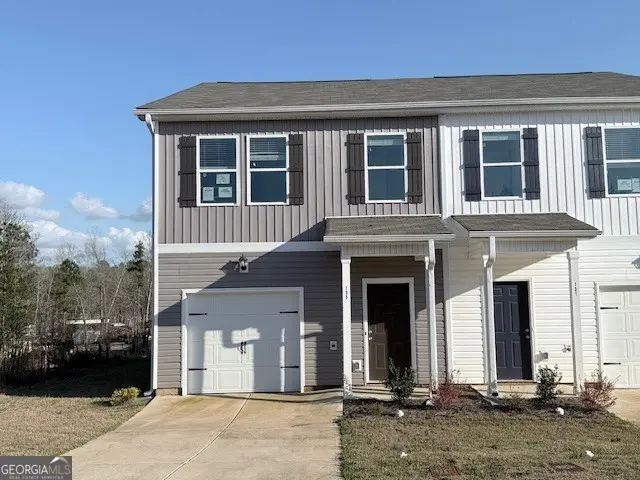
135 Pin Oak Trl · Milledgeville, GA
Flood risk 1/10 · Minimal
- FEMA flood zone
- X (unshaded)
- Chance of flooding over 30 yrs
- 0.0%
- Est. flood insurance / yr
- $507 – $1,088
Fire risk 4/10 · Minor
- Est. fire insurance / yr
- $963 – $1,789
Heat risk 7/10 · Major
- Hot days now (above 109°F)
- 7 days/yr
- Hot days in 30 yrs
- 17 days/yr
Wind risk 6/10 · Moderate
- Chance of severe wind over 30 yrs
- 57.0%
Air-quality risk 3/10 · Minor
- Unhealthy air days now
- 2 days/yr
- Unhealthy air days in 30 yrs
- 3 days/yr
Risk factors via First Street. Map © Google.
Why this score? — see what drove the F grade
The composite is a weighted blend of 9 inputs, each scored 0–100. Each bar is that input's sub-score; the figure is the points it added to the 100-point composite (weight × sub-score).
- Cash flow +7.7/30.0
- ARV discount +7.5/15.0
- Rent growth +3.5/5.0
- Livability +3.4/5.0
- Condition / age +2.5/5.0
- DSCR +1.8/10.0
- 1% rule +1.4/10.0
- Schools +1.4/10.0
- Appreciation +0.0/10.0
$159,900
🖨 Deal sheet 📄 Offer letter ✓ Due diligence
Listing remarks
New construction townhome in Milledgeville, GA! This townhome offers 3 bedrooms and 2.5 baths with a functional and efficient layout. The upper-level features three bedrooms and two full bathrooms, while the main level includes a convenient half bath for guests. The kitchen is equipped with 36" cabinetry, providing ample storage and workspace, and opens to the main living area for easy everyday living. There are new Stainless-Steel appliances, granite countertops, and a bar area. This property may qualify for USDA loan financing, offering a potential zero down payment option for qualified buyers-making it an attractive opportunity for both owner-occupants and investors. Located in an a
Key facts
- Garage
- Built 2025
- Listed 11 days
Neighborhood map
What this means for you Summary
Snapshot
- This is a 3-bed/0.5-bath single-family listed at $160k.
Deal economics
- At list price, monthly cash flow is $-306 ($-4k/yr) — negative.
- The deal already cash-flows at list — no discount required.
- Meets the 1% rule at list price ($2k rent vs $160k).
- Cap rate 4.9% vs local median 2.9% in Milledgeville — top-decile yield for the area; either an underpriced asset or a hidden risk that comps aren't pricing in. Stress-test before assuming the spread holds.
Location & tenants
- Location reads 68/100 on livability (#134 in GA) — a middle-class / working-renter tenant base. Strengths: cost of living A+, health & safety A+, housing A-; Watch: amenities D+, crime F, commute F.
- Baldwin County (town): math 13% / reading 20% proficiency, ranked #152 of 174 in GA (top 87%) — low school quality limits family demand, transient renter base, plan for 1-2y turnover; 72% free/reduced lunch — lower-income household profile, screen leases tightly.
- Zoned schools: Lakeview Primary (835 students, 89% FRL); Oak Hill Ms (math 13% / reading 24%, grade F, #372 of 470 statewide, top 80%, 986 students, 89% FRL); Baldwin High School (math 10% / reading 21%, grade F, #290 of 424 statewide, top 69%, 1,311 students, 89% FRL) — zoned schools average 89% FRL vs 72% district-wide (17 pts higher); higher-poverty schools than district average — tighter screening recommended.
- Market conditions: Rents rising fast (+4.0%/yr); 375 active listings in the ZIP; 9 comparable units currently listed for rent nearby; rentals lingering (median 44d on market — plan ~5-8 weeks vacancy on turnover, expect pricing pressure); 100% of comp listings sitting > 30 days — soft ceiling on asking rent; 202 units permitted in Baldwin County in 2024 (12 in 5+ unit buildings).
- This rent runs 37% of the median local income ($54k/yr) — at the standard rent-burdened threshold; future hikes will face affordability resistance.
Forward outlook
- Local home prices are declining (-3.0%/yr); year-one equity from $2k of loan paydown is wiped out by about $8k of value loss. Plan a longer hold.
- Baldwin County population projected to shrink 8% by 2050 — rents likely to lag national; underwrite the cash flow, not the appreciation.
Negotiation context
- Only 11 days on market — expect competitive offers; lowballing is unlikely to land.
Risks & watch-outs
- Climate carrying-cost: major wind risk, 57% chance of damaging wind over 30y; extreme-heat days projected 7→17/yr by 2055 (HVAC capex compounding) — expect insurance premiums to compound above CPI over the hold.
Questions for the listing agent
- What do current leases actually rent for vs. the listed asking? Can we see a recent rent roll and the last 12 months of T-12 income?
- Is there a deadline driving the sale (1031 exchange, divorce, estate, relocation)? That informs how much negotiation room exists.
- Schools are F-rated, which usually means shorter tenancies and higher turnover. Who's the typical renter profile here, and what's been the actual vacancy rate?
- Crime grade is F in this area — have there been break-ins, vandalism, or insurance claims at this property in the last 3 years? What carrier currently insures it and at what premium?
- The area grade is low — what's the realistic commute time and amenity access for the typical tenant pool here? Any planned neighborhood developments (good or bad) we should know about?
- What's the average days-on-market for RENTAL listings here right now (not sales)? A rising rental-DOM trend means longer vacancies and softer asking-rent achievability than the comps imply.
- What's the recent tenant-quality profile in this submarket — average credit score on applications, eviction rate, late-payment / NSF rate, and stable-employment percentage? A property-management company in the area should have these aggregated.
- How much new for-sale + rental construction is in the pipeline within 1–3 miles? Heavy new supply typically softens prices + rents 12–24 months out; constrained supply supports both.
Investment metrics
- 1% rule
- 0.64% ✗
- Cap rate
- 4.90%
- Cash-on-cash
- -4.97%
- DSCR
- 0.78
- GRM
- 13.0
CMA / ARV
- ARV (on-the-fly)
- $263,640
- Comps found
- 1
Show comp detail 1 sale within ~0.75 mi
| Address | Dist | Beds/Ba | Sqft | Sold | Price | $/sf | Match |
|---|---|---|---|---|---|---|---|
| 310 Oakwood Dr | 0.07mi | 3/2.5 | 1,538 (-1%) | 10mo | $260,000 | $169 | 78 |
Match score weights: distance 35% · size 25% · config 20% · recency 20%. Top-matched comps best support the ARV.
Projected returns pro-forma
-3.0% appreciation · 4.05% rent growth · sell at horizon
- IRR
- -23.8%
- Equity multiple
- 0.18×
- Total profit
- $-60,467
- Equity at exit
- $39,310
- IRR
- -16.5%
- Equity multiple
- 0.04×
- Total profit
- $-70,501
- Equity at exit
- $22,795
Cash invested: $73,819 (down + closing). Projections, not guarantees.
Landlord ↔ Tenant lean methodology
- Overall (STATE)
- 90 Strongly Landlord-Friendly
- State Georgia
- 90 Strongly Landlord-Friendly · R+3
- County
- — inherits STATE
- City
- — inherits STATE
ZIP-level market 31061
- Home prices YoY
- -29.9%
- Rents YoY
- 4.0%
- Active inventory
- 375
- Price-to-rent
- 7.9×
Monthly cashflow live
- Estimated rent
- $1,690 high interval (Pro) →
- Mortgage (P&I)
- −$1,383
- Tax from tax record
- −$149 /mo · $1,784/yr
- Insurance
- −$110
- HOA
- −$0
- Vacancy / Maint / Mgmt
- −$355
- Net cashflow
- $-306
Break-even live
UW: 25.0% down · 7.5% · 30yr · 1.5% tax · 5.0% vac · 8.0% maint · 8.0% mgmt
Financing live
Cash to close
- Down payment
- $65,910
- Closing costs
- $7,909
- Reserves months
- —
- Total cash needed
- —
Loan-product check · same deal, 3 products live
Conventional
25% down · 7.5% · 30yr
- Down + closing
- —
- Monthly P&I
- —
- Monthly cashflow
- —
- DSCR
- —
- Eligible?
- —
Personal DTI + credit; lowest rate.
DSCR
20% down · 8.5% · 30yr
- Down + closing
- —
- Monthly P&I
- —
- Monthly cashflow
- —
- DSCR
- —
- Eligible?
- —
No personal income docs; deal must DSCR.
Hard money
10% down · 12.0% · 12mo
- Down + closing
- —
- Monthly P&I
- —
- Monthly cashflow
- —
- DSCR
- —
- Eligible?
- —
Short-term bridge; refi at stabilization.
Rent comps 9 comps
| Address | Beds | Baths | Sqft | Rent | $/sqft | DOM | Units | Dist |
|---|---|---|---|---|---|---|---|---|
| 302 Oakwood Dr NW Milledgeville, GA | 3.0 | 2.5 | 1538 | $1,684 | $1.09 | 44d | 1 | 0.05mi |
| 274 Oakwood Dr NW Milledgeville, GA | 3.0 | 2.5 | 1538 | $1,734 | $1.13 | 44d | 1 | 0.08mi |
| 425 Oakwood Dr NW Milledgeville, GA | 3.0 | 2.5 | 1538 | $1,684 | $1.09 | 44d | 1 | 0.08mi |
| 454 Oakwood Dr NW Milledgeville, GA | 3.0 | 2.5 | 1538 | $1,950 | $1.27 | 44d | 1 | 0.10mi |
| 261 Oakwood Dr NW Milledgeville, GA | 3.0 | 2.5 | 1538 | $1,684 | $1.09 | 44d | 1 | 0.11mi |
| 146 Cypress Oak Trl NW Milledgeville, GA | 2.0 | 2.0 | 1351 | $1,595 | $1.18 | 44d | 1 | 0.22mi |
| 180 Milledge Commons Dr NE Milledgeville, GA | 3.0 | 2.5 | 1381 | $1,800 | $1.30 | 44d | 1 | 0.92mi |
| 162 Milledge Commons Dr NE Milledgeville, GA | 3.0 | 2.5 | 1381 | $1,800 | $1.30 | 44d | 1 | 0.94mi |
| 109 Milledge Commons Dr Milledgeville, GA | 3.0 | 2.5 | 1895 | $2,100 | $1.11 | 44d | 1 | 1.03mi |
Listing history 4 events
-
2026-04-06status Under Contract
-
2026-03-25$159,900 New
-
2022-05-17soldstatus $1,397,500
-
2022-05-17soldstatus $2,015,000
ⓘ Source: listings_history table (triggers on properties + properties_extension) + one-shot
backfill from property_details.listing_events for pre-trigger history.
Tax reassessment forecast GA · Resets to sale price
- Current annual tax
- $1,784 · $149/mo
- Projected year-2 tax
- $1,784 · $149/mo
- Expected delta
- $0/yr ($0/mo · -0.0%)
ⓘ Screening estimate from a state-policy table — verify with the county assessor before closing.
Climate risk First Street
- Flood 1/10 Low FEMA zone X (unshaded) · 0% chance over 30 yrs
- Wildfire 4/10 Moderate
- Heat 7/10 Severe 7 d/yr ≥109°F today · 17 d/yr by 30 yrs out
- Wind 6/10 Major 57% chance of damaging wind over 30 yrs
- Air quality 3/10 Moderate 2 unhealthy d/yr today · 3 by 30 yrs out
Nearby sold comps map
Loading sold comps map…
Walkable amenities ~0.75 mi
Loading nearby amenities…
Taxation est. · year 1
- Rental income
- $20,285
- − Mortgage interest
- −$14,768
- − Property taxes
- −$1,784
- − Insurance
- −$1,318
- − Repairs & maintenance
- −$1,623
- − Management
- −$1,623
- − Depreciation
- −$7,670
- Taxable loss
- −$8,500
- Est. tax savings @ 24.0%
- +$2,040
- After-tax cash flow
- $-1,627/yr
For passive investors: Depreciation is non-cash, so a rental often shows a tax loss while cash-flowing — sheltering income. Rental losses are passive: they offset passive income freely, and up to $25,000/yr can offset ordinary (W-2) income if you actively participate and your MAGI is under $100k (phasing out to $0 by $150k); unused losses carry forward. On sale, claimed depreciation is recaptured at up to 25%, and gains may owe capital-gains tax (a 1031 exchange can defer both). Figures are a year-1 estimate at your 24.0% rate — not tax advice; consult a CPA.
Schools (NCES district)
- District
- Baldwin County
- NCES district ID
- 1300210
- Math proficiency
- 13% ▼ -8.00%
- Reading proficiency
- 20% ▼ -5.00%
- Median HH income
- $35,615
- Composite
- 13.61/100
- National rank
- #9508
- State rank
- #152 of 174 in GA
Livability — Milledgeville
- Score
- 68/100
- State rank
- #134
- US rank
- #9206
Category grades
Schools grade is shown separately in the Schools card above.
Census & demographics
- County
- Baldwin County · 41,764 people
- City population
- 41,764
- Metro
- Milledgeville, GA
- Population (ZIP)
- 41,764
- Household income
- $54,263
- Rent vs Own
- Severe rent burden
- 1630.0
Population outlook (Baldwin County) Hauer SSP2
- Today (2025)
- 45,602 people
- By 2030
- 45,481 · -0.3%
- By 2040
- 44,310 · -2.8%
- By 2050
- 42,129 · -7.6%
- By 2075
- 36,819 · -19.3%
- By 2100
- 29,320 · -35.7%
Race, ethnicity, and origin ACS 2023
- Neighborhood character
- Diverse neighborhood (Simpson 0.56)
- Race & ethnicity
- White 51% Black 43% Hispanic / Latino 3% Two or more races 3% Asian 2%
- Common ancestry
- Slovak 1% Serbian 1% Italian 1%
- Foreign-born
- 3% · Canada, South Korea
- Languages at home
- 96% English-only · Spanish 2% Korean 1%
Political lean MEDSL · Baldwin
- 2024 margin
- Toss-up / Even · D 48.6% · R 50.9%
- 2008→2024 swing
- -6.8pp toward R · 2008: 4.6pp · 2024: -2.2pp
- All cycles
- 2024: R+2.2 2020: D+1.3 2016: D+1.7 2012: D+5.5 2008: D+4.6
Not yet ingested
- Civics
- —
Market trends
- HPI YoY
- ▼ -103.16%
- Current HPI
- 241.3758
- Rent YoY
- ▲ 4.05%
- Metro
- Milledgeville, GA
- State GDP YoY
- ▲ 2.66%
- F500 in state
- 28
Industry mix (Fortune 500 HQ in GA)
| Industry | F500 HQs | Revenue |
|---|---|---|
| Paper / Packaging | 2 | $29B |
|
||
| Retail | 1 | $160B |
|
||
| Transportation / Logistics | 1 | $91B |
|
||
| Airlines | 1 | $62B |
|
||
| Consumer Goods | 1 | $47B |
|
||
| Utilities | 1 | $25B |
|
||
Price history
-88.6% since first listed4 events — show timeline
- 2026-04-06 Pending — GAMLS
- 2026-03-25 Listed $159,900 GAMLS
- 2022-05-17 Sold (Public Records) $2,015,000 Public Records
- 2022-05-17 Sold (Public Records) $1,397,500 Public Records
Property tax history
+46.4%/yrLatest (2025): $1,784 · +1891.5% YoY. Source: county tax records.
Cash-flow waterfall
monthlySold comps — $/sqft
last 12 mo · ≤1 miLoading sold comps…