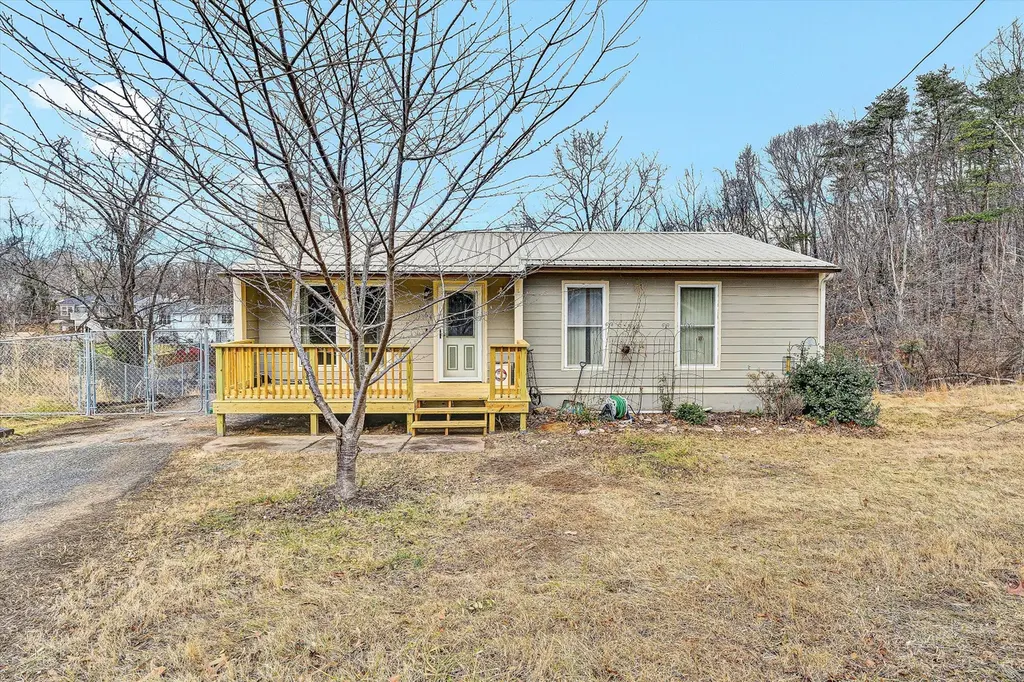
4064 Crawford Rd · Cave Spring, VA
Flood risk 7/10 · Major
- FEMA flood zone
- X (unshaded)
- Chance of flooding over 30 yrs
- 0.99%
- Est. flood insurance / yr
- $473 – $860
Fire risk 3/10 · Minor
- Est. fire insurance / yr
- $666 – $1,236
Heat risk 5/10 · Moderate
- Hot days now (above 99°F)
- 7 days/yr
- Hot days in 30 yrs
- 19 days/yr
Wind risk 2/10 · Minimal
- Chance of severe wind over 30 yrs
- 1.0%
Air-quality risk 2/10 · Minimal
- Unhealthy air days now
- 0 days/yr
- Unhealthy air days in 30 yrs
- 1 days/yr
Risk factors via First Street. Map © Google.
Why this score? — see what drove the D+ grade
The composite is a weighted blend of 9 inputs, each scored 0–100. Each bar is that input's sub-score; the figure is the points it added to the 100-point composite (weight × sub-score).
- ARV discount +14.0/15.0
- Cash flow +11.8/30.0
- Schools +6.4/10.0
- Livability +3.8/5.0
- DSCR +3.5/10.0
- Rent growth +3.2/5.0
- 1% rule +2.6/10.0
- Condition / age +2.5/5.0
- Appreciation +0.0/10.0
$299,950
🖨 Deal sheet (PDF) 📄 Offer letter ✓ Due diligence
Listing remarks MLS
VACANT-OWNER WANTS OFFERS-GREAT HOUSE FOR THE MONEY-ALL APPLIANCES STAY-GREEN VALLEY-HIDDEN VALLEY & CSHS-NEW INTERIOR-5 BDRMS-2 BATHS-OVER 200 SQFT-2 FRPLC-PLEASE SHOW-LKBOX ON FRONT DOOR
Key facts
- 0.48 acre lot
- 2 parking spots
- Built 1975
Property features AI
Finance
- - Other:
- - Financial info:
- - HOA & community: Community with access to public transport and nearby restaurants
Exterior
- - Parking: 2 open parking spaces
- - Security:
- - Utilities:
- - Home design: Residential property; Built in 1975
- - Construction:
- - Exterior features: Front porch; Off-street parking
Interior
- - Kitchen:
- - Bedrooms: 5 bedrooms total, 3 on the main level
- - Flooring:
- - Bathrooms: 2 full bathrooms, 1 main-level bathroom
- - Heating & cooling: Heat pump (electric) for heating and cooling
- - Interior features: Storage; Metal doors; Insulated windows; Two fireplaces
- - Laundry & utility:
Neighborhood map
What this means for you Summary
Snapshot
- This is a 5-bed/2.0-bath single-family listed at $300k.
Deal economics
- At list price, monthly cash flow is $-136 ($-2k/yr) — negative.
- To cash-flow at today's rent, offer at most $276k (8.0% below list).
- To meet the 1% rule (rent ≥ 1% of price), the offer needs to be $228k (23.9% below list).
- Recommended offer: $228k (23.9% below list) — sets the bar for 1% rule.
- Cap rate 6.0% vs local median 3.4% in Cave Spring — top-decile yield for the area; either an underpriced asset or a hidden risk that comps aren't pricing in. Stress-test before assuming the spread holds.
Location & tenants
- Location reads 76/100 on livability (#113 in VA, #3,513 nationally) — a middle-class / working-renter tenant base. Strengths: housing A+, health & safety A+, cost of living A-; Watch: amenities F, commute F.
- Roanoke County Public School District (suburban): math 71% / reading 78% proficiency, ranked #9 of 131 in VA (top 7%) — strong family-tenant draw, lease renewals of 3-5y typical.
- Zoned schools: Green Valley Elementary (math 63% / reading 75%, grade A-, #351 of 1,108 statewide, top 32%, 518 students, 43% FRL); Cave Spring Middle (math 76% / reading 82%, grade A+, #29 of 342 statewide, top 9%, 765 students, 30% FRL); Cave Spring High (math 86% / reading 90%, grade A, #13 of 319 statewide, top 4%, 1,056 students, 22% FRL).
- Market conditions: Rents rising (+2.9%/yr); 339 active listings in the ZIP; solid renter incomes; 360 units permitted in Roanoke County in 2024 (228 in 5+ unit buildings).
- This rent runs 30% of the median local income ($91k/yr) — at the standard rent-burdened threshold; future hikes will face affordability resistance.
Forward outlook
- Local home prices are declining (-3.0%/yr); year-one equity from $2k of loan paydown is wiped out by about $9k of value loss. Plan a longer hold.
- Roanoke County population projected at +5% by 2050 — modest demand growth; plan on rents tracking national, not racing it.
Negotiation context
- Only 8 days on market — expect competitive offers; lowballing is unlikely to land.
- 3 sale attempts since 26y ago with the ask held roughly flat each time — persistent listings suggest the price (not the market) is what's stuck; bring a comps-based counter.
- Current owner paid $101k; list at $300k implies a 197% gain — meaningful room to come down on a strong offer.
Risks & watch-outs
- Watch-outs: flood insurance adds $56/mo.
- Climate carrying-cost: major flood risk; extreme-heat days projected 7→19/yr by 2055 (HVAC capex compounding) — expect insurance premiums to compound above CPI over the hold.
Questions for the listing agent
- What do current leases actually rent for vs. the listed asking? Can we see a recent rent roll and the last 12 months of T-12 income?
- Built in 1975 — when were the roof, HVAC, electrical panel, plumbing, and water heater last replaced?
- What's the actual annual flood-insurance premium (NFIP or private), and is the property in a SFHA with mandatory coverage?
- Is there a deadline driving the sale (1031 exchange, divorce, estate, relocation)? That informs how much negotiation room exists.
- Schools are A-rated — typically a magnet for longer-tenancy family renters. What's the average tenant stay here, and is there a school-zone premium baked into asking?
- The area grade is low — what's the realistic commute time and amenity access for the typical tenant pool here? Any planned neighborhood developments (good or bad) we should know about?
- What's the average days-on-market for RENTAL listings here right now (not sales)? A rising rental-DOM trend means longer vacancies and softer asking-rent achievability than the comps imply.
- What's the recent tenant-quality profile in this submarket — average credit score on applications, eviction rate, late-payment / NSF rate, and stable-employment percentage? A property-management company in the area should have these aggregated.
- How much new for-sale + rental construction is in the pipeline within 1–3 miles? Heavy new supply typically softens prices + rents 12–24 months out; constrained supply supports both.
Investment metrics
- 1% rule
- 0.76% ✗
- Cap rate
- 5.97%
- Cash-on-cash
- -1.15%
- DSCR
- 0.95
- GRM
- 10.9
CMA / ARV
- ARV (median comp)
- $350,536
- List price
- $299,950
- Delta
- -11.86%
- Verdict
- UNDERPRICED
- Comps
- 20 within 1.0 mi
Projected returns pro-forma
-3.0% appreciation · 2.88% rent growth · sell at horizon
- IRR
- -19.7%
- Equity multiple
- 0.31×
- Total profit
- $-57,571
- Equity at exit
- $44,724
- IRR
- -12.7%
- Equity multiple
- 0.25×
- Total profit
- $-62,582
- Equity at exit
- $25,934
Cash invested: $83,986 (down + closing). Projections, not guarantees.
Landlord ↔ Tenant lean methodology
- Overall (STATE)
- 55 Moderately Landlord-Leaning
- State Virginia
- 55 Moderately Landlord-Leaning · D+2
- County
- — inherits STATE
- City
- — inherits STATE
ZIP-level market 24018
- Rents YoY
- 2.9%
- Active inventory
- 339
- Price-to-rent
- 10.9×
Monthly cashflow live
- Estimated rent
- $2,283 medium interval (Pro) →
- Mortgage (P&I)
- −$1,573
- Tax from tax record
- −$186 /mo · $2,227/yr
- Insurance
- −$125
- Flood insurance flood zone
- −$56 /mo · $666/yr
- HOA
- −$0
- Vacancy / Maint / Mgmt
- −$479
- Net cashflow
- $-136
Break-even live
Sensitivity live
| Price | -10% $34 | -5% $-51 | +0% $-136 | +5% $-221 | +10% $-306 |
|---|---|---|---|---|---|
| Rent | -10% $-316 | -5% $-226 | +0% $-136 | +5% $-46 | +10% $45 |
| Rate | -1.0pp $15 | -0.5pp $-59 | base $-136 | +0.5pp $-213 | +1.0pp $-293 |
UW: 25.0% down · 7.5% · 30yr · 1.5% tax · 5.0% vac · 8.0% maint · 8.0% mgmt
Financing live
Cash to close
- Down payment
- $74,988
- Closing costs
- $8,998
- Reserves months
- —
- Total cash needed
- —
Loan-product check · same deal, 3 products live
Conventional
25% down · 7.5% · 30yr
- Down + closing
- —
- Monthly P&I
- —
- Monthly cashflow
- —
- DSCR
- —
- Eligible?
- —
Personal DTI + credit; lowest rate.
DSCR
20% down · 8.5% · 30yr
- Down + closing
- —
- Monthly P&I
- —
- Monthly cashflow
- —
- DSCR
- —
- Eligible?
- —
No personal income docs; deal must DSCR.
Hard money
10% down · 12.0% · 12mo
- Down + closing
- —
- Monthly P&I
- —
- Monthly cashflow
- —
- DSCR
- —
- Eligible?
- —
Short-term bridge; refi at stabilization.
Listing history 18 events
-
2026-06-22days on market $299,950 Active 8 DOM
-
2026-06-18days on market $299,950 Active 5 DOM
-
2026-06-17days on market $299,950 Active 4 DOM
-
2026-06-16days on market $299,950 Active 3 DOM
-
2026-06-15days on market $299,950 Active 2 DOM
-
2026-06-14pricedays on market $299,950 Active 1 DOM
-
2026-06-02days on market $308,950 Active 151 DOM
-
2026-06-01days on market $308,950 Active 150 DOM
-
2026-05-31days on market $308,950 Active 149 DOM
-
2026-05-30days on market $308,950 Active 148 DOM
-
2026-03-23price $308,950 897-char remark
-
2026-03-03price $309,450 897-char remark
-
2026-01-02$309,950 Active 897-char remark
-
2001-01-26soldstatus $101,000 194-char remark
Show marketing remark (194 chars)
VACANT-OWNER WANTS OFFERS-GREAT HOUSE FOR THE MONEY-ALL APPLIANCES STAY-GREEN VALLEY-HIDDEN VALLEY & CSHS-NEW INTERIOR-5 BDRMS-2 BATHS-OVER 200 SQFT-2 FRPLC-PLEASE SHOW-LKBOX ON FRONT DOOR
-
2001-01-01soldstatus $101,000
-
2000-06-09$106,950 194-char remark
Show marketing remark (194 chars)
VACANT-OWNER WANTS OFFERS-GREAT HOUSE FOR THE MONEY-ALL APPLIANCES STAY-GREEN VALLEY-HIDDEN VALLEY & CSHS-NEW INTERIOR-5 BDRMS-2 BATHS-OVER 200 SQFT-2 FRPLC-PLEASE SHOW-LKBOX ON FRONT DOOR
-
1994-04-01soldstatus $88,900
-
1991-07-01soldstatus $75,000
ⓘ Source: listings_history table (triggers on properties + properties_extension) + one-shot
backfill from property_details.listing_events for pre-trigger history.
Tax reassessment forecast VA · Resets to sale price
- Current annual tax
- $2,227 · $186/mo
- Projected year-2 tax
- $2,460 · $205/mo
- Expected delta
- +$233/yr (+$19/mo · 10.5%)
ⓘ Screening estimate from a state-policy table — verify with the county assessor before closing.
Climate risk First Street
- Flood 7/10 Severe FEMA zone X (unshaded) · 99% chance over 30 yrs
- Wildfire 3/10 Moderate
- Heat 5/10 Major 7 d/yr ≥99°F today · 19 d/yr by 30 yrs out
- Wind 2/10 Low 100% chance of damaging wind over 30 yrs
- Air quality 2/10 Low 0 unhealthy d/yr today · 1 by 30 yrs out
Nearby sold comps map
Loading sold comps map…
Walkable amenities ~0.75 mi
Loading nearby amenities…
Taxation est. · year 1
- Rental income
- $27,393
- − Mortgage interest
- −$16,802
- − Property taxes
- −$2,227
- − Insurance
- −$2,166
- − Repairs & maintenance
- −$2,191
- − Management
- −$2,191
- − Depreciation
- −$8,726
- Taxable loss
- −$6,911
- Est. tax savings @ 24.0%
- +$1,659
- After-tax cash flow
- $30/yr
For passive investors: Depreciation is non-cash, so a rental often shows a tax loss while cash-flowing — sheltering income. Rental losses are passive: they offset passive income freely, and up to $25,000/yr can offset ordinary (W-2) income if you actively participate and your MAGI is under $100k (phasing out to $0 by $150k); unused losses carry forward. On sale, claimed depreciation is recaptured at up to 25%, and gains may owe capital-gains tax (a 1031 exchange can defer both). Figures are a year-1 estimate at your 24.0% rate — not tax advice; consult a CPA.
Schools (NCES district)
- District
- Roanoke County Public School District
- NCES district ID
- 5103330
- Math proficiency
- 71% ▼ -19.00%
- Reading proficiency
- 78% ▼ -6.00%
- Median HH income
- $60,526
- Composite
- 64.08/100
- National rank
- #578
- State rank
- #9 of 131 in VA
Livability — Cave Spring
- Score
- 76/100
- State rank
- #113
- US rank
- #3513
Category grades
Schools grade is shown separately in the Schools card above.
Census & demographics
- Census place
- Cave Spring, VA
- County
- Roanoke County · 67,305 people
- Metro
- Roanoke, VA
- Population (ZIP)
- 38,720
- Household income
- $90,885
- Rent vs Own
- Severe rent burden
- 495.0
Population outlook (Roanoke County) Hauer SSP2
- Today (2025)
- 98,162 people
- By 2030
- 99,793 · +1.7%
- By 2040
- 101,965 · +3.9%
- By 2050
- 103,328 · +5.3%
- By 2075
- 108,641 · +10.7%
- By 2100
- 104,845 · +6.8%
Race, ethnicity, and origin ACS 2023
- Neighborhood character
- Predominantly White (83%)
- Race & ethnicity
- White 83% Asian 6% Hispanic / Latino 4% Two or more races 4% Black 4%
- Common ancestry
- Italian 4% Slovak 3% Serbian 3%
- Foreign-born
- 10% · Canada, China, Vietnam
- Languages at home
- 86% English-only · Spanish 5% Other Indo-European 3% Other Asian/Pacific 1%
Political lean MEDSL · Roanoke
- 2024 margin
- Strong R (+22.5) · D 38.2% · R 60.7% · Other 1.1%
- 2008→2024 swing
- -1.4pp toward R · 2008: -21.1pp · 2024: -22.5pp
- All cycles
- 2024: R+22.5 2020: R+21.8 2016: R+28.1 2012: R+25.6 2008: R+21.1
Not yet ingested
- Civics
- —
Market trends
- HPI YoY
- ▼ -266.18%
- Current HPI
- 176.0558
- Rent YoY
- ▲ 2.88%
- Metro
- Roanoke, VA
- State GDP YoY
- ▲ 2.40%
- F500 in state
- 50
Industry mix (Fortune 500 HQ in VA)
| Industry | F500 HQs | Revenue |
|---|---|---|
| Aerospace / Defense | 4 | $236B |
|
||
| Technology / Defense | 3 | $32B |
|
||
| Financial Services | 2 | $176B |
|
||
| Utilities | 2 | $27B |
|
||
| Insurance | 2 | $25B |
|
||
| Technology | 2 | $15B |
|
||
Price history
+299.9% since first listed10 events — show timeline
- 2026-06-13 Listed $299,950 MLSRV
- 2026-06-02 Listing Removed — MLSRV
- 2026-03-23 Price Changed $308,950 MLSRV
- 2026-03-03 Price Changed $309,450 MLSRV
- 2026-01-02 Listed $309,950 MLSRV
- 2001-01-26 Sold (MLS) $101,000 MLSRV
- 2001-01-01 Sold (Public Records) $101,000 Public Records
- 2000-06-09 Listed $106,950 MLSRV
- 1994-04-01 Sold (Public Records) $88,900 Public Records
- 1991-07-01 Sold (Public Records) $75,000 Public Records
Property tax history
+3.9%/yrLatest (2025): $2,227 · +4.3% YoY. Source: county tax records.
Cash-flow waterfall
monthlySold comps — $/sqft
last 12 mo · ≤1 miLoading sold comps…