 Duplex
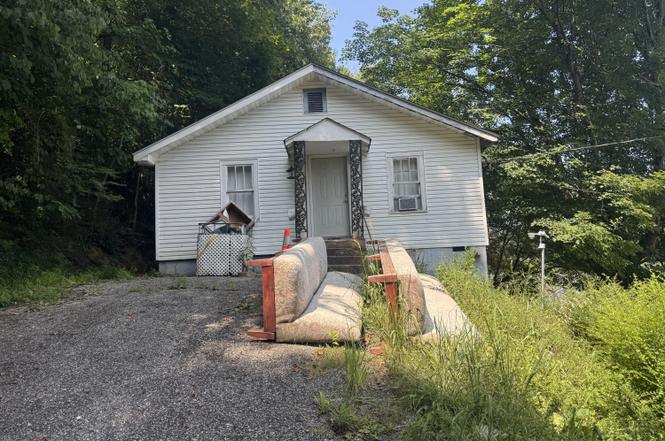
110 3rd Ave · Clendenin, WV
Flood risk 1/10 · Minimal
- FEMA flood zone
- X (unshaded)
- Chance of flooding over 30 yrs
- 0.0%
- Est. flood insurance / yr
- $507 – $1,088
Fire risk 4/10 · Minor
- Est. fire insurance / yr
- $787 – $1,461
Heat risk 4/10 · Minor
- Hot days now (above 101°F)
- 7 days/yr
- Hot days in 30 yrs
- 20 days/yr
Wind risk 2/10 · Minimal
- Chance of severe wind over 30 yrs
- 1.0%
Air-quality risk 2/10 · Minimal
- Unhealthy air days now
- 1 days/yr
- Unhealthy air days in 30 yrs
- 2 days/yr
Risk factors via First Street. Map © Google.
Why this score? — see what drove the D+ grade
The composite is a weighted blend of 9 inputs, each scored 0–100. Each bar is that input's sub-score; the figure is the points it added to the 100-point composite (weight × sub-score).
- Cash flow +15.0/30.0
- ARV discount +7.5/15.0
- Appreciation +5.2/10.0
- 1% rule +5.0/10.0
- DSCR +5.0/10.0
- Livability +3.1/5.0
- Schools +2.9/10.0
- Rent growth +2.5/5.0
- Condition / age +2.5/5.0
$39,900
🖨 Deal sheet (PDF) 📄 Offer letter ✓ Due diligence
Multi-family units
County records classify this as Multi-Family (2-4 Unit). Listing-text estimate: 2 units. confirmed
Listing remarks
Clendenin, Kanawha County, 2 bedroom 1 bath duplex plus an unfinished duplex ready for remodel 1,664 sq ft on a 0.36-acre lot. Built 1950 with solid structure and multi-unit potential. Renovation proj
Key facts
- 0.36-acre lot
- Multi-unit potential
- Unfinished duplex
Tags
Property features AI
Exterior
- Home design: Property type: Residential Income
- Construction: Living area approximately 1664 square feet
- Exterior features: Lot approximately 0.36 acres
Interior
- Interior features: Residential income property
Neighborhood map
What this means for you Summary
Snapshot
- This is a 2 × 2-bed/1.0-bath units multifamily listed at $40k.
Deal economics
- At list price, monthly cash flow is $1k ($12k/yr) — positive. Per door: $519/mo.
- The deal already cash-flows at list — no discount required.
- Meets the 1% rule at list price ($2k rent vs $40k).
- Recommended offer: $35k (12.0% below list) — sets the bar for market timing.
Location & tenants
- Location reads 61/100 on livability (#194 in WV) — a middle-class / working-renter tenant base. Strengths: crime A+, cost of living A+, housing B; Watch: employment D+, amenities F, commute F.
- Kanawha County Schools (suburban): math 29% / reading 40% proficiency, ranked #17 of 55 in WV (top 31%) — families likely to look elsewhere, expect single-tenant / working-renter base with shorter leases.
- Zoned schools: Clendenin Elementary School (math 37% / reading 37%, grade F, #130 of 377 statewide, top 39%, 300 students, 0% FRL); Elkview Middle School (math 26% / reading 42%, grade F, #36 of 109 statewide, top 35%, 613 students, 0% FRL); Herbert Hoover High School (math 37% / reading 62%, grade D, #7 of 110 statewide, top 6%, 789 students, 0% FRL) — zoned schools average 0% FRL vs 46% district-wide (46 pts lower); this property's tenant base skews higher-income than the district average.
- Market conditions: 21 active listings in the ZIP; 103 units permitted in Kanawha County in 2024 (0 in 5+ unit buildings).
Forward outlook
- In year one you build about $437 of equity ($276 loan paydown + $161 appreciation (0.4% local appreciation)).
- Kanawha County population projected at -17% by 2050 — secular population decline; favor cash flow + early exit over multi-decade hold.
- At projected returns (0.4% appreciation + 3.0% rent growth), your $11k cash investment doubles in ~1 year — after that, you're playing with house money.
Negotiation context
- It's been on market 229 days — a 12% lower offer ($35k) is reasonable based on typical stale-listing flexibility.
Risks & watch-outs
- Watch-outs: property tax is 3.1% of price; built in 1950 — expect roof / HVAC / electrical / plumbing capex.
Questions for the listing agent
- It's been on market 229 days. Have you received any prior offers? Is the seller open to a 12% concession, seller financing, or rate buy-down credit?
- Can we see the unit-by-unit rent roll, current vacancy, and any below-market leases? What's the average tenancy length?
- What capital expenditures (roof, boiler, parking lot, exteriors) have been made in the last 5 years, and what's planned in the next 2?
- Built in 1950 — when were the roof, HVAC, electrical panel, plumbing, and water heater last replaced?
- Property tax is high relative to price — has the assessment been appealed recently, and will the sale trigger a re-assessment?
- Why hasn't it sold? Are there any deal-killer items the seller is aware of (foundation, flood, title, zoning, code violations)?
- Is there a deadline driving the sale (1031 exchange, divorce, estate, relocation)? That informs how much negotiation room exists.
- Schools are F-rated, which usually means shorter tenancies and higher turnover. Who's the typical renter profile here, and what's been the actual vacancy rate?
- The area grade is low — what's the realistic commute time and amenity access for the typical tenant pool here? Any planned neighborhood developments (good or bad) we should know about?
- What's the average days-on-market for RENTAL listings here right now (not sales)? A rising rental-DOM trend means longer vacancies and softer asking-rent achievability than the comps imply.
- What's the recent tenant-quality profile in this submarket — average credit score on applications, eviction rate, late-payment / NSF rate, and stable-employment percentage? A property-management company in the area should have these aggregated.
- How much new apartment / multifamily construction is in the pipeline within 1–3 miles? Heavy new supply (>2% of stock underway) typically softens rents 12–24 months out; light construction supports rent growth.
Investment metrics
- 1% rule
- 4.34% ✓
- Cap rate
- 37.53%
- Cash-on-cash
- 111.57%
- DSCR
- 5.96
- GRM
- 1.9
CMA / ARV
No comps found within radius.
Projected returns pro-forma
0.4% appreciation · 3.0% rent growth · sell at horizon
- IRR
- —
- Equity multiple
- 6.89×
- Total profit
- $65,812
- Equity at exit
- $12,397
- IRR
- —
- Equity multiple
- 14.32×
- Total profit
- $148,849
- Equity at exit
- $15,565
Cash invested: $11,172 (down + closing). Projections, not guarantees.
Landlord ↔ Tenant lean methodology
- Overall (STATE)
- 83 Strongly Landlord-Friendly
- State West Virginia
- 83 Strongly Landlord-Friendly · R+22
- County
- — inherits STATE
- City
- — inherits STATE
ZIP-level market 25045
- Home prices YoY
- 0.1%
- Active inventory
- 21
- Price-to-rent
- 3.8×
Monthly cashflow live
- Estimated rent
- $1,733 medium interval (Pro) →
- Mortgage (P&I)
- −$209
- Tax from tax record
- −$104 /mo · $1,254/yr
- Insurance
- −$17
- HOA
- −$0
- Vacancy / Maint / Mgmt
- −$364
- Net cashflow
- $1,039
Break-even live
Sensitivity live
| Price | -10% $1,061 | -5% $1,050 | +0% $1,039 | +5% $1,027 | +10% $1,016 |
|---|---|---|---|---|---|
| Rent | -10% $902 | -5% $970 | +0% $1,039 | +5% $1,107 | +10% $1,176 |
| Rate | -1.0pp $1,059 | -0.5pp $1,049 | base $1,039 | +0.5pp $1,028 | +1.0pp $1,018 |
2-unit breakdown (identical units grouped — click to expand)
| Units | Beds | Baths | Est. rent |
|---|---|---|---|
| 2× units | 2 | 1 | $1,734 |
| #1 | 2 | 1 | $867 |
| #2 | 2 | 1 | $867 |
| Total (2 units) | $1,733 | ||
UW: 25.0% down · 7.5% · 30yr · 1.5% tax · 5.0% vac · 8.0% maint · 8.0% mgmt
Financing live
Cash to close
- Down payment
- $9,975
- Closing costs
- $1,197
- Reserves months
- —
- Total cash needed
- —
Loan-product check · same deal, 3 products live
Conventional
25% down · 7.5% · 30yr
- Down + closing
- —
- Monthly P&I
- —
- Monthly cashflow
- —
- DSCR
- —
- Eligible?
- —
Personal DTI + credit; lowest rate.
DSCR
20% down · 8.5% · 30yr
- Down + closing
- —
- Monthly P&I
- —
- Monthly cashflow
- —
- DSCR
- —
- Eligible?
- —
No personal income docs; deal must DSCR.
Hard money
10% down · 12.0% · 12mo
- Down + closing
- —
- Monthly P&I
- —
- Monthly cashflow
- —
- DSCR
- —
- Eligible?
- —
Short-term bridge; refi at stabilization.
Listing history 23 events
-
2026-06-21days on market $39,900 Active 229 DOM
-
2026-06-19days on market $39,900 Active 227 DOM
-
2026-06-18days on market $39,900 Active 226 DOM
-
2026-06-17days on market $39,900 Active 225 DOM
-
2026-06-16days on market $39,900 Active 224 DOM
-
2026-06-15days on market $39,900 Active 223 DOM
-
2026-06-14days on market $39,900 Active 221 DOM
-
2026-06-12days on market $39,900 Active 220 DOM
-
2026-06-09days on market $39,900 Active 217 DOM
-
2026-06-08days on market $39,900 Active 216 DOM
-
2026-06-07days on market $39,900 Active 215 DOM
-
2026-06-05days on market $39,900 Active 212 DOM
-
2026-06-03days on market $39,900 Active 211 DOM
-
2026-06-02days on market $39,900 Active 210 DOM
-
2026-06-01days on market $39,900 Active 209 DOM
-
2026-05-31days on market $39,900 Active 208 DOM
-
2026-05-30days on market $39,900 Active 207 DOM
-
2026-04-30price $39,900
-
2026-03-21price $47,900
-
2026-02-13price $49,900
-
2026-01-01price $51,900
-
2025-12-09price $55,900
-
2025-11-04$59,900 Active
ⓘ Source: listings_history table (triggers on properties + properties_extension) + one-shot
backfill from property_details.listing_events for pre-trigger history.
Tax reassessment forecast WV · Resets to sale price
- Current annual tax
- $1,254 · $104/mo
- Projected year-2 tax
- $1,254 · $104/mo
- Expected delta
- $0/yr ($0/mo · 0.0%)
ⓘ Screening estimate from a state-policy table — verify with the county assessor before closing.
Climate risk First Street
- Flood 1/10 Low FEMA zone X (unshaded) · 0% chance over 30 yrs
- Wildfire 4/10 Moderate
- Heat 4/10 Moderate 7 d/yr ≥101°F today · 20 d/yr by 30 yrs out
- Wind 2/10 Low 100% chance of damaging wind over 30 yrs
- Air quality 2/10 Low 1 unhealthy d/yr today · 2 by 30 yrs out
Nearby sold comps map
Loading sold comps map…
Walkable amenities ~0.75 mi
Loading nearby amenities…
Taxation est. · year 1
- Rental income
- $20,796
- − Mortgage interest
- −$2,235
- − Property taxes
- −$1,254
- − Insurance
- −$200
- − Repairs & maintenance
- −$1,664
- − Management
- −$1,664
- − Depreciation
- −$1,161
- Taxable income
- $12,620
- Est. tax owed @ 24.0%
- −$3,029
- After-tax cash flow
- $9,436/yr
For passive investors: Depreciation is non-cash, so a rental often shows a tax loss while cash-flowing — sheltering income. Rental losses are passive: they offset passive income freely, and up to $25,000/yr can offset ordinary (W-2) income if you actively participate and your MAGI is under $100k (phasing out to $0 by $150k); unused losses carry forward. On sale, claimed depreciation is recaptured at up to 25%, and gains may owe capital-gains tax (a 1031 exchange can defer both). Figures are a year-1 estimate at your 24.0% rate — not tax advice; consult a CPA.
Schools (NCES district)
- District
- Kanawha County Schools
- NCES district ID
- 5400600
- Math proficiency
- 29% ▼ -13.00%
- Reading proficiency
- 40% ▼ -7.00%
- Median HH income
- $44,329
- Composite
- 29.35/100
- National rank
- #6540
- State rank
- #17 of 55 in WV
Livability — Clendenin
- Score
- 61/100
- State rank
- #194
- US rank
- #17375
Category grades
Schools grade is shown separately in the Schools card above.
Census & demographics
- Census place
- Clendenin, WV
- Population (ZIP)
- 4,230
Population outlook (Kanawha County) Hauer SSP2
- Today (2025)
- 178,946 people
- By 2030
- 172,906 · -3.4%
- By 2040
- 159,874 · -10.7%
- By 2050
- 148,148 · -17.2%
- By 2075
- 123,257 · -31.1%
- By 2100
- 96,454 · -46.1%
Race, ethnicity, and origin ACS 2023
- Neighborhood character
- Predominantly White (99%)
- Race & ethnicity
- White 99%
- Common ancestry
- Serbian 1% Italian 1% Lithuanian 1%
Political lean MEDSL · Kanawha
- 2024 margin
- R (+17.4) · D 40.2% · R 57.6% · Other 2.2%
- 2008→2024 swing
- -17.0pp toward R · 2008: -0.4pp · 2024: -17.4pp
- All cycles
- 2024: R+17.4 2020: R+14.7 2016: R+20.6 2012: R+11.9 2008: R+0.4
Not yet ingested
- Civics
- —
Market trends
- HPI YoY
- ▲ 0.40%
- Current HPI
- 287.7117
- Rent YoY
- —
- Metro
- —
- State GDP YoY
- —
- F500 in state
- 0
Price history
-33.4% since first listed6 events — show timeline
- 2026-04-30 Price Changed $39,900 GVBOR
- 2026-03-21 Price Changed $47,900 GVBOR
- 2026-02-13 Price Changed $49,900 GVBOR
- 2026-01-01 Price Changed $51,900 GVBOR
- 2025-12-09 Price Changed $55,900 GVBOR
- 2025-11-04 Listed $59,900 GVBOR
Property tax history
+1.9%/yrLatest (2025): $1,254 · +0.0% YoY. Source: county tax records.
Cash-flow waterfall
monthlySold comps — $/sqft
last 12 mo · ≤1 miLoading sold comps…