1523 Highgate Ave · Los Angeles, CA
Flood risk 1/10 · Minimal
- FEMA flood zone
- X (unshaded)
- Chance of flooding over 30 yrs
- 0.0%
- Est. flood insurance / yr
- $507 – $1,088
Fire risk 4/10 · Minor
- Est. fire insurance / yr
- $659 – $1,223
Heat risk 5/10 · Moderate
- Hot days now (above 97°F)
- 7 days/yr
- Hot days in 30 yrs
- 20 days/yr
Wind risk 1/10 · Minimal
- Chance of severe wind over 30 yrs
- —
Air-quality risk 6/10 · Moderate
- Unhealthy air days now
- 11 days/yr
- Unhealthy air days in 30 yrs
- 12 days/yr
Risk factors via First Street. Map © Google.
Why this score? — see what drove the D grade
The composite is a weighted blend of 9 inputs, each scored 0–100. Each bar is that input's sub-score; the figure is the points it added to the 100-point composite (weight × sub-score).
- Cash flow +15.3/30.0
- ARV discount +7.5/15.0
- DSCR +4.7/10.0
- Schools +3.6/10.0
- Livability +3.4/5.0
- 1% rule +3.3/10.0
- Rent growth +2.8/5.0
- Condition / age +2.5/5.0
- Appreciation +0.0/10.0
$450,000
🖨 Deal sheet (PDF) 📄 Offer letter ✓ Due diligence
Listing remarks MLS
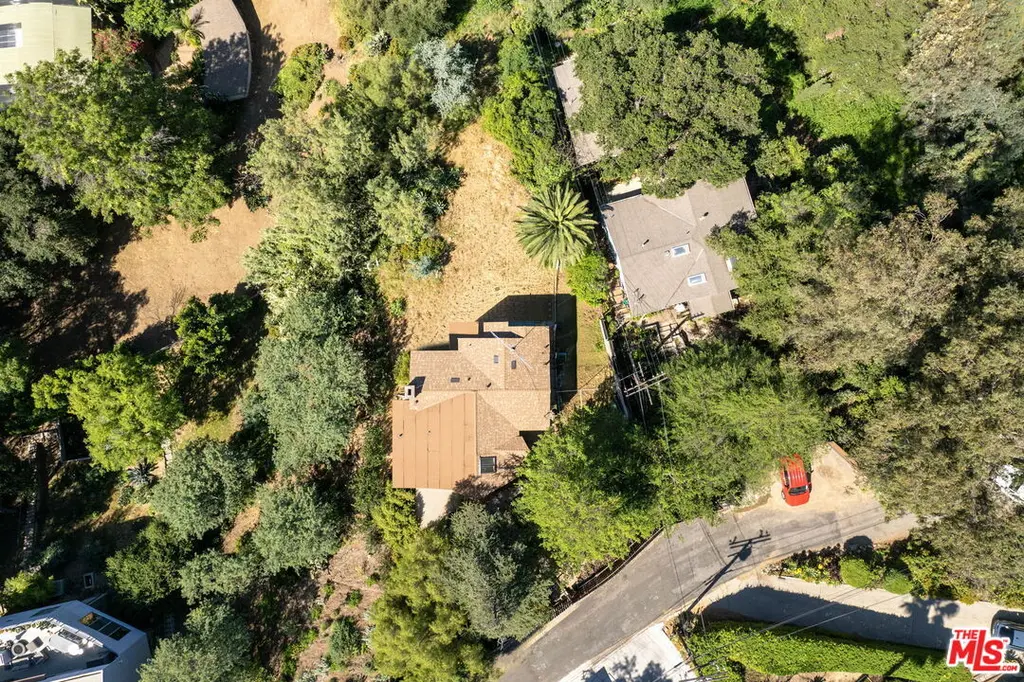
PRICED - AT - LAND - VALUE; Trust Sale - SUBJECT TO, LA City Order to Comply, available for review upon request, Buyer's sole responsibility. This 8,583 sq ft elevated lot (49x176) features sweeping city and hillside views of Highland Park & beyond. Gated, Private and positioned for the right investor or builder. Seller makes no representations regarding existing structure. Buyer to verify all Zoning, Development potential & LA City Compliance to confirm desired use.
Key facts
- Spacious backyard
- Newer roof
- Sweeping views
Tags
Neighborhood map
What this means for you Summary
Snapshot
- This is a 3-bed/2.0-bath single-family listed at $450k.
Deal economics
- At list price, monthly cash flow is $167 ($2k/yr) — positive.
- The deal already cash-flows at list — no discount required.
- To meet the 1% rule (rent ≥ 1% of price), the offer needs to be $373k (17.0% below list).
- Recommended offer: $373k (17.0% below list) — sets the bar for 1% rule.
- Cap rate 6.7% vs local median 2.1% in Los Angeles — top-decile yield for the area; either an underpriced asset or a hidden risk that comps aren't pricing in. Stress-test before assuming the spread holds.
Location & tenants
- Location reads 68/100 on livability (#273 in CA) — a middle-class / working-renter tenant base. Strengths: amenities A+, commute A+, employment B; Watch: health & safety C-, schools D+, crime F.
- Los Angeles Unified (urban): math 29% / reading 54% proficiency, ranked #223 of 517 in CA (top 43%) — families likely to look elsewhere, expect single-tenant / working-renter base with shorter leases; 67% free/reduced lunch — lower-income household profile, screen leases tightly.
- Market conditions: Rents rising (+1.3%/yr); 180 active listings in the ZIP; 40 comparable units currently listed for rent nearby; rentals at typical pace (median 23d on market — plan ~3-4 weeks tenant-placement turnaround); solid renter incomes; 19,697 units permitted in Los Angeles County in 2024 (9,426 in 5+ unit buildings).
- At $3,734/mo this rent would consume 47% of the median local household income ($95k/yr) (locally 2699% of renters already pay >50% of income on rent) — very limited rent-growth headroom before tenants either downsize or default.
Forward outlook
- Local home prices are declining (-3.0%/yr); year-one equity from $3k of loan paydown is wiped out by about $14k of value loss. Plan a longer hold.
- Los Angeles County population projected at +9% by 2050 — modest demand growth; plan on rents tracking national, not racing it.
Negotiation context
- It's been on market 69 days — a 6% lower offer ($423k) is reasonable based on typical stale-listing flexibility.
- 3 sale attempts; this cycle's ask has dropped $345k (43%) from the opening price — seller is motivated, your offer sets the floor, not the list.
- Current owner paid $35k; list at $450k implies a 1186% gain — meaningful room to come down on a strong offer.
Risks & watch-outs
- Watch-outs: built in 1926 — expect roof / HVAC / electrical / plumbing capex.
- Climate carrying-cost: extreme-heat days projected 7→20/yr by 2055 (HVAC capex compounding) — expect insurance premiums to compound above CPI over the hold.
Questions for the listing agent
- It's been on market 69 days. Have you received any prior offers? Is the seller open to a 17% concession, seller financing, or rate buy-down credit?
- Built in 1926 — when were the roof, HVAC, electrical panel, plumbing, and water heater last replaced?
- Why hasn't it sold? Are there any deal-killer items the seller is aware of (foundation, flood, title, zoning, code violations)?
- Is there a deadline driving the sale (1031 exchange, divorce, estate, relocation)? That informs how much negotiation room exists.
- Schools are D-rated, which usually means shorter tenancies and higher turnover. Who's the typical renter profile here, and what's been the actual vacancy rate?
- Crime grade is F in this area — have there been break-ins, vandalism, or insurance claims at this property in the last 3 years? What carrier currently insures it and at what premium?
- The area grade is low — what's the realistic commute time and amenity access for the typical tenant pool here? Any planned neighborhood developments (good or bad) we should know about?
- What's the average days-on-market for RENTAL listings here right now (not sales)? A rising rental-DOM trend means longer vacancies and softer asking-rent achievability than the comps imply.
- What's the recent tenant-quality profile in this submarket — average credit score on applications, eviction rate, late-payment / NSF rate, and stable-employment percentage? A property-management company in the area should have these aggregated.
- How much new for-sale + rental construction is in the pipeline within 1–3 miles? Heavy new supply typically softens prices + rents 12–24 months out; constrained supply supports both.
Investment metrics
- 1% rule
- 0.83% ✗
- Cap rate
- 6.74%
- Cash-on-cash
- 1.60%
- DSCR
- 1.07
- GRM
- 10.0
CMA / ARV
- ARV (median comp)
- $1,253,916
- List price
- $450,000
- Delta
- -64.11%
- Verdict
- UNDERPRICED
- Comps
- 20 within 1.0 mi
Show comp detail 12 sales within ~0.75 mi
| Address | Dist | Beds/Ba | Sqft | Sold | Price | $/sf | Match |
|---|---|---|---|---|---|---|---|
| 1408 Highgate Ave | 0.17mi | 3/2.0 | 1,144 (+4%) | 6mo | $1,300,000 | $1,136 | 80 |
| 6134 Strickland Ave | 0.40mi | 3/2.0 | 1,106 (+1%) | 7mo | $1,275,000 | $1,153 | 74 |
| 732 Onarga Ave | 0.18mi | 2/1.0 (-1) | 1,196 (+9%) | 6mo | $740,000 | $619 | 63 |
| 411 Kirby St | 0.61mi | 3/2.0 | 1,152 (+5%) | 2mo | $880,000 | $764 | 61 |
| 4764 Wiota St | 0.41mi | 2/2.0 (-1) | 987 (-10%) | 3mo | $1,070,000 | $1,084 | 57 |
| 5413 Meridian St | 0.54mi | 3/1.0 | 1,040 (-5%) | 7mo | $1,035,000 | $995 | 56 |
| 6149 Annan Way | 0.41mi | 4/1.0 (+1) | 996 (-9%) | 5mo | $675,000 | $678 | 53 |
| 6024 Crestwood Way | 0.30mi | 2/1.0 (-1) | 936 (-15%) | 3mo | $1,252,000 | $1,338 | 50 |
| 6225 Saylin Ln | 0.69mi | 2/1.0 (-1) | 1,160 (+6%) | 2mo | $1,575,000 | $1,358 | 48 |
| 1597 Fair Park Ave | 0.68mi | 2/1.0 (-1) | 1,150 (+5%) | 4mo | $875,000 | $761 | 48 |
| 1902 N Avenue 51 | 0.56mi | 2/2.0 (-1) | 978 (-11%) | 7mo | $1,232,000 | $1,260 | 45 |
| 6218 Saylin Lane Ln | 0.69mi | 2/1.0 (-1) | 1,025 (-6%) | 7mo | $975,000 | $951 | 42 |
Match score weights: distance 35% · size 25% · config 20% · recency 20%. Top-matched comps best support the ARV.
Projected returns pro-forma
-3.0% appreciation · 1.34% rent growth · sell at horizon
- IRR
- -15.5%
- Equity multiple
- 0.46×
- Total profit
- $-68,534
- Equity at exit
- $67,096
- IRR
- -9.9%
- Equity multiple
- 0.44×
- Total profit
- $-70,884
- Equity at exit
- $38,908
Cash invested: $126,000 (down + closing). Projections, not guarantees.
Landlord ↔ Tenant lean methodology
- Overall (CITY)
- 0 Strongly Tenant-Friendly
- State California
- 18 Strongly Tenant-Friendly · D+13
- County
- — inherits STATE
- City Los Angeles
- 0 Strongly Tenant-Friendly · D+22
ZIP-level market 90042
- Rents YoY
- 1.3%
- Active inventory
- 180
- Price-to-rent
- 10.0×
Monthly cashflow live
- Estimated rent
- $3,734 high interval (Pro) →
- Mortgage (P&I)
- −$2,360
- Tax from tax record
- −$235 /mo · $2,824/yr
- Insurance
- −$188
- HOA
- −$0
- Vacancy / Maint / Mgmt
- −$784
- Net cashflow
- $167
Break-even live
Sensitivity live
| Price | -10% $422 | -5% $295 | +0% $167 | +5% $40 | +10% $-87 |
|---|---|---|---|---|---|
| Rent | -10% $-128 | -5% $20 | +0% $167 | +5% $315 | +10% $462 |
| Rate | -1.0pp $394 | -0.5pp $282 | base $167 | +0.5pp $51 | +1.0pp $-68 |
UW: 25.0% down · 7.5% · 30yr · 1.5% tax · 5.0% vac · 8.0% maint · 8.0% mgmt
Financing live
Cash to close
- Down payment
- $112,500
- Closing costs
- $13,500
- Reserves months
- —
- Total cash needed
- —
Loan-product check · same deal, 3 products live
Conventional
25% down · 7.5% · 30yr
- Down + closing
- —
- Monthly P&I
- —
- Monthly cashflow
- —
- DSCR
- —
- Eligible?
- —
Personal DTI + credit; lowest rate.
DSCR
20% down · 8.5% · 30yr
- Down + closing
- —
- Monthly P&I
- —
- Monthly cashflow
- —
- DSCR
- —
- Eligible?
- —
No personal income docs; deal must DSCR.
Hard money
10% down · 12.0% · 12mo
- Down + closing
- —
- Monthly P&I
- —
- Monthly cashflow
- —
- DSCR
- —
- Eligible?
- —
Short-term bridge; refi at stabilization.
Rent comps 40 comps
| Address | Beds | Baths | Sqft | Rent | $/sqft | DOM | Units | Dist |
|---|---|---|---|---|---|---|---|---|
| 807 Annan Ter Los Angeles, CA | 2.0 | 1.0 | 804 | $3,650 | $4.54 | 44d | 1 | 0.15mi |
| 1408 Oak Grove Dr Eagle Rock, CA | 2.0 | 1.5 | 1500 | $5,300 | $3.53 | 8d | 1 | 0.32mi |
| 6819 N Figueroa St Unit 21 Los Angeles, CA | 2.0 | 1.0 | 760 | $2,195 | $2.89 | 17d | 1 | 0.35mi |
| 6819 N Figueroa St Unit 21 Los Angeles, CA | 2.0 | 1.0 | 760 | $2,195 | $2.89 | 0d | 1 | 0.35mi |
| 6072 La Prada St Los Angeles, CA | 2.0 | 1.5 | 900 | $2,562 | $2.85 | 44d | 1 | 0.37mi |
| 6092 La Prada Unit 6092 Los Angeles, CA | 4.0 | 4.0 | 1414 | $4,068 | $2.88 | 0d | 1 | 0.39mi |
| 6096 La Prada Los Angeles, CA | 4.0 | 4.0 | 1414 | $4,156 | $2.94 | 8d | 1 | 0.41mi |
| 1733 North Avenue 53 Los Angeles, CA | 2.0 | 2.0 | 800 | $3,499 | $4.37 | 12d | 1 | 0.44mi |
| 6126 Springvale Dr Los Angeles, CA | 4.0 | 1.0 | 1056 | $3,800 | $3.60 | 44d | 1 | 0.45mi |
| 6217 Poppy Peak Dr Los Angeles, CA | 3.0 | 2.0 | 1100 | $5,000 | $4.55 | 44d | 1 | 0.50mi |
| 6512 Aldama St Los Angeles, CA | 3.0 | 1.5 | 1018 | $4,500 | $4.42 | 17d | 1 | 0.51mi |
| 6607 N Figueroa St Unit 16 Highland Park, CA | 2.0 | 1.0 | 750 | $2,750 | $3.67 | 25d | 1 | 0.56mi |
| 6607 N Figueroa St Los Angeles, CA | 2.0 | 1.0 | 750 | $2,750 | $3.67 | 44d | 1 | 0.56mi |
| 5206 Range View Ave Los Angeles, CA | 2.0 | 1.5 | 900 | $3,950 | $4.39 | 44d | 1 | 0.57mi |
| 5213 Meridian St Unit 5 Highland Park, CA | 2.0 | 1.0 | 850 | $2,500 | $2.94 | 8d | 1 | 0.62mi |
| 6180 Aldama St Los Angeles, CA | 2.0 | 1.5 | 900 | $2,895 | $3.22 | 44d | 1 | 0.68mi |
| 4819 Vincent Ave Los Angeles, CA | 2.0 | 1.0 | 800 | $3,500 | $4.38 | 44d | 1 | 0.73mi |
| 6190 Mesa Ave Los Angeles, CA | 3.0 | 2.0 | 1000 | $4,500 | $4.50 | 0d | 1 | 0.75mi |
| 6271 Saylin Ln Los Angeles, CA | 2.0 | 2.0 | 1424 | $7,100 | $4.99 | 44d | 1 | 0.75mi |
| 6417-6422 N Figueroa St Los Angeles, CA | 1.0–2.0 | 1.0–2.0 | 889 | $3,825 | $4.30 | 8d | 1 | 0.79mi |
| 1597 Grandola Ave Los Angeles, CA | 2.0 | 1.0 | 896 | $3,570 | $3.98 | 44d | 1 | 0.83mi |
| 380 Tamarac Dr Pasadena, CA | 3.0 | 1.0 | 1296 | $5,500 | $4.24 | 44d | 1 | 0.83mi |
| 5622 Aldama St Los Angeles, CA | 3.0 | 2.0 | 1323 | $4,995 | $3.78 | 44d | 1 | 0.91mi |
| 5237 Irvington Pl Los Angeles, CA | 2.0 | 1.0 | 750 | $3,850 | $5.13 | 19d | 1 | 0.93mi |
| 4921 La Roda Ave Unit 1 Eagle Rock, CA | 2.0 | 1.0 | 1000 | $3,599 | $3.60 | 25d | 1 | 0.96mi |
| 1829 Fair Park Ave Los Angeles, CA | 2.0 | 1.0 | 1064 | $3,995 | $3.75 | 14d | 1 | 0.98mi |
| 1020 North Avenue 51 Los Angeles, CA | 3.0 | 2.5 | 1330 | $5,995 | $4.51 | 25d | 1 | 0.99mi |
| 5046 La Roda Ave Unit 1 Los Angeles, CA | 3.0 | 2.0 | 1200 | $5,100 | $4.25 | 44d | 1 | 1.02mi |
| 6208 Arroyo Glen St Unit 06 Los Angeles, CA | 2.0 | 1.0 | 800 | $2,500 | $3.12 | 21d | 1 | 1.03mi |
| 6320 Garvanza Ave Los Angeles, CA | 3.0 | 2.0 | 1150 | $4,235 | $3.68 | 8d | 3 | 1.04mi |
| 229 Glenullen Dr Pasadena, CA | 3.0 | 2.0 | 1265 | $6,700 | $5.30 | 3d | 1 | 1.10mi |
| 127 South Avenue 64 Unit 1272 Los Angeles, CA | 2.0 | 1.0 | 775 | $2,195 | $2.83 | 8d | 1 | 1.10mi |
| 6418 Garvanza Ave Apt 4 Highland Park, CA | 2.0 | 1.0 | 780 | $2,175 | $2.79 | 19d | 1 | 1.10mi |
| 5423 Ash St Los Angeles, CA | 2.0 | 2.0 | 800 | $3,195 | $3.99 | 25d | 1 | 1.13mi |
| 729 North Avenue 66 Highland Park, CA | 2.0 | 1.0 | 850 | $2,850 | $3.35 | 14d | 1 | 1.13mi |
| 222 North Avenue 66 Unit 22 Highland Park, CA | 3.0 | 1.5 | 1250 | $3,195 | $2.56 | 25d | 1 | 1.18mi |
| 222 N Avenue 66 Los Angeles, CA | 3.0 | 1.0 | 1250 | $3,195 | $2.56 | 22d | 1 | 1.18mi |
| 4826 Hub St Unit 1 Los Angeles, CA | 3.0 | 3.0 | 1460 | $5,000 | $3.42 | 25d | 1 | 1.19mi |
| 4958 N Maywood Ave Los Angeles, CA | 2.0 | 1.0 | 850 | $2,595 | $3.05 | 8d | 1 | 1.20mi |
| 229 South Avenue 60 Apt 2 Highland Park, CA | 3.0 | 1.0 | 915 | $3,300 | $3.61 | 15d | 1 | 1.22mi |
Listing history 11 events
-
2026-06-07status $450,000 Pending 69 DOM
-
2026-06-04days on market $450,000 Backup Offers Accepted 69 DOM
-
2026-06-03days on market $450,000 Backup Offers Accepted 68 DOM
-
2026-06-02days on market $450,000 Backup Offers Accepted 67 DOM
-
2026-06-01days on market $450,000 Backup Offers Accepted 66 DOM
-
2026-05-31days on market $450,000 Backup Offers Accepted 65 DOM
-
2026-05-19historical Backup Offers Accepted 483-char remark
Show marketing remark (483 chars)
PRICED - AT - LAND - VALUE; Trust Sale - SUBJECT TO, LA City Order to Comply, available for review upon request, Buyer's sole responsibility. This 8,583 sq ft elevated lot (49x176) features sweeping city and hillside views of Highland Park & beyond. Gated, Private and positioned for the right investor or builder. Seller makes no representations regarding existing structure. Buyer to verify all Zoning, Development potential & LA City Compliance to confirm desired use.
-
2026-05-13status Active 483-char remark
Show marketing remark (483 chars)
PRICED - AT - LAND - VALUE; Trust Sale - SUBJECT TO, LA City Order to Comply, available for review upon request, Buyer's sole responsibility. This 8,583 sq ft elevated lot (49x176) features sweeping city and hillside views of Highland Park & beyond. Gated, Private and positioned for the right investor or builder. Seller makes no representations regarding existing structure. Buyer to verify all Zoning, Development potential & LA City Compliance to confirm desired use.
-
2026-04-21status Active 483-char remark
Show marketing remark (483 chars)
PRICED - AT - LAND - VALUE; Trust Sale - SUBJECT TO, LA City Order to Comply, available for review upon request, Buyer's sole responsibility. This 8,583 sq ft elevated lot (49x176) features sweeping city and hillside views of Highland Park & beyond. Gated, Private and positioned for the right investor or builder. Seller makes no representations regarding existing structure. Buyer to verify all Zoning, Development potential & LA City Compliance to confirm desired use.
-
2026-03-25$795,000 Active 483-char remark
Show marketing remark (483 chars)
PRICED - AT - LAND - VALUE; Trust Sale - SUBJECT TO, LA City Order to Comply, available for review upon request, Buyer's sole responsibility. This 8,583 sq ft elevated lot (49x176) features sweeping city and hillside views of Highland Park & beyond. Gated, Private and positioned for the right investor or builder. Seller makes no representations regarding existing structure. Buyer to verify all Zoning, Development potential & LA City Compliance to confirm desired use.
-
1977-10-06soldstatus $35,000
ⓘ Source: listings_history table (triggers on properties + properties_extension) + one-shot
backfill from property_details.listing_events for pre-trigger history.
Tax reassessment forecast CA · Resets to sale price
- Current annual tax
- $2,824 · $235/mo
- Projected year-2 tax
- $3,420 · $285/mo
- Expected delta
- +$596/yr (+$50/mo · 21.1%)
ⓘ Screening estimate from a state-policy table — verify with the county assessor before closing.
Climate risk First Street
- Flood 1/10 Low FEMA zone X (unshaded) · 0% chance over 30 yrs
- Wildfire 4/10 Moderate
- Heat 5/10 Major 7 d/yr ≥97°F today · 20 d/yr by 30 yrs out
- Wind 1/10 Low
- Air quality 6/10 Major 11 unhealthy d/yr today · 12 by 30 yrs out
Nearby sold comps map
Loading sold comps map…
Walkable amenities ~0.75 mi
Loading nearby amenities…
Taxation est. · year 1
- Rental income
- $44,813
- − Mortgage interest
- −$25,207
- − Property taxes
- −$2,824
- − Insurance
- −$2,250
- − Repairs & maintenance
- −$3,585
- − Management
- −$3,585
- − Depreciation
- −$13,091
- Taxable loss
- −$5,729
- Est. tax savings @ 24.0%
- +$1,375
- After-tax cash flow
- $3,385/yr
For passive investors: Depreciation is non-cash, so a rental often shows a tax loss while cash-flowing — sheltering income. Rental losses are passive: they offset passive income freely, and up to $25,000/yr can offset ordinary (W-2) income if you actively participate and your MAGI is under $100k (phasing out to $0 by $150k); unused losses carry forward. On sale, claimed depreciation is recaptured at up to 25%, and gains may owe capital-gains tax (a 1031 exchange can defer both). Figures are a year-1 estimate at your 24.0% rate — not tax advice; consult a CPA.
Schools (NCES district)
- District
- Los Angeles Unified
- NCES district ID
- 0622710
- Math proficiency
- 29% ▼ -4.00%
- Reading proficiency
- 54% ▲ 10.00%
- Median HH income
- $50,403
- Composite
- 35.67/100
- National rank
- #4875
- State rank
- #223 of 517 in CA
Livability — Los Angeles
- Score
- 68/100
- State rank
- #273
- US rank
- #9237
Category grades
Schools grade is shown separately in the Schools card above.
Census & demographics
- Census place
- Los Angeles, CA
- County
- Los Angeles County · 9,444,647 people
- City population
- 3,838,149
- Metro
- Los Angeles-Long Beach-Anaheim, CA
- Population (ZIP)
- 56,835
- Household income
- $95,282
- Rent vs Own
- Severe rent burden
- 2699.0
Population outlook (Los Angeles County) Hauer SSP2
- Today (2025)
- 10,940,515 people
- By 2030
- 11,256,481 · +2.9%
- By 2040
- 11,729,929 · +7.2%
- By 2050
- 11,948,407 · +9.2%
- By 2075
- 11,818,114 · +8.0%
- By 2100
- 10,842,928 · -0.9%
Race, ethnicity, and origin ACS 2023
- Neighborhood character
- Diverse neighborhood (Simpson 0.60)
- Race & ethnicity
- Hispanic / Latino 56% White 24% Two or more races 22% Asian 13% Native American 3% Black 2%
- Hispanic origin (detail)
- Mexican 41%
- Common ancestry
- Lithuanian 2% Romanian 2% Slovak 1%
- Foreign-born
- 36% · Canada, China, South Korea
- Languages at home
- 40% English-only · Spanish 47% Tagalog/Filipino 5% Chinese 2%
Political lean MEDSL · Los Angeles
- 2024 margin
- Solid D (+32.9) · D 64.8% · R 31.9% · Other 3.3%
- 2008→2024 swing
- -7.4pp toward R · 2008: 40.4pp · 2024: 32.9pp
- All cycles
- 2024: D+32.9 2020: D+44.2 2016: D+48.0 2012: D+40.0 2008: D+40.4
Not yet ingested
- Civics
- —
Market trends
- HPI YoY
- ▼ -1816.99%
- Current HPI
- 637.0324
- Rent YoY
- ▲ 1.34%
- Metro
- Los Angeles-Long Beach-Anaheim, CA
- State GDP YoY
- ▲ 3.21%
- F500 in state
- 116
Industry mix (Fortune 500 HQ in CA)
| Industry | F500 HQs | Revenue |
|---|---|---|
| Technology | 27 | $1,492B |
|
||
| Financial Services | 3 | $174B |
|
||
| Retail | 3 | $44B |
|
||
| Insurance | 3 | $26B |
|
||
| Media / Entertainment | 2 | $115B |
|
||
| Pharmaceuticals / Biotech | 2 | $62B |
|
||
Price history
+2171.4% since first listed5 events — show timeline
- 2026-05-19 Contingent — TheMLS
- 2026-05-13 Relisted — TheMLS
- 2026-04-21 Relisted — TheMLS
- 2026-03-25 Listed $795,000 TheMLS
- 1977-10-06 Sold (Public Records) $35,000 Public Records
Property tax history
+1.7%/yrLatest (2025): $2,824 · +1.2% YoY. Source: county tax records.
Cash-flow waterfall
monthlySold comps — $/sqft
last 12 mo · ≤1 miLoading sold comps…