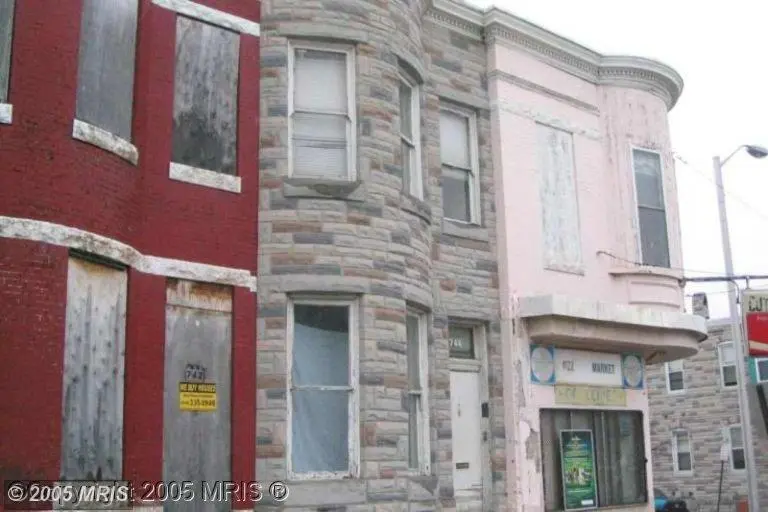
744 N Patterson Park Ave · Baltimore, MD
Flood risk 1/10 · Minimal
- FEMA flood zone
- X (unshaded)
- Chance of flooding over 30 yrs
- 0.0%
- Est. flood insurance / yr
- $507 – $1,088
Fire risk 1/10 · Minimal
- Est. fire insurance / yr
- $755 – $1,403
Heat risk 8/10 · Major
- Hot days now (above 103°F)
- 7 days/yr
- Hot days in 30 yrs
- 15 days/yr
Wind risk 6/10 · Moderate
- Chance of severe wind over 30 yrs
- 27.0%
Air-quality risk 4/10 · Minor
- Unhealthy air days now
- 6 days/yr
- Unhealthy air days in 30 yrs
- 7 days/yr
Risk factors via First Street. Map © Google.
Why this score? — see what drove the B- grade
The composite is a weighted blend of 9 inputs, each scored 0–100. Each bar is that input's sub-score; the figure is the points it added to the 100-point composite (weight × sub-score).
- Cash flow +30.0/30.0
- 1% rule +10.0/10.0
- DSCR +10.0/10.0
- ARV discount +7.5/15.0
- Rent growth +5.0/5.0
- Livability +3.8/5.0
- Condition / age +2.5/5.0
- Schools +1.0/10.0
- Appreciation +0.0/10.0
$80,000
🖨 Deal sheet (PDF) 📄 Offer letter ✓ Due diligence
Listing remarks MLS
Hopkins area, 700 block of Patterson Park. Updated electric, plumbing, new HVAC, Large curved front unit Rental at $725 with an added investment of appliances, bath
Key facts
- Quartz countertops
- Modern fireplace
- Large island
Tags
Property features AI
Finance
- Financial info: Ground rent payments semi-annually
Exterior
- Parking: On-street parking
- Utilities: Public water; Public sewer; Electric hot water
- Home design: Interior townhouse / rowhouse; Year of major renovation: 2025; Ownership includes ground rent (paid semi-annually)
- Construction: Brick construction; Concrete perimeter foundation
- Exterior features: Exterior lighting; Patio(s); Wood fencing
Interior
- Kitchen: Disposal; Built-in microwave; Stove / Oven - Electric; Dishwasher; Stainless steel appliances; Refrigerator
- Basement: Fully finished basement with walkout stairs; Approximately 95% finished
- Bedrooms: Two bedrooms on the first upper level; One bedroom on the first lower level
- Flooring: Luxury vinyl plank; Ceramic tile; Carpet
- Bathrooms: Three full bathrooms; One half bathroom
- Heating & cooling: Central heating; Central air conditioning; Ceiling fans; Electric heating and cooling
- Interior features: Ceiling fans; Recessed lighting; Kitchen island; Walk-in closet(s); Drywall walls and ceilings
- Laundry & utility: Water heater
Neighborhood map
What this means for you Summary
Snapshot
- This is a 3-bed/1.0-bath townhouse listed at $80k.
Deal economics
- At list price, monthly cash flow is $1k ($12k/yr) — positive.
- The deal already cash-flows at list — no discount required.
- Meets the 1% rule at list price ($2k rent vs $80k).
- Cap rate 21.5% vs local median 6.0% in Baltimore — top-decile yield for the area; either an underpriced asset or a hidden risk that comps aren't pricing in. Stress-test before assuming the spread holds.
Location & tenants
- Location reads 76/100 on livability (#90 in MD, #3,396 nationally) — a middle-class / working-renter tenant base. Strengths: amenities A+, commute A+, housing A+; Watch: schools D, crime F.
- Baltimore City Public Schools (urban): math 7% / reading 16% proficiency, ranked #24 of 24 in MD (top 100%) — low school quality limits family demand, transient renter base, plan for 1-2y turnover; 79% free/reduced lunch — lower-income household profile, screen leases tightly.
- Market conditions: Rents rising fast (+9.9%/yr); 143 active listings in the ZIP; 13 comparable units currently listed for rent nearby; rentals at typical pace (median 18d on market — plan ~3-4 weeks tenant-placement turnaround); lower-income renter base — watch delinquency; 1,273 units permitted in Baltimore city in 2024 (1,104 in 5+ unit buildings).
- At $1,910/mo this rent would consume 53% of the median local household income ($43k/yr) (locally 966% of renters already pay >50% of income on rent) — very limited rent-growth headroom before tenants either downsize or default.
Forward outlook
- Local home prices are declining (-3.0%/yr); year-one equity from $553 of loan paydown is wiped out by about $2k of value loss. Plan a longer hold.
- Baltimore County population projected to shrink 4% by 2050 — rents likely to lag national; underwrite the cash flow, not the appreciation.
- At projected returns (-3.0% appreciation + 8.0% rent growth), your $22k cash investment doubles in ~3 years — after that, you're playing with house money.
Negotiation context
- Only 1 days on market — expect competitive offers; lowballing is unlikely to land.
- 7 sale attempts since 23y ago with the ask held roughly flat each time — persistent listings suggest the price (not the market) is what's stuck; bring a comps-based counter.
Risks & watch-outs
- Watch-outs: built in 1920 — expect roof / HVAC / electrical / plumbing capex.
- Climate carrying-cost: major wind risk, 27% chance of damaging wind over 30y; extreme-heat days projected 7→15/yr by 2055 (HVAC capex compounding) — expect insurance premiums to compound above CPI over the hold.
Questions for the listing agent
- Built in 1920 — when were the roof, HVAC, electrical panel, plumbing, and water heater last replaced?
- Is there a deadline driving the sale (1031 exchange, divorce, estate, relocation)? That informs how much negotiation room exists.
- Schools are D-rated, which usually means shorter tenancies and higher turnover. Who's the typical renter profile here, and what's been the actual vacancy rate?
- Crime grade is F in this area — have there been break-ins, vandalism, or insurance claims at this property in the last 3 years? What carrier currently insures it and at what premium?
- What's the average days-on-market for RENTAL listings here right now (not sales)? A rising rental-DOM trend means longer vacancies and softer asking-rent achievability than the comps imply.
- What's the recent tenant-quality profile in this submarket — average credit score on applications, eviction rate, late-payment / NSF rate, and stable-employment percentage? A property-management company in the area should have these aggregated.
- How much new for-sale + rental construction is in the pipeline within 1–3 miles? Heavy new supply typically softens prices + rents 12–24 months out; constrained supply supports both.
Investment metrics
- 1% rule
- 2.39% ✓
- Cap rate
- 21.52%
- Cash-on-cash
- 54.38%
- DSCR
- 3.42
- GRM
- 3.5
CMA / ARV
- ARV (median comp)
- $295,762
- List price
- $80,000
- Delta
- -32.41%
- Verdict
- UNDERPRICED
- Comps
- 20 within 1.0 mi
Show comp detail 4 sales within ~0.75 mi
| Address | Dist | Beds/Ba | Sqft | Sold | Price | $/sf | Match |
|---|---|---|---|---|---|---|---|
| 2305 Ashland Ave | 0.09mi | 3/1.0 | 616 (+2%) | 4mo | $78,000 | $127 | 90 |
| 506 N Patterson Park Ave | 0.19mi | 3/1.5 | 640 (+6%) | 8mo | $78,000 | $122 | 73 |
| 203 S Madeira St | 0.73mi | 2/1.0 (-1) | 601 (-1%) | 7mo | $110,250 | $183 | 54 |
| 26 N Madeira St | 0.49mi | 2/2.0 (-1) | 672 (+11%) | 7mo | $103,000 | $153 | 45 |
Match score weights: distance 35% · size 25% · config 20% · recency 20%. Top-matched comps best support the ARV.
Projected returns pro-forma
-3.0% appreciation · 8.0% rent growth · sell at horizon
- IRR
- 58.0%
- Equity multiple
- 3.76×
- Total profit
- $61,777
- Equity at exit
- $11,928
- IRR
- 64.5%
- Equity multiple
- 9.17×
- Total profit
- $182,961
- Equity at exit
- $6,917
Cash invested: $22,400 (down + closing). Projections, not guarantees.
Landlord ↔ Tenant lean methodology
- Overall (CITY)
- 12 Strongly Tenant-Friendly
- State Maryland
- 27 Tenant-Leaning · D+14
- County
- — inherits STATE
- City Baltimore
- 12 Strongly Tenant-Friendly · D+58
ZIP-level market 21205
- Home prices YoY
- -5.8%
- Rents YoY
- 9.9%
- Active inventory
- 143
- Price-to-rent
- 3.5×
Monthly cashflow live
- Estimated rent
- $1,910 high interval (Pro) →
- Mortgage (P&I)
- −$420
- Tax from tax record
- −$41 /mo · $493/yr
- Insurance
- −$33
- HOA
- −$0
- Vacancy / Maint / Mgmt
- −$401
- Net cashflow
- $1,015
Break-even live
Sensitivity live
| Price | -10% $1,060 | -5% $1,038 | +0% $1,015 | +5% $992 | +10% $970 |
|---|---|---|---|---|---|
| Rent | -10% $864 | -5% $940 | +0% $1,015 | +5% $1,091 | +10% $1,166 |
| Rate | -1.0pp $1,055 | -0.5pp $1,035 | base $1,015 | +0.5pp $994 | +1.0pp $973 |
UW: 25.0% down · 7.5% · 30yr · 1.5% tax · 5.0% vac · 8.0% maint · 8.0% mgmt
Financing live
Cash to close
- Down payment
- $20,000
- Closing costs
- $2,400
- Reserves months
- —
- Total cash needed
- —
Loan-product check · same deal, 3 products live
Conventional
25% down · 7.5% · 30yr
- Down + closing
- —
- Monthly P&I
- —
- Monthly cashflow
- —
- DSCR
- —
- Eligible?
- —
Personal DTI + credit; lowest rate.
DSCR
20% down · 8.5% · 30yr
- Down + closing
- —
- Monthly P&I
- —
- Monthly cashflow
- —
- DSCR
- —
- Eligible?
- —
No personal income docs; deal must DSCR.
Hard money
10% down · 12.0% · 12mo
- Down + closing
- —
- Monthly P&I
- —
- Monthly cashflow
- —
- DSCR
- —
- Eligible?
- —
Short-term bridge; refi at stabilization.
Rent comps 13 comps
| Address | Beds | Baths | Sqft | Rent | $/sqft | DOM | Units | Dist |
|---|---|---|---|---|---|---|---|---|
| 500 N Rose St Baltimore, MD | 3.0 | 2.0 | 520 | $1,200 | $2.31 | 5d | 1 | 0.27mi |
| 2221 E Preston St Baltimore, MD | 2.0 | 1.0 | 658 | $1,200 | $1.82 | 24d | 1 | 0.39mi |
| 2410 E Federal St Baltimore, MD | 4.0 | 2.0 | 720 | $2,200 | $3.06 | 24d | 1 | 0.63mi |
| 1607 Hakesley Pl Baltimore, MD | 3.0 | 1.0 | 720 | $1,400 | $1.94 | 44d | 1 | 0.67mi |
| 305 S Collington Ave Baltimore, MD | 3.0 | 2.5 | 722 | $2,895 | $4.01 | 18d | 1 | 0.86mi |
| 520 Somerset St Baltimore, MD | 1.0–2.0 | 1.0–2.0 | 634 | $1,578 | $2.49 | 44d | 1 | 0.90mi |
| 210 S Caroline St Baltimore, MD | 1.0–2.0 | 1.0 | 808 | $1,965 | $2.43 | 44d | 23 | 1.05mi |
| 622 S Broadway Baltimore, MD | 2.0 | 1.0–2.0 | 953 | $2,998 | $3.14 | 2d | 8 | 1.20mi |
| 1100 Greenmount Ave Baltimore, MD | 1.0–3.0 | 1.0–2.0 | 839 | $2,584 | $3.08 | 3d | 1 | 1.25mi |
| 555 President St Baltimore, MD | 3.0 | 1.0–4.0 | 1352 | $5,373 | $3.97 | 3d | 1 | 1.39mi |
| 1001 Aliceanna St Baltimore, MD | 1.0–2.0 | 1.0–2.0 | 844 | $3,081 | $3.65 | 3d | 3 | 1.42mi |
| 3905 Bank St Baltimore, MD | 4.0 | 1.0–3.0 | 909 | $2,820 | $3.10 | 3d | 20 | 1.43mi |
| 214 E Chase St Unit 2 Baltimore, MD | 2.0 | 1.0 | 600 | $1,185 | $1.98 | 44d | 1 | 1.46mi |
Listing history 27 events
-
2026-06-17remarks 699-char remark
-
2026-06-17pricedays on market $80,000 Active 1 DOM
-
2026-06-04days on market $199,900 Active 90 DOM
-
2026-06-03days on market $199,900 Active 89 DOM
-
2026-06-02days on market $199,900 Active 88 DOM
-
2026-06-01days on market $199,900 Active 87 DOM
-
2026-05-31days on market $199,900 Active 86 DOM
-
2026-05-12status Active
-
2026-05-12historical
-
2026-05-12historical
-
2026-05-08historical Active Under Contract
-
2026-04-21price $224,900
-
2026-04-16price $239,900
-
2026-03-24price $249,900
-
2026-03-13price $274,900
-
2026-02-16status Active
-
2026-01-25historical
-
2026-01-25$299,900 Active
-
2025-03-20soldstatus $75,000
-
2024-06-20soldstatus $60,000
-
2005-04-01soldstatus $46,100
-
2005-03-21soldstatus $46,100 164-char remark
Show marketing remark (164 chars)
Hopkins area, 700 block of Patterson Park. Updated electric, plumbing, new HVAC, Large curved front unit Rental at $725 with an added investment of appliances, bath
-
2005-02-25historical 164-char remark
Show marketing remark (164 chars)
Hopkins area, 700 block of Patterson Park. Updated electric, plumbing, new HVAC, Large curved front unit Rental at $725 with an added investment of appliances, bath
-
2005-02-10$46,000 164-char remark
Show marketing remark (164 chars)
Hopkins area, 700 block of Patterson Park. Updated electric, plumbing, new HVAC, Large curved front unit Rental at $725 with an added investment of appliances, bath
-
2003-10-30soldstatus $20,000
-
2003-09-11historical
-
2003-02-04$25,000
ⓘ Source: listings_history table (triggers on properties + properties_extension) + one-shot
backfill from property_details.listing_events for pre-trigger history.
Tax reassessment forecast MD · Partial reset (capped growth)
- Current annual tax
- $493 · $41/mo
- Projected year-2 tax
- $683 · $57/mo
- Expected delta
- +$189/yr (+$16/mo · 38.4%)
ⓘ Screening estimate from a state-policy table — verify with the county assessor before closing.
Climate risk First Street
- Flood 1/10 Low FEMA zone X (unshaded) · 0% chance over 30 yrs
- Wildfire 1/10 Low
- Heat 8/10 Severe 7 d/yr ≥103°F today · 15 d/yr by 30 yrs out
- Wind 6/10 Major 27% chance of damaging wind over 30 yrs
- Air quality 4/10 Moderate 6 unhealthy d/yr today · 7 by 30 yrs out
Nearby sold comps map
Loading sold comps map…
Walkable amenities ~0.75 mi
Loading nearby amenities…
Taxation est. · year 1
- Rental income
- $22,923
- − Mortgage interest
- −$4,481
- − Property taxes
- −$493
- − Insurance
- −$400
- − Repairs & maintenance
- −$1,834
- − Management
- −$1,834
- − Depreciation
- −$2,327
- Taxable income
- $11,553
- Est. tax owed @ 24.0%
- −$2,773
- After-tax cash flow
- $9,408/yr
For passive investors: Depreciation is non-cash, so a rental often shows a tax loss while cash-flowing — sheltering income. Rental losses are passive: they offset passive income freely, and up to $25,000/yr can offset ordinary (W-2) income if you actively participate and your MAGI is under $100k (phasing out to $0 by $150k); unused losses carry forward. On sale, claimed depreciation is recaptured at up to 25%, and gains may owe capital-gains tax (a 1031 exchange can defer both). Figures are a year-1 estimate at your 24.0% rate — not tax advice; consult a CPA.
Schools (NCES district)
- District
- Baltimore City Public Schools
- NCES district ID
- 2400090
- Math proficiency
- 7% ▼ -9.00%
- Reading proficiency
- 16% ▼ -5.00%
- Median HH income
- $42,108
- Composite
- 10.08/100
- National rank
- #9805
- State rank
- #24 of 24 in MD
Livability — Baltimore
- Score
- 76/100
- State rank
- #90
- US rank
- #3396
Category grades
Schools grade is shown separately in the Schools card above.
Census & demographics
- Census place
- Baltimore, MD
- County
- Baltimore City · 558,601 people
- City population
- 588,727
- Metro
- Baltimore-Columbia-Towson, MD
- Population (ZIP)
- 13,013
- Household income
- $43,176
- Rent vs Own
- Severe rent burden
- 966.0
Population outlook (Baltimore County) Hauer SSP2
- Today (2025)
- 624,249 people
- By 2030
- 621,541 · -0.4%
- By 2040
- 609,756 · -2.3%
- By 2050
- 597,249 · -4.3%
- By 2075
- 552,236 · -11.5%
- By 2100
- 513,934 · -17.7%
Race, ethnicity, and origin ACS 2023
- Neighborhood character
- Diverse neighborhood (Simpson 0.60)
- Race & ethnicity
- Black 60% Hispanic / Latino 16% White 14% Two or more races 11% Asian 3%
- Hispanic origin (detail)
- Mexican 1% Cuban 1% Dominican 4%
- Common ancestry
- Slovak 3% Romanian 1%
- Foreign-born
- 16% · Canada, China
- Languages at home
- 79% English-only · Spanish 11% Arabic 4% Chinese 1%
Political lean MEDSL · Baltimore
- 2024 margin
- Solid D (+73.0) · D 85.2% · R 12.2% · Other 2.6%
- 2008→2024 swing
- -2.5pp toward R · 2008: 75.5pp · 2024: 73.0pp
- All cycles
- 2024: D+73.0 2020: D+76.6 2016: D+74.6 2012: D+76.4 2008: D+75.5
Not yet ingested
- Civics
- —
Market trends
- HPI YoY
- ▼ -15.03%
- Current HPI
- 244.1345
- Rent YoY
- ▲ 9.88%
- Metro
- Baltimore-Columbia-Towson, MD
- State GDP YoY
- ▲ 2.97%
- F500 in state
- 12
Industry mix (Fortune 500 HQ in MD)
| Industry | F500 HQs | Revenue |
|---|---|---|
| Aerospace / Defense | 1 | $71B |
|
||
| Utilities | 1 | $25B |
|
||
| Hotels | 1 | $24B |
|
||
| Consumer Goods | 1 | $7B |
|
||
| Real Estate | 1 | $6B |
|
||
| Chemicals | 1 | $2B |
|
||
Price history
+220.0% since first listed25 events — show timeline
- 2026-06-17 Listed $80,000 BRIGHT MLS
- 2026-06-06 Price Changed $299,900 BRIGHT MLS
- 2026-06-06 Listing Removed — BRIGHT MLS
- 2026-05-26 Price Changed $199,900 BRIGHT MLS
- 2026-05-26 Relisted — BRIGHT MLS
- 2026-05-12 Relisted — BRIGHT MLS
- 2026-05-12 Listing Removed — BRIGHT MLS
- 2026-05-12 Listing Removed — BRIGHT MLS
- 2026-05-08 Contingent — BRIGHT MLS
- 2026-04-21 Price Changed $224,900 BRIGHT MLS
- 2026-04-16 Price Changed $239,900 BRIGHT MLS
- 2026-03-24 Price Changed $249,900 BRIGHT MLS
- 2026-03-13 Price Changed $274,900 BRIGHT MLS
- 2026-02-16 Relisted — BRIGHT MLS
- 2026-01-25 Listed $299,900 BRIGHT MLS
- 2026-01-25 Listing Removed — BRIGHT MLS
- 2025-03-20 Sold (Public Records) $75,000 Public Records
- 2024-06-20 Sold (Public Records) $60,000 Public Records
- 2005-04-01 Sold (Public Records) $46,100 Public Records
- 2005-03-21 Sold (MLS) $46,100 MRIS
- 2005-02-25 Delisted — MRIS
- 2005-02-10 Listed $46,000 MRIS
- 2003-10-30 Sold (MLS) $20,000 MRIS
- 2003-09-11 Delisted — MRIS
- 2003-02-04 Listed $25,000 MRIS
Property tax history
-5.8%/yrLatest (2025): $493 · +12.3% YoY. Source: county tax records.
Cash-flow waterfall
monthlySold comps — $/sqft
last 12 mo · ≤1 miLoading sold comps…