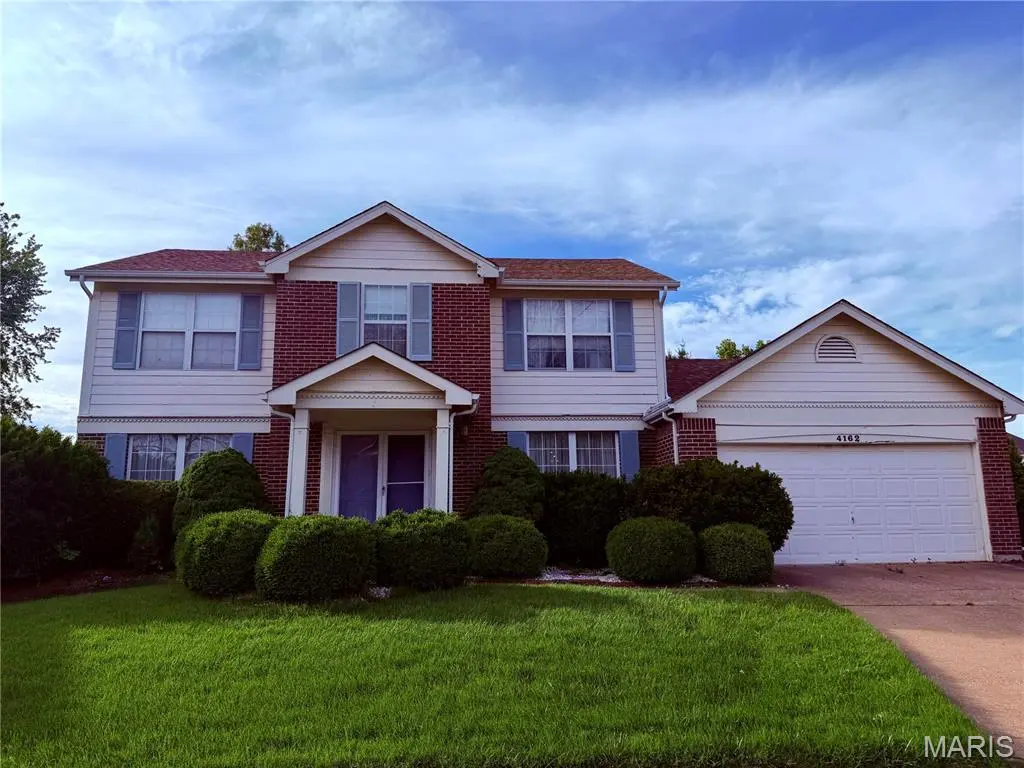
4162 Bugle Bend Dr · Old Jamestown, MO
Flood risk 1/10 · Minimal
- FEMA flood zone
- X (unshaded)
- Chance of flooding over 30 yrs
- 0.0%
- Est. flood insurance / yr
- $473 – $860
Fire risk 1/10 · Minimal
- Est. fire insurance / yr
- $1,054 – $1,958
Heat risk 5/10 · Moderate
- Hot days now (above 106°F)
- 7 days/yr
- Hot days in 30 yrs
- 21 days/yr
Wind risk 2/10 · Minimal
- Chance of severe wind over 30 yrs
- 1.0%
Air-quality risk 3/10 · Minor
- Unhealthy air days now
- 3 days/yr
- Unhealthy air days in 30 yrs
- 5 days/yr
Risk factors via First Street. Map © Google.
Why this score? — see what drove the D grade
The composite is a weighted blend of 9 inputs, each scored 0–100. Each bar is that input's sub-score; the figure is the points it added to the 100-point composite (weight × sub-score).
- Cash flow +16.0/30.0
- ARV discount +6.4/15.0
- DSCR +4.9/10.0
- 1% rule +4.2/10.0
- Livability +3.3/5.0
- Rent growth +2.5/5.0
- Condition / age +2.5/5.0
- Schools +1.7/10.0
- Appreciation +0.0/10.0
$270,000
🖨 Deal sheet (PDF) 📄 Offer letter ✓ Due diligence
Listing remarks
Nestled in a quiet cul-de-sac, this inviting 4-bedroom, 3.5-bath home offers the perfect blend of space, comfort, and privacy. Filled with natural light, the spacious interior creates a warm and welcoming atmosphere, while the cozy wood-burning fireplace serves as a beautiful focal point for gathering with family and friends. The finished basement provides valuable additional living space, ideal for a recreation room, home office, workout area, or guest accommodations. Step outside to enjoy the screened-in porch, perfect for relaxing with your morning coffee or unwinding in the evening. The huge private backyard offers endless possibilities for entertaining, gardening, play, or simply enjoy
Key facts
- 0.32 acre lot
- 2 garage spots
- Built 1986
Property features AI
Finance
- HOA & community: Part of FOX LAKE association; Association provides management and common ground; Annual association fee of $175 (covers common area maintenance)
Exterior
- Parking: Attached garage with 2 spaces
- Utilities: Public water; Public sewer; Electric service by Ameren; Cable available
- Home design: Single-family residence; Two levels; Residential property
- Construction: Wood siding; Architectural shingle roof
- Exterior features: Private yard; Back yard; Located on a cul-de-sac; Few trees; Level lot
Interior
- Kitchen: Electric range; Refrigerator; Freezer
- Bedrooms: Four bedrooms (all on the upper level)
- Flooring: Hardwood flooring; Other flooring
- Bathrooms: Three full bathrooms and one half bathroom; Upper level contains two full baths; Lower level contains one full bath; Main level contains one half bath
- Heating & cooling: Forced air heating; Central air conditioning; Ceiling fans
- Interior features: Finished basement with storage; Fireplace in family room (masonry, raised hearth, wood burning)
- Laundry & utility: Washer and dryer; Main level laundry
Neighborhood map
What this means for you Summary
Snapshot
- This is a 4-bed/2.5-bath single-family listed at $270k.
Deal economics
- At list price, monthly cash flow is $131 ($2k/yr) — positive.
- The deal already cash-flows at list — no discount required.
- To meet the 1% rule (rent ≥ 1% of price), the offer needs to be $249k (7.7% below list).
- Recommended offer: $249k (7.7% below list) — sets the bar for 1% rule.
- Cap rate 6.9% vs local median 5.2% in Old Jamestown — top-decile yield for the area; either an underpriced asset or a hidden risk that comps aren't pricing in. Stress-test before assuming the spread holds.
Location & tenants
- Location reads 66/100 on livability (#247 in MO) — a middle-class / working-renter tenant base. Strengths: employment A+, housing A+, cost of living A; Watch: amenities F, commute F, health & safety F.
- Hazelwood (suburban): math 11% / reading 26% proficiency, ranked #306 of 324 in MO (top 94%) — low school quality limits family demand, transient renter base, plan for 1-2y turnover.
- Zoned schools: Barrington Elem. (math 9% / reading 28%, grade F, #960 of 1,115 statewide, top 86%, 393 students, 53% FRL); North Middle (math 16% / reading 28%, grade F, #332 of 391 statewide, top 86%, 674 students, 55% FRL); Hazelwood Central High (math 12% / reading 33%, grade F, #455 of 521 statewide, top 88%, 1,628 students, 52% FRL) — zoned schools at 53% FRL track the district average.
- Market conditions: 72 active listings in the ZIP; 4 comparable units currently listed for rent nearby; rentals leasing fast (median 6d on market — plan ~1-2 weeks tenant-placement turnaround); solid renter incomes; 920 units permitted in St. Louis County in 2024 (250 in 5+ unit buildings).
Forward outlook
- Local home prices are declining (-3.0%/yr); year-one equity from $2k of loan paydown is wiped out by about $8k of value loss. Plan a longer hold.
Negotiation context
- Only 9 days on market — expect competitive offers; lowballing is unlikely to land.
Risks & watch-outs
- Climate carrying-cost: extreme-heat days projected 7→21/yr by 2055 (HVAC capex compounding) — expect insurance premiums to compound above CPI over the hold.
Questions for the listing agent
- What does the HOA fee cover, when was the last increase, and are there any pending special assessments or reserve-fund shortfalls?
- Is there a deadline driving the sale (1031 exchange, divorce, estate, relocation)? That informs how much negotiation room exists.
- The area grade is low — what's the realistic commute time and amenity access for the typical tenant pool here? Any planned neighborhood developments (good or bad) we should know about?
- What's the average days-on-market for RENTAL listings here right now (not sales)? A rising rental-DOM trend means longer vacancies and softer asking-rent achievability than the comps imply.
- What's the recent tenant-quality profile in this submarket — average credit score on applications, eviction rate, late-payment / NSF rate, and stable-employment percentage? A property-management company in the area should have these aggregated.
- How much new for-sale + rental construction is in the pipeline within 1–3 miles? Heavy new supply typically softens prices + rents 12–24 months out; constrained supply supports both.
Investment metrics
- 1% rule
- 0.92% ✗
- Cap rate
- 6.88%
- Cash-on-cash
- 2.08%
- DSCR
- 1.09
- GRM
- 9.0
CMA / ARV
- ARV (on-the-fly)
- $263,376
- Comps found
- 12
Show comp detail 12 sales within ~0.75 mi
| Address | Dist | Beds/Ba | Sqft | Sold | Price | $/sf | Match |
|---|---|---|---|---|---|---|---|
| 4086 Waterfall Dr | 0.35mi | 4/2.5 | 2,193 (+3%) | 3mo | $300,000 | $137 | 76 |
| 3820 Grand National Dr | 0.33mi | 4/2.5 | 2,266 (+7%) | 2mo | $270,000 | $119 | 72 |
| 1025 Exacta Ct | 0.38mi | 4/3.0 | 2,026 (-5%) | 5mo | $220,000 | $109 | 68 |
| 4214 Goodness Ct | 0.33mi | 4/2.5 | 2,252 (+6%) | 9mo | $327,500 | $145 | 67 |
| 1025 Patience Dr | 0.53mi | 4/3.0 | 2,046 (-4%) | 6mo | $225,000 | $110 | 62 |
| 4187 Vaile Ave | 0.46mi | 4/2.5 | 2,336 (+10%) | 5mo | $349,900 | $150 | 58 |
| 15684 Birkemeier Dr | 0.44mi | 5/3.0 (+1) | 2,325 (+10%) | 5mo | $275,000 | $118 | 52 |
| 16328 Hampden Pl | 0.57mi | 3/2.0 (-1) | 2,368 (+12%) | 2mo | $239,900 | $101 | 45 |
| 3847 Trinity Cir | 0.65mi | 4/2.0 | 2,340 (+10%) | 9mo | $289,900 | $124 | 43 |
| 644 Shadow Rock Dr | 0.74mi | 4/2.5 | 1,874 (-12%) | 6mo | $165,000 | $88 | 41 |
| 973 Brookfield Chase Ct | 0.59mi | 5/3.0 (+1) | 2,405 (+13%) | 3mo | $420,000 | $175 | 41 |
| 14736 Verdun Estates Dr | 0.66mi | 3/2.0 (-1) | 1,848 (-13%) | 7mo | $270,000 | $146 | 35 |
Match score weights: distance 35% · size 25% · config 20% · recency 20%. Top-matched comps best support the ARV.
Projected returns pro-forma
-3.0% appreciation · 3.0% rent growth · sell at horizon
- IRR
- -13.0%
- Equity multiple
- 0.53×
- Total profit
- $-35,386
- Equity at exit
- $40,258
- IRR
- -4.0%
- Equity multiple
- 0.74×
- Total profit
- $-19,987
- Equity at exit
- $23,345
Cash invested: $75,600 (down + closing). Projections, not guarantees.
Landlord ↔ Tenant lean methodology
- Overall (STATE)
- 81 Strongly Landlord-Friendly
- State Missouri
- 81 Strongly Landlord-Friendly · R+10
- County
- — inherits STATE
- City
- — inherits STATE
ZIP-level market 63034
- Active inventory
- 72
- Price-to-rent
- 9.0×
Monthly cashflow live
- Estimated rent
- $2,492 medium interval (Pro) →
- Mortgage (P&I)
- −$1,416
- Tax from tax record
- −$294 /mo · $3,527/yr
- Insurance
- −$112
- HOA
- −$15
- Vacancy / Maint / Mgmt
- −$523
- Net cashflow
- $131
Break-even live
Sensitivity live
| Price | -10% $284 | -5% $207 | +0% $131 | +5% $55 | +10% $-22 |
|---|---|---|---|---|---|
| Rent | -10% $-66 | -5% $33 | +0% $131 | +5% $229 | +10% $328 |
| Rate | -1.0pp $267 | -0.5pp $200 | base $131 | +0.5pp $61 | +1.0pp $-10 |
UW: 25.0% down · 7.5% · 30yr · 1.5% tax · 5.0% vac · 8.0% maint · 8.0% mgmt
Financing live
Cash to close
- Down payment
- $67,500
- Closing costs
- $8,100
- Reserves months
- —
- Total cash needed
- —
Loan-product check · same deal, 3 products live
Conventional
25% down · 7.5% · 30yr
- Down + closing
- —
- Monthly P&I
- —
- Monthly cashflow
- —
- DSCR
- —
- Eligible?
- —
Personal DTI + credit; lowest rate.
DSCR
20% down · 8.5% · 30yr
- Down + closing
- —
- Monthly P&I
- —
- Monthly cashflow
- —
- DSCR
- —
- Eligible?
- —
No personal income docs; deal must DSCR.
Hard money
10% down · 12.0% · 12mo
- Down + closing
- —
- Monthly P&I
- —
- Monthly cashflow
- —
- DSCR
- —
- Eligible?
- —
Short-term bridge; refi at stabilization.
Rent comps 4 comps
| Address | Beds | Baths | Sqft | Rent | $/sqft | DOM | Units | Dist |
|---|---|---|---|---|---|---|---|---|
| 1203 Advance Dr Florissant, MO | 3.0 | 3.0 | 2260 | $2,050 | $0.91 | 6d | 1 | 1.17mi |
| 3710 Woodman Dr Florissant, MO | 4.0 | 1.5 | 1802 | $2,046 | $1.14 | 0d | 1 | 1.18mi |
| 13 Cricket Ct Florissant, MO | 4.0 | 3.0 | 1560 | $2,550 | $1.63 | 45d | 1 | 1.35mi |
| 3145 Matlock Dr Florissant, MO | 4.0 | 2.0 | 1796 | $2,200 | $1.22 | 0d | 1 | 1.43mi |
HOA detail
- Monthly dues
- $15 · $180/yr
Listing history 15 events
-
2026-06-21days on market $270,000 Active 9 DOM
-
2026-06-18days on market $270,000 Active 6 DOM
-
2026-06-17days on market $270,000 Active 5 DOM
-
2026-06-16days on market $270,000 Active 4 DOM
-
2026-06-15days on market $270,000 Active 3 DOM
-
2026-06-13statusdays on market $270,000 Active 1 DOM
-
2026-06-09days on market $270,000 Coming Soon 10 DOM
-
2026-06-08days on market $270,000 Coming Soon 9 DOM
-
2026-06-07days on market $270,000 Coming Soon 8 DOM
-
2026-06-05days on market $270,000 Coming Soon 5 DOM
-
2026-06-03days on market $270,000 Coming Soon 4 DOM
-
2026-06-02days on market $270,000 Coming Soon 3 DOM
-
2026-06-01days on market $270,000 Coming Soon 2 DOM
-
2026-05-31remarks 699-char remark
-
2026-05-31$270,000 Coming Soon 1 DOM
ⓘ Source: listings_history table (triggers on properties + properties_extension) + one-shot
backfill from property_details.listing_events for pre-trigger history.
Tax reassessment forecast MO · Resets to sale price
- Current annual tax
- $3,527 · $294/mo
- Projected year-2 tax
- $3,527 · $294/mo
- Expected delta
- $0/yr ($0/mo · 0.0%)
ⓘ Screening estimate from a state-policy table — verify with the county assessor before closing.
Climate risk First Street
- Flood 1/10 Low FEMA zone X (unshaded) · 0% chance over 30 yrs
- Wildfire 1/10 Low
- Heat 5/10 Major 7 d/yr ≥106°F today · 21 d/yr by 30 yrs out
- Wind 2/10 Low 100% chance of damaging wind over 30 yrs
- Air quality 3/10 Moderate 3 unhealthy d/yr today · 5 by 30 yrs out
Nearby sold comps map
Loading sold comps map…
Walkable amenities ~0.75 mi
Loading nearby amenities…
Taxation est. · year 1
- Rental income
- $29,899
- − Mortgage interest
- −$15,124
- − Property taxes
- −$3,527
- − Insurance
- −$1,350
- − Repairs & maintenance
- −$2,392
- − Management
- −$2,392
- − HOA
- −$180
- − Depreciation
- −$7,855
- Taxable loss
- −$2,921
- Est. tax savings @ 24.0%
- +$701
- After-tax cash flow
- $2,273/yr
For passive investors: Depreciation is non-cash, so a rental often shows a tax loss while cash-flowing — sheltering income. Rental losses are passive: they offset passive income freely, and up to $25,000/yr can offset ordinary (W-2) income if you actively participate and your MAGI is under $100k (phasing out to $0 by $150k); unused losses carry forward. On sale, claimed depreciation is recaptured at up to 25%, and gains may owe capital-gains tax (a 1031 exchange can defer both). Figures are a year-1 estimate at your 24.0% rate — not tax advice; consult a CPA.
Schools (NCES district)
- District
- Hazelwood
- NCES district ID
- 2913830
- Math proficiency
- 11% ▼ -13.00%
- Reading proficiency
- 26% ▼ -6.00%
- Median HH income
- $51,621
- Composite
- 16.77/100
- National rank
- #9156
- State rank
- #306 of 324 in MO
Livability — Old Jamestown
- Score
- 66/100
- State rank
- #247
- US rank
- #12156
Category grades
Schools grade is shown separately in the Schools card above.
Census & demographics
- Census place
- Old Jamestown, MO
- County
- Saint Louis County · 888,823 people
- City population
- 19,557
- Metro
- St. Louis, MO-IL
- Population (ZIP)
- 18,908
- Household income
- $103,905
- Rent vs Own
- Severe rent burden
- 88.0
Population outlook (St. Louis County) Hauer SSP2
- Today (2025)
- 1,025,227 people
- By 2030
- 1,028,023 · +0.3%
- By 2040
- 1,020,940 · -0.4%
- By 2050
- 1,007,280 · -1.8%
- By 2075
- 987,277 · -3.7%
- By 2100
- 921,984 · -10.1%
Race, ethnicity, and origin ACS 2023
- Neighborhood character
- Predominantly Black (65%)
- Race & ethnicity
- Black 65% White 21% Two or more races 11% Hispanic / Latino 4% Asian 1%
- Common ancestry
- Swedish 1% Italian 1% Romanian 1%
- Foreign-born
- 5% · Canada, Vietnam
- Languages at home
- 95% English-only · Spanish 1% Vietnamese 1% Other Indo-European 1%
Political lean MEDSL · St. Louis
- 2024 margin
- Strong D (+23.4) · D 60.8% · R 37.4% · Other 1.7%
- 2008→2024 swing
- +3.5pp toward D · 2008: 19.9pp · 2024: 23.4pp
- All cycles
- 2024: D+23.4 2020: D+24.0 2016: D+16.2 2012: D+13.7 2008: D+19.9
Not yet ingested
- Civics
- —
Market trends
- HPI YoY
- ▼ -156.28%
- Current HPI
- 180.6267
- Rent YoY
- —
- Metro
- St. Louis, MO-IL
- State GDP YoY
- ▲ 1.84%
- F500 in state
- 20
Industry mix (Fortune 500 HQ in MO)
| Industry | F500 HQs | Revenue |
|---|---|---|
| Healthcare | 1 | $163B |
|
||
| Insurance | 1 | $21B |
|
||
| Industrial Technology | 1 | $17B |
|
||
| Retail | 1 | $16B |
|
||
| Industrial Distribution | 1 | $10B |
|
||
| Utilities | 1 | $9B |
|
||
Price history
2 events — show timeline
- 2026-05-30 Coming Soon $270,000 MARIS as Distributed by MLS Grid
- 1986-08-01 Sold (Public Records) — Public Records
Property tax history
+3.2%/yrLatest (2022): $3,527 · +5.7% YoY. Source: county tax records.
Cash-flow waterfall
monthlySold comps — $/sqft
last 12 mo · ≤1 miLoading sold comps…