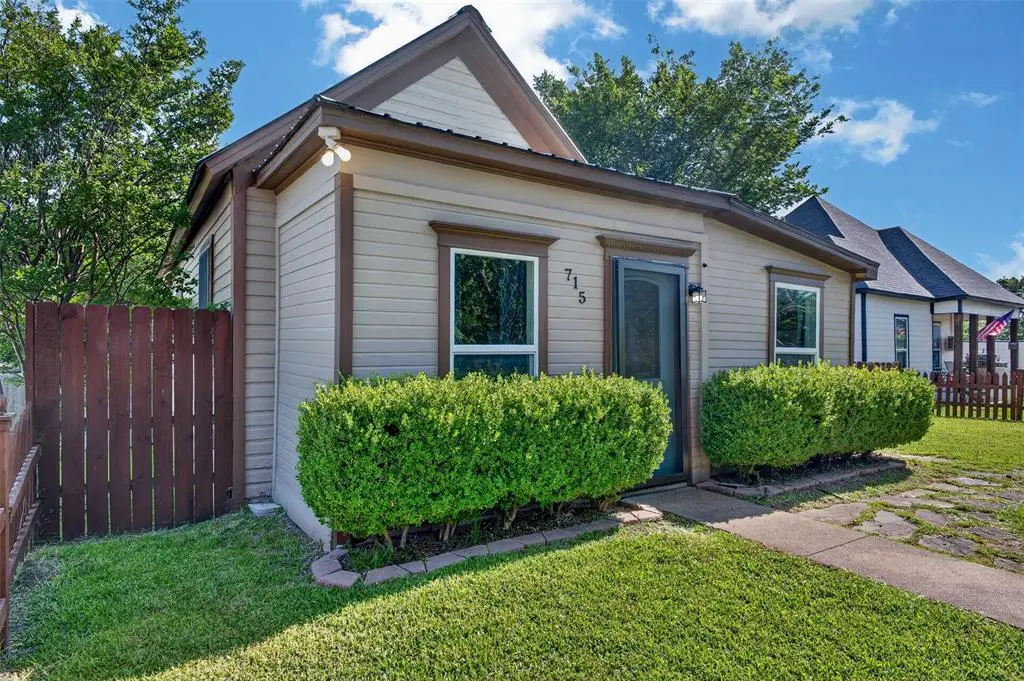
715 W Munson St · Denison, TX
Flood risk 1/10 · Minimal
- FEMA flood zone
- X (unshaded)
- Chance of flooding over 30 yrs
- 0.0%
- Est. flood insurance / yr
- $507 – $1,088
Fire risk 5/10 · Moderate
- Est. fire insurance / yr
- $1,222 – $2,270
Heat risk 6/10 · Moderate
- Hot days now (above 109°F)
- 7 days/yr
- Hot days in 30 yrs
- 21 days/yr
Wind risk 4/10 · Minor
- Chance of severe wind over 30 yrs
- 22.0%
Air-quality risk 2/10 · Minimal
- Unhealthy air days now
- 2 days/yr
- Unhealthy air days in 30 yrs
- 2 days/yr
Risk factors via First Street. Map © Google.
Why this score? — see what drove the C- grade
The composite is a weighted blend of 9 inputs, each scored 0–100. Each bar is that input's sub-score; the figure is the points it added to the 100-point composite (weight × sub-score).
- Cash flow +20.2/30.0
- ARV discount +7.3/15.0
- DSCR +6.4/10.0
- 1% rule +5.1/10.0
- Schools +3.7/10.0
- Livability +3.7/5.0
- Rent growth +2.5/5.0
- Condition / age +2.5/5.0
- Appreciation +0.0/10.0
$150,000
🖨 Deal sheet (PDF) 📄 Offer letter ✓ Due diligence
Listing remarks MLS
Cute house with lots of charm. Under renovation with new paint, texture, flooring, barn doors and a Loft was added that over looks the living room. Vaulted and beamed ceiling in the living room. Large walk in tiled shower. Gas Fireplace. Nice sized fenced in side yard. Large insulated separate building with washer and dryer hookup. It makes a cute she shed or nice man cave. Plenty of parking in the back off of the alley. The house is still under renovations. It will all be complete by closing. Ask me about financing.
Key facts
- Storage building
- Fence installed
- Sturdy metal roof
Tags
Property features AI
Finance
- Other: No special taxing entities; No known restrictions
- Financial info: Listing is for sale; Exclusive right to sell listing agreement; No second mortgage reported
- HOA & community: No homeowners association
Exterior
- Parking: On-street parking
- Security: Smoke detectors
- Utilities: City water; City sewer; Electricity connected; Cable available; All-weather road; Curbs
- Home design: Single-family residence; Residential property; One story; Not attached to another property; Built in 1920; No reported accessibility features
- Construction: Metal roof; Siding exterior; Pillar/post/pier foundation; Preowned
- Exterior features: Storage; Chain link and wood fencing; Fenced yard; Utilities easement
Interior
- Kitchen: Dishwasher; Disposal; Electric cooktop; Electric oven; Refrigerator; Pantry (kitchen storage)
- Bedrooms: 3 bedrooms (all on the main level)
- Flooring: Carpet; Laminate
- Bathrooms: 2 full bathrooms
- Heating & cooling: Central heating (natural gas); Central air conditioning; Ceiling fans; Electric cooling components
- Interior features: High-speed internet available; Pantry; Decorative fireplace; One living area; One dining area; Total room count: 4; One level
- Laundry & utility: Electric water heater
Neighborhood map
What this means for you Summary
Snapshot
- This is a 3-bed/2.0-bath single-family listed at $150k.
Deal economics
- At list price, monthly cash flow is $189 ($2k/yr) — positive.
- The deal already cash-flows at list — no discount required.
- Meets the 1% rule at list price ($2k rent vs $150k).
- Cap rate 7.8% vs local median 3.8% in Denison — top-decile yield for the area; either an underpriced asset or a hidden risk that comps aren't pricing in. Stress-test before assuming the spread holds.
Location & tenants
- Location reads 73/100 on livability (#221 in TX) — a middle-class / working-renter tenant base. Strengths: cost of living A+, housing A+, crime A; Watch: health & safety D+, amenities F, commute F.
- Denison ISD (urban): math 43% / reading 44% proficiency, ranked #315 of 826 in TX (top 38%) — families likely to look elsewhere, expect single-tenant / working-renter base with shorter leases.
- Zoned schools: Houston El (math 47% / reading 42%, grade F, #1,155 of 4,322 statewide, top 29%, 286 students, 74% FRL) — zoned schools average 74% FRL vs 54% district-wide (20 pts higher); higher-poverty schools than district average — tighter screening recommended.
- Market conditions: Rents flat; 485 active listings in the ZIP; 40 comparable units currently listed for rent nearby; rentals lingering (median 45d on market — plan ~5-8 weeks vacancy on turnover, expect pricing pressure); 55% of comp listings sitting > 30 days — soft ceiling on asking rent; 2,272 units permitted in Grayson County in 2024 (750 in 5+ unit buildings).
Forward outlook
- Local home prices are declining (-3.0%/yr); year-one equity from $1k of loan paydown is wiped out by about $4k of value loss. Plan a longer hold.
- Grayson County population projected at +12% by 2050 — modest demand growth; plan on rents tracking national, not racing it.
Negotiation context
- Only 14 days on market — expect competitive offers; lowballing is unlikely to land.
- 3 sale attempts since 6y ago; this cycle's ask is 3% above the opening price — seller raised mid-cycle; expect resistance to lowballs.
Risks & watch-outs
- Watch-outs: built in 1920 — expect roof / HVAC / electrical / plumbing capex.
- Climate carrying-cost: moderate wildfire risk; extreme-heat days projected 7→21/yr by 2055 (HVAC capex compounding) — expect insurance premiums to compound above CPI over the hold.
Questions for the listing agent
- Built in 1920 — when were the roof, HVAC, electrical panel, plumbing, and water heater last replaced?
- Is there a deadline driving the sale (1031 exchange, divorce, estate, relocation)? That informs how much negotiation room exists.
- Schools are D-rated, which usually means shorter tenancies and higher turnover. Who's the typical renter profile here, and what's been the actual vacancy rate?
- What's the average days-on-market for RENTAL listings here right now (not sales)? A rising rental-DOM trend means longer vacancies and softer asking-rent achievability than the comps imply.
- What's the recent tenant-quality profile in this submarket — average credit score on applications, eviction rate, late-payment / NSF rate, and stable-employment percentage? A property-management company in the area should have these aggregated.
- How much new for-sale + rental construction is in the pipeline within 1–3 miles? Heavy new supply typically softens prices + rents 12–24 months out; constrained supply supports both.
Investment metrics
- 1% rule
- 1.01% ✓
- Cap rate
- 7.81%
- Cash-on-cash
- 5.40%
- DSCR
- 1.24
- GRM
- 8.3
CMA / ARV
- ARV (on-the-fly)
- $149,226
- Comps found
- 12
Show comp detail 12 sales within ~0.75 mi
| Address | Dist | Beds/Ba | Sqft | Sold | Price | $/sf | Match |
|---|---|---|---|---|---|---|---|
| 913 W Day St | 0.18mi | 3/2.0 | 1,231 (-2%) | 0mo | $149,000 | $121 | 88 |
| 925 W Nelson St | 0.30mi | 3/2.0 | 1,168 (-7%) | 1mo | $87,500 | $75 | 74 |
| 1107 W Hull St | 0.35mi | 2/1.0 (-1) | 1,280 (+2%) | 0mo | $135,000 | $105 | 71 |
| 1029 W Hull St | 0.30mi | 3/2.0 | 1,375 (+10%) | 1mo | $230,000 | $167 | 69 |
| 326 W Day St | 0.33mi | 3/2.0 | 1,406 (+12%) | 0mo | $265,000 | $188 | 64 |
| 1130 W Heron St | 0.51mi | 3/1.0 | 1,179 (-6%) | 2mo | $207,000 | $176 | 61 |
| 1213 W Morgan St | 0.53mi | 3/1.0 | 1,336 (+6%) | 1mo | $99,000 | $74 | 59 |
| 811 W Woodard St | 0.64mi | 2/2.0 (-1) | 1,202 (-4%) | 0mo | $199,000 | $166 | 58 |
| 110 E Munson St | 0.61mi | 2/1.0 (-1) | 1,197 (-4%) | 1mo | $129,900 | $109 | 54 |
| 621 W Brock St | 0.64mi | 3/1.0 | 1,350 (+8%) | 1mo | $160,000 | $119 | 52 |
| 614 W Owings St | 0.35mi | 2/1.0 (-1) | 1,422 (+13%) | 2mo | $90,000 | $63 | 51 |
| 111 W Murray St | 0.65mi | 2/1.0 (-1) | 1,176 (-6%) | 4mo | $72,500 | $62 | 48 |
Match score weights: distance 35% · size 25% · config 20% · recency 20%. Top-matched comps best support the ARV.
Projected returns pro-forma
-3.0% appreciation · 0.05% rent growth · sell at horizon
- IRR
- -11.2%
- Equity multiple
- 0.60×
- Total profit
- $-16,621
- Equity at exit
- $22,365
- IRR
- -6.8%
- Equity multiple
- 0.62×
- Total profit
- $-15,815
- Equity at exit
- $12,969
Cash invested: $42,000 (down + closing). Projections, not guarantees.
Landlord ↔ Tenant lean methodology
- Overall (STATE)
- 87 Strongly Landlord-Friendly
- State Texas
- 87 Strongly Landlord-Friendly · R+5
- County
- — inherits STATE
- City
- — inherits STATE
ZIP-level market 75020
- Rents YoY
- 0.1%
- Active inventory
- 485
- Price-to-rent
- 8.3×
Monthly cashflow live
- Estimated rent
- $1,511 high interval (Pro) →
- Mortgage (P&I)
- −$787
- Tax from tax record
- −$156 /mo · $1,871/yr
- Insurance
- −$62
- HOA
- −$0
- Vacancy / Maint / Mgmt
- −$317
- Net cashflow
- $189
Break-even live
Sensitivity live
| Price | -10% $274 | -5% $231 | +0% $189 | +5% $147 | +10% $104 |
|---|---|---|---|---|---|
| Rent | -10% $70 | -5% $129 | +0% $189 | +5% $249 | +10% $308 |
| Rate | -1.0pp $265 | -0.5pp $227 | base $189 | +0.5pp $150 | +1.0pp $111 |
UW: 25.0% down · 7.5% · 30yr · 1.5% tax · 5.0% vac · 8.0% maint · 8.0% mgmt
Financing live
Cash to close
- Down payment
- $37,500
- Closing costs
- $4,500
- Reserves months
- —
- Total cash needed
- —
Loan-product check · same deal, 3 products live
Conventional
25% down · 7.5% · 30yr
- Down + closing
- —
- Monthly P&I
- —
- Monthly cashflow
- —
- DSCR
- —
- Eligible?
- —
Personal DTI + credit; lowest rate.
DSCR
20% down · 8.5% · 30yr
- Down + closing
- —
- Monthly P&I
- —
- Monthly cashflow
- —
- DSCR
- —
- Eligible?
- —
No personal income docs; deal must DSCR.
Hard money
10% down · 12.0% · 12mo
- Down + closing
- —
- Monthly P&I
- —
- Monthly cashflow
- —
- DSCR
- —
- Eligible?
- —
Short-term bridge; refi at stabilization.
Rent comps 40 comps
| Address | Beds | Baths | Sqft | Rent | $/sqft | DOM | Units | Dist |
|---|---|---|---|---|---|---|---|---|
| 1011 S Armstrong Ave Unit A Denison, TX | 2.0 | 1.0 | 1400 | $1,500 | $1.07 | 45d | 1 | 0.16mi |
| 921 W Day St Denison, TX | 3.0 | 2.0 | 1212 | $1,500 | $1.24 | 45d | 1 | 0.19mi |
| 1022 W Shepherd St #1022 Denison, TX | 3.0 | 2.5 | 1322 | $1,450 | $1.10 | 22d | 1 | 0.28mi |
| 412 W Day St Denison, TX | 2.0 | 1.0 | 900 | $1,200 | $1.33 | 22d | 1 | 0.29mi |
| 404 W Day St Denison, TX | 3.0 | 2.0 | 1057 | $1,500 | $1.42 | 22d | 1 | 0.31mi |
| 410 S Mirick Ave Denison, TX | 3.0 | 2.0 | 1100 | $1,300 | $1.18 | 45d | 1 | 0.33mi |
| 610 W Owing St Denison, TX | 3.0 | 2.0 | 1108 | $1,395 | $1.26 | 45d | 1 | 0.34mi |
| 411 S Fannin Ave #411 Denison, TX | 3.0 | 2.5 | 1322 | $1,450 | $1.10 | 22d | 1 | 0.37mi |
| 626 W Crawford St Unit 101 Denison, TX | 2.0 | 2.0 | 950 | $950 | $1.00 | 22d | 1 | 0.39mi |
| 820 W Crawford St Denison, TX | 2.0 | 1.0 | 996 | $1,250 | $1.26 | 22d | 1 | 0.39mi |
| 1011 S Perry Ave Denison, TX | 2.0 | 2.0 | 1079 | $1,350 | $1.25 | 45d | 1 | 0.43mi |
| 626 W Chestnut St Denison, TX | 2.0 | 1.0 | 1132 | $1,300 | $1.15 | 22d | 1 | 0.45mi |
| 900 W Chestnut St Denison, TX | 3.0 | 2.0 | 1742 | $1,695 | $0.97 | 45d | 1 | 0.46mi |
| 1120 W Owing St Denison, TX | 3.0 | 2.0 | 1090 | $1,225 | $1.12 | 22d | 1 | 0.48mi |
| 715 W Chestnut St Denison, TX | 2.0 | 2.0 | 1273 | $1,300 | $1.02 | 45d | 1 | 0.48mi |
| 1131 W Owing St Denison, TX | 3.0 | 2.0 | 1135 | $1,695 | $1.49 | 45d | 1 | 0.51mi |
| 1311 W Day St Denison, TX | 2.0 | 1.0 | 1188 | $1,050 | $0.88 | 22d | 1 | 0.51mi |
| 740 W Bullock St Denison, TX | 2.0 | 1.0 | 1000 | $1,250 | $1.25 | 22d | 1 | 0.63mi |
| 114 E Hull St Denison, TX | 2.0 | 2.0 | 1279 | $1,450 | $1.13 | 45d | 1 | 0.65mi |
| 725 W Brock St Denison, TX | 3.0 | 1.5 | 1349 | $1,450 | $1.07 | 22d | 1 | 0.66mi |
| 1012 S Maurice Ave Denison, TX | 3.0 | 2.0 | 1600 | $1,895 | $1.18 | 45d | 1 | 0.66mi |
| 1527 S Austin Ave Denison, TX | 1.0–2.0 | 1.0–1.5 | 850 | $999 | $1.18 | 22d | 2 | 0.66mi |
| 1004 W Gandy St Denison, TX | 3.0 | 1.0 | 1250 | $1,299 | $1.04 | 22d | 1 | 0.69mi |
| 1225 W Hanna St Denison, TX | 3.0 | 1.5 | 1500 | $1,600 | $1.07 | 45d | 1 | 0.70mi |
| 1016 W Gandy St #4 Denison, TX | 2.0 | 1.5 | 1000 | $1,100 | $1.10 | 45d | 1 | 0.70mi |
| 1231 W Main St Denison, TX | 2.0 | 1.5 | 1203 | $1,575 | $1.31 | 22d | 1 | 0.71mi |
| 108 W Acheson St Denison, TX | 3.0 | 2.0 | 1056 | $1,550 | $1.47 | 45d | 1 | 0.74mi |
| 313 E Nelson St Denison, TX | 3.0 | 2.0 | 1279 | $1,625 | $1.27 | 22d | 1 | 0.83mi |
| 731 W Morton St Denison, TX | 3.0 | 2.0 | 1298 | $1,500 | $1.16 | 45d | 1 | 0.83mi |
| 809 S Travis Ave Denison, TX | 3.0 | 2.0 | 1490 | $1,595 | $1.07 | 45d | 1 | 0.85mi |
| 214 E Acheson St Denison, TX | 2.0 | 1.0 | 963 | $1,499 | $1.56 | 45d | 1 | 0.86mi |
| 327-329 E Nelson St #329 Denison, TX | 3.0 | 2.0 | 1382 | $1,625 | $1.18 | 45d | 1 | 0.88mi |
| 731 W Bond St Denison, TX | 3.0 | 2.0 | 1297 | $1,595 | $1.23 | 22d | 1 | 0.91mi |
| 1326 W Sears St Denison, TX | 2.0 | 1.0 | 1318 | $1,350 | $1.02 | 22d | 1 | 0.91mi |
| 514 N Rusk Ave Unit 516 Denison, TX | 3.0 | 2.0 | 1173 | $1,375 | $1.17 | 22d | 1 | 0.93mi |
| 320 W Bond St Denison, TX | 3.0 | 2.0 | 1278 | $1,500 | $1.17 | 45d | 1 | 0.94mi |
| 514 N Rusk Ave Denison, TX | 3.0 | 2.0 | 1173 | $1,450 | $1.24 | 45d | 1 | 0.97mi |
| 226 W Bond St Unit 224 Denison, TX | 3.0 | 2.5 | 1294 | $1,375 | $1.06 | 45d | 1 | 0.97mi |
| 224 W Bond St Denison, TX | 3.0 | 2.5 | 1294 | $1,375 | $1.06 | 45d | 1 | 0.98mi |
| 1921 Ave a Denison, TX | 4.0 | 3.0 | 1700 | $1,995 | $1.17 | 45d | 1 | 0.98mi |
Listing history 12 events
-
2026-06-19days on market $150,000 Active 14 DOM
-
2026-06-18days on market $150,000 Active 13 DOM
-
2026-06-17days on market $150,000 Active 12 DOM
-
2026-06-16days on market $150,000 Active 11 DOM
-
2026-06-15days on market $150,000 Active 10 DOM
-
2026-06-14days on market $150,000 Active 8 DOM
-
2026-06-13days on market $150,000 Active 7 DOM
-
2026-06-10days on market $150,000 Active 5 DOM
-
2026-06-09days on market $150,000 Active 4 DOM
-
2026-06-08days on market $150,000 Active 3 DOM
-
2026-06-07remarks 453-char remark
-
2026-06-07$150,000 Active 2 DOM
ⓘ Source: listings_history table (triggers on properties + properties_extension) + one-shot
backfill from property_details.listing_events for pre-trigger history.
Tax reassessment forecast TX · Resets to sale price
- Current annual tax
- $1,871 · $156/mo
- Projected year-2 tax
- $2,745 · $229/mo
- Expected delta
- +$874/yr (+$73/mo · 46.7%)
ⓘ Screening estimate from a state-policy table — verify with the county assessor before closing.
Climate risk First Street
- Flood 1/10 Low FEMA zone X (unshaded) · 0% chance over 30 yrs
- Wildfire 5/10 Major
- Heat 6/10 Major 7 d/yr ≥109°F today · 21 d/yr by 30 yrs out
- Wind 4/10 Moderate 22% chance of damaging wind over 30 yrs
- Air quality 2/10 Low 2 unhealthy d/yr today · 2 by 30 yrs out
Nearby sold comps map
Loading sold comps map…
Walkable amenities ~0.75 mi
Loading nearby amenities…
Taxation est. · year 1
- Rental income
- $18,137
- − Mortgage interest
- −$8,402
- − Property taxes
- −$1,871
- − Insurance
- −$750
- − Repairs & maintenance
- −$1,451
- − Management
- −$1,451
- − Depreciation
- −$4,364
- Taxable loss
- −$151
- Est. tax savings @ 24.0%
- +$36
- After-tax cash flow
- $2,305/yr
For passive investors: Depreciation is non-cash, so a rental often shows a tax loss while cash-flowing — sheltering income. Rental losses are passive: they offset passive income freely, and up to $25,000/yr can offset ordinary (W-2) income if you actively participate and your MAGI is under $100k (phasing out to $0 by $150k); unused losses carry forward. On sale, claimed depreciation is recaptured at up to 25%, and gains may owe capital-gains tax (a 1031 exchange can defer both). Figures are a year-1 estimate at your 24.0% rate — not tax advice; consult a CPA.
Schools (NCES district)
- District
- Denison ISD
- NCES district ID
- 4816710
- Math proficiency
- 43% ▼ -7.00%
- Reading proficiency
- 44% ▼ -3.00%
- Median HH income
- $41,650
- Composite
- 36.6/100
- National rank
- #4629
- State rank
- #315 of 826 in TX
Livability — Denison
- Score
- 73/100
- State rank
- #221
- US rank
- #5428
Category grades
Schools grade is shown separately in the Schools card above.
Census & demographics
- Census place
- Denison, TX
- County
- Grayson County · 108,053 people
- City population
- 34,008
- Metro
- Sherman-Denison, TX
- Population (ZIP)
- 24,835
- Household income
- $71,605
- Rent vs Own
- Severe rent burden
- 997.0
Population outlook (Grayson County) Hauer SSP2
- Today (2025)
- 134,540 people
- By 2030
- 138,653 · +3.1%
- By 2040
- 145,958 · +8.5%
- By 2050
- 151,218 · +12.4%
- By 2075
- 161,802 · +20.3%
- By 2100
- 159,036 · +18.2%
Race, ethnicity, and origin ACS 2023
- Neighborhood character
- Predominantly White (73%)
- Race & ethnicity
- White 73% Hispanic / Latino 13% Two or more races 9% Black 6%
- Hispanic origin (detail)
- Mexican 11%
- Common ancestry
- Slovak 5% Serbian 2% Portuguese 2%
- Foreign-born
- 4% · Canada
- Languages at home
- 93% English-only · Spanish 6%
Political lean MEDSL · Grayson
- 2024 margin
- Solid R (+54.3) · D 22.5% · R 76.7%
- 2008→2024 swing
- -16.4pp toward R · 2008: -37.9pp · 2024: -54.3pp
- All cycles
- 2024: R+54.3 2020: R+49.9 2016: R+53.1 2012: R+48.0 2008: R+37.9
Not yet ingested
- Civics
- —
Market trends
- HPI YoY
- ▼ -295.96%
- Current HPI
- 257.1806
- Rent YoY
- ▬ 0.05%
- Metro
- Sherman-Denison, TX
- State GDP YoY
- ▲ 3.95%
- F500 in state
- 110
Industry mix (Fortune 500 HQ in TX)
| Industry | F500 HQs | Revenue |
|---|---|---|
| Energy | 16 | $1,198B |
|
||
| Technology | 5 | $198B |
|
||
| Engineering / Construction | 4 | $72B |
|
||
| Energy Services | 3 | $60B |
|
||
| Utilities | 3 | $41B |
|
||
| Healthcare | 2 | $330B |
|
||
Price history
+25.0% since first listed9 events — show timeline
- 2026-06-05 Price Changed $150,000 NTREIS
- 2026-06-05 Listed $145,000 NTREIS
- 2026-01-18 Price Changed $129,900 NTREIS
- 2025-12-27 Listed $135,000 NTREIS
- 2020-09-17 Sold (MLS) — NTREIS
- 2020-06-15 Pending — NTREIS
- 2020-06-01 Contingent — NTREIS
- 2020-04-27 Price Changed $108,000 NTREIS
- 2020-03-05 Listed $120,000 NTREIS
Property tax history
+1.2%/yrLatest (2020): $1,871 · +5.2% YoY. Source: county tax records.
Cash-flow waterfall
monthlySold comps — $/sqft
last 12 mo · ≤1 miLoading sold comps…