5021 Dania Cir · Port LaBelle, FL
Flood risk 1/10 · Minimal
- FEMA flood zone
- X (unshaded)
- Chance of flooding over 30 yrs
- 0.0%
- Est. flood insurance / yr
- $507 – $1,088
Fire risk 5/10 · Moderate
- Est. fire insurance / yr
- $947 – $1,759
Heat risk 9/10 · Severe
- Hot days now (above 108°F)
- 7 days/yr
- Hot days in 30 yrs
- 26 days/yr
Wind risk 10/10 · Severe
- Chance of severe wind over 30 yrs
- 99.0%
Air-quality risk 2/10 · Minimal
- Unhealthy air days now
- 0 days/yr
- Unhealthy air days in 30 yrs
- 1 days/yr
Risk factors via First Street. Map © Google.
Why this score? — see what drove the D grade
The composite is a weighted blend of 9 inputs, each scored 0–100. Each bar is that input's sub-score; the figure is the points it added to the 100-point composite (weight × sub-score).
- ARV discount +11.1/15.0
- Appreciation +10.0/10.0
- Cash flow +7.7/30.0
- Schools +3.1/10.0
- Livability +3.1/5.0
- Rent growth +2.5/5.0
- Condition / age +2.5/5.0
- 1% rule +2.3/10.0
- DSCR +1.8/10.0
$343,771
🖨 Deal sheet (PDF) 📄 Offer letter ✓ Due diligence
Listing remarks
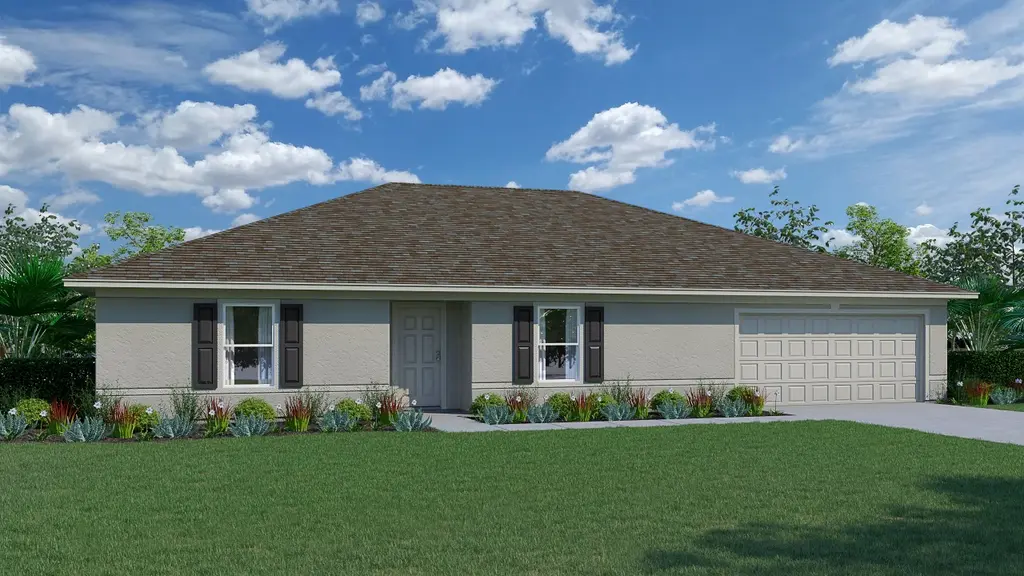
Discover the Majestic floorplan, part of our Value collection. This stunning home offers a harmonious blend of comfort and functionality, featuring 4 bedrooms, 2 full bathrooms, and a generously sized 2 car garage. The split plan design ensures optimal privacy for the Owner's Suite, creating a serene retreat separate from the other three bedrooms. Within the Owner's Suite, you'll find a full bath and a spacious walk-in closet, providing both convenience and style. The heart of the home is found in the open concept kitchen and great room, creating an inviting space that effortlessly accommodates family gatherings and shared moments. Additionally, a welcoming den awaits you at the front of th
Key facts
- Expansive backyard
- Quality finishes
- Indoor laundry room
Tags
Property features AI
Finance
- Financial info: List price $343,771
Exterior
- Parking: 2 garage spaces; 2 total parking spaces
- Home design: Single-family residence (spec home); Active listing
- Exterior features: Address: 5021 Dania Cir, Labelle, FL 33935
Interior
- Bedrooms: 4 bedrooms
- Bathrooms: 2 full bathrooms
- Interior features: Spec-built Majestic plan; Living area approximately 2,134
Neighborhood map
What this means for you Summary
Snapshot
- This is a 4-bed/2.0-bath single-family listed at $344k.
Deal economics
- At list price, monthly cash flow is $-399 ($-5k/yr) — negative.
- To cash-flow at today's rent, offer at most $286k (16.8% below list).
- To meet the 1% rule (rent ≥ 1% of price), the offer needs to be $250k (27.2% below list).
- Recommended offer: $250k (27.2% below list) — sets the bar for 1% rule.
Location & tenants
- Location reads 62/100 on livability (#750 in FL) — a middle-class / working-renter tenant base. Strengths: cost of living A+, housing A+; Watch: amenities F, commute F, employment F.
- Hendry (town): math 35% / reading 40% proficiency, ranked #65 of 73 in FL (top 89%) — families likely to look elsewhere, expect single-tenant / working-renter base with shorter leases; 75% free/reduced lunch — lower-income household profile, screen leases tightly.
- Zoned schools: Country Oaks Elementary School (math 48% / reading 45%, grade D-, #1,223 of 2,144 statewide, top 57%, 893 students, 75% FRL); Labelle Middle School (math 37% / reading 38%, grade F, #395 of 571 statewide, top 70%, 817 students, 72% FRL); Labelle High School (math 42% / reading 41%, grade F, #284 of 667 statewide, top 43%, 1,451 students, 62% FRL).
- Market conditions: 950 active listings in the ZIP; 8 comparable units currently listed for rent nearby; rentals at typical pace (median 26d on market — plan ~3-4 weeks tenant-placement turnaround); 557 units permitted in Hendry County in 2024 (45 in 5+ unit buildings).
- At $2,503/mo this rent would consume 53% of the median local household income ($57k/yr) (locally 498% of renters already pay >50% of income on rent) — very limited rent-growth headroom before tenants either downsize or default.
Forward outlook
- In year one you build about $37k of equity ($2k loan paydown + $34k appreciation (10.0% local appreciation)).
- Hendry County population projected to shrink 7% by 2050 — rents likely to lag national; underwrite the cash flow, not the appreciation.
- By year 2, paydown + projected appreciation supports a ~$59k cash-out refi (75% LTV) — recoverable capital for the next deal without selling this one.
Negotiation context
- It's been on market 314 days — a 12% lower offer ($303k) is reasonable based on typical stale-listing flexibility.
Risks & watch-outs
- Climate carrying-cost: severe wind risk, 99% chance of damaging wind over 30y; moderate wildfire risk; extreme-heat days projected 7→26/yr by 2055 (HVAC capex compounding) — expect insurance premiums to compound above CPI over the hold.
Questions for the listing agent
- What do current leases actually rent for vs. the listed asking? Can we see a recent rent roll and the last 12 months of T-12 income?
- It's been on market 314 days. Have you received any prior offers? Is the seller open to a 27% concession, seller financing, or rate buy-down credit?
- Why hasn't it sold? Are there any deal-killer items the seller is aware of (foundation, flood, title, zoning, code violations)?
- Is there a deadline driving the sale (1031 exchange, divorce, estate, relocation)? That informs how much negotiation room exists.
- Schools are F-rated, which usually means shorter tenancies and higher turnover. Who's the typical renter profile here, and what's been the actual vacancy rate?
- The area grade is low — what's the realistic commute time and amenity access for the typical tenant pool here? Any planned neighborhood developments (good or bad) we should know about?
- What's the average days-on-market for RENTAL listings here right now (not sales)? A rising rental-DOM trend means longer vacancies and softer asking-rent achievability than the comps imply.
- What's the recent tenant-quality profile in this submarket — average credit score on applications, eviction rate, late-payment / NSF rate, and stable-employment percentage? A property-management company in the area should have these aggregated.
- How much new for-sale + rental construction is in the pipeline within 1–3 miles? Heavy new supply typically softens prices + rents 12–24 months out; constrained supply supports both.
Investment metrics
- 1% rule
- 0.73% ✗
- Cap rate
- 4.90%
- Cash-on-cash
- -4.97%
- DSCR
- 0.78
- GRM
- 11.4
CMA / ARV
- ARV (on-the-fly)
- $373,450
- Comps found
- 8
Show comp detail 8 sales within ~0.75 mi
| Address | Dist | Beds/Ba | Sqft | Sold | Price | $/sf | Match |
|---|---|---|---|---|---|---|---|
| 5012 E Hummingbird Dr | 0.28mi | 4/2.0 | 1,828 (-14%) | 9mo | $303,000 | $166 | 56 |
| 5006 S Peachtree Cir | 0.67mi | 4/2.0 | 2,000 (-6%) | 6mo | $338,000 | $169 | 53 |
| 5027 E Hummingbird Dr | 0.33mi | 3/2.0 (-1) | 1,874 (-12%) | 14mo | $332,000 | $177 | 47 |
| 5014 SE Tradewinds Cir | 0.37mi | 4/2.0 | 1,828 (-14%) | 15mo | $322,060 | $176 | 46 |
| 7062 Calder Cir | 0.31mi | 3/2.0 (-1) | 1,900 (-11%) | 21mo | $310,000 | $163 | 44 |
| 5020 N Dogwood Cir | 0.42mi | 4/2.0 | 1,828 (-14%) | 18mo | $323,560 | $177 | 41 |
| 7015 Burma Cir | 0.39mi | 3/2.0 (-1) | 1,842 (-14%) | 17mo | $297,000 | $161 | 40 |
| 7008 Camp Ct | 0.53mi | 4/2.0 | 1,828 (-14%) | 16mo | $320,560 | $175 | 38 |
Match score weights: distance 35% · size 25% · config 20% · recency 20%. Top-matched comps best support the ARV.
Projected returns pro-forma
10.0% appreciation · 3.0% rent growth · sell at horizon
- IRR
- 20.8%
- Equity multiple
- 2.68×
- Total profit
- $161,869
- Equity at exit
- $309,696
- IRR
- 18.9%
- Equity multiple
- 6.16×
- Total profit
- $496,722
- Equity at exit
- $667,871
Cash invested: $96,256 (down + closing). Projections, not guarantees.
Landlord ↔ Tenant lean methodology
- Overall (STATE)
- 87 Strongly Landlord-Friendly
- State Florida
- 87 Strongly Landlord-Friendly · R+3
- County
- — inherits STATE
- City
- — inherits STATE
ZIP-level market 33935
- Home prices YoY
- 16.3%
- Active inventory
- 950
- Price-to-rent
- 11.4×
Monthly cashflow live
- Estimated rent
- $2,503 high interval (Pro) →
- Mortgage (P&I)
- −$1,803
- Tax est. 1.5%
- −$430 /mo · $5,157/yr
- Insurance
- −$143
- HOA
- −$0
- Vacancy / Maint / Mgmt
- −$526
- Net cashflow
- $-399
Break-even live
Sensitivity live
| Price | -10% $-161 | -5% $-280 | +0% $-399 | +5% $-518 | +10% $-636 |
|---|---|---|---|---|---|
| Rent | -10% $-596 | -5% $-498 | +0% $-399 | +5% $-300 | +10% $-201 |
| Rate | -1.0pp $-226 | -0.5pp $-311 | base $-399 | +0.5pp $-488 | +1.0pp $-578 |
UW: 25.0% down · 7.5% · 30yr · 1.5% tax · 5.0% vac · 8.0% maint · 8.0% mgmt
Financing live
Cash to close
- Down payment
- $85,943
- Closing costs
- $10,313
- Reserves months
- —
- Total cash needed
- —
Loan-product check · same deal, 3 products live
Conventional
25% down · 7.5% · 30yr
- Down + closing
- —
- Monthly P&I
- —
- Monthly cashflow
- —
- DSCR
- —
- Eligible?
- —
Personal DTI + credit; lowest rate.
DSCR
20% down · 8.5% · 30yr
- Down + closing
- —
- Monthly P&I
- —
- Monthly cashflow
- —
- DSCR
- —
- Eligible?
- —
No personal income docs; deal must DSCR.
Hard money
10% down · 12.0% · 12mo
- Down + closing
- —
- Monthly P&I
- —
- Monthly cashflow
- —
- DSCR
- —
- Eligible?
- —
Short-term bridge; refi at stabilization.
Rent comps 8 comps
| Address | Beds | Baths | Sqft | Rent | $/sqft | DOM | Units | Dist |
|---|---|---|---|---|---|---|---|---|
| 7038 Lotus Cir Labelle, FL | 4.0 | 3.0 | 1680 | $2,200 | $1.31 | 18d | 1 | 0.70mi |
| 5012 Gunn Pl Labelle, FL | 3.0 | 2.5 | 1783 | $2,500 | $1.40 | 4d | 1 | 0.74mi |
| 7016 Palpano Cir Labelle, FL | 3.0 | 2.5 | 1507 | $2,100 | $1.39 | 18d | 1 | 1.14mi |
| 3051 NW Beechwood Cir Labelle, FL | 4.0 | 2.0 | 1499 | $2,200 | $1.47 | 25d | 1 | 1.17mi |
| 7061 Tide Cir Labelle, FL | 4.0 | 2.0 | 1500 | $1,695 | $1.13 | 25d | 1 | 1.31mi |
| 9001 Penny Cir Labelle, FL | 3.0 | 2.0 | 1472 | $2,300 | $1.56 | 25d | 1 | 1.36mi |
| 9001 Penny Cir Labelle, FL | 3.0 | 2.0 | 1472 | $2,300 | $1.56 | 18d | 1 | 1.36mi |
| 9011 Penny Cir Labelle, FL | 3.0 | 2.0 | 1731 | $2,400 | $1.39 | 25d | 1 | 1.39mi |
Listing history 7 events
-
2026-06-22days on market $343,771 Active 314 DOM
-
2026-06-18days on market $343,771 Active 311 DOM
-
2026-06-17days on market $343,771 Active 310 DOM
-
2026-06-16days on market $343,771 Active 309 DOM
-
2026-06-15days on market $343,771 Active 308 DOM
-
2026-06-13remarks 699-char remark
-
2026-06-13$343,771 Active 305 DOM
ⓘ Source: listings_history table (triggers on properties + properties_extension) + one-shot
backfill from property_details.listing_events for pre-trigger history.
Climate risk First Street
- Flood 1/10 Low FEMA zone X (unshaded) · 0% chance over 30 yrs
- Wildfire 5/10 Major
- Heat 9/10 Extreme 7 d/yr ≥108°F today · 26 d/yr by 30 yrs out
- Wind 10/10 Extreme 99% chance of damaging wind over 30 yrs
- Air quality 2/10 Low 0 unhealthy d/yr today · 1 by 30 yrs out
Nearby sold comps map
Loading sold comps map…
Walkable amenities ~0.75 mi
Loading nearby amenities…
Taxation est. · year 1
- Rental income
- $30,030
- − Mortgage interest
- −$19,257
- − Property taxes
- −$5,157
- − Insurance
- −$1,719
- − Repairs & maintenance
- −$2,402
- − Management
- −$2,402
- − Depreciation
- −$10,001
- Taxable loss
- −$10,907
- Est. tax savings @ 24.0%
- +$2,618
- After-tax cash flow
- $-2,167/yr
For passive investors: Depreciation is non-cash, so a rental often shows a tax loss while cash-flowing — sheltering income. Rental losses are passive: they offset passive income freely, and up to $25,000/yr can offset ordinary (W-2) income if you actively participate and your MAGI is under $100k (phasing out to $0 by $150k); unused losses carry forward. On sale, claimed depreciation is recaptured at up to 25%, and gains may owe capital-gains tax (a 1031 exchange can defer both). Figures are a year-1 estimate at your 24.0% rate — not tax advice; consult a CPA.
Schools (NCES district)
- District
- Hendry
- NCES district ID
- 1200780
- Math proficiency
- 35% ▼ -11.00%
- Reading proficiency
- 40% ▼ -4.00%
- Median HH income
- $37,043
- Composite
- 31.16/100
- National rank
- #6054
- State rank
- #65 of 73 in FL
Livability — Port LaBelle
- Score
- 62/100
- State rank
- #750
- US rank
- #16264
Category grades
Schools grade is shown separately in the Schools card above.
Census & demographics
- Census place
- Port LaBelle, FL
- County
- Hendry County · 23,186 people
- Metro
- Clewiston, FL
- Population (ZIP)
- 23,186
- Household income
- $57,009
- Rent vs Own
- Severe rent burden
- 498.0
Population outlook (Hendry County) Hauer SSP2
- Today (2025)
- 38,866 people
- By 2030
- 38,558 · -0.8%
- By 2040
- 37,743 · -2.9%
- By 2050
- 36,117 · -7.1%
- By 2075
- 30,070 · -22.6%
- By 2100
- 21,966 · -43.5%
Race, ethnicity, and origin ACS 2023
- Neighborhood character
- Majority Hispanic (56%)
- Race & ethnicity
- Hispanic / Latino 56% White 39% Two or more races 21% Black 2% Native American 2%
- Hispanic origin (detail)
- Mexican 40% Puerto Rican 3% Cuban 5%
- Common ancestry
- Lithuanian 2% Serbian 2% Slovak 1%
- Foreign-born
- 27% · Canada, Jamaica
- Languages at home
- 50% English-only · Spanish 50%
Political lean MEDSL · Hendry
- 2024 margin
- Solid R (+38.3) · D 30.4% · R 68.7%
- 2008→2024 swing
- -31.1pp toward R · 2008: -7.2pp · 2024: -38.3pp
- All cycles
- 2024: R+38.3 2020: R+23.0 2016: R+14.2 2012: R+5.9 2008: R+7.2
Not yet ingested
- Civics
- —
Market trends
- HPI YoY
- ▲ 75.20%
- Current HPI
- 537.4928
- Rent YoY
- —
- Metro
- Clewiston, FL
- State GDP YoY
- ▲ 3.28%
- F500 in state
- 36
Industry mix (Fortune 500 HQ in FL)
| Industry | F500 HQs | Revenue |
|---|---|---|
| Industrial Technology | 2 | $29B |
|
||
| Insurance | 2 | $17B |
|
||
| Retail | 1 | $60B |
|
||
| Technology Distribution | 1 | $58B |
|
||
| Homebuilding | 1 | $35B |
|
||
| Technology Manufacturing | 1 | $35B |
|
||
Cash-flow waterfall
monthlySold comps — $/sqft
last 12 mo · ≤1 miLoading sold comps…