 🏷️ Likely Rental
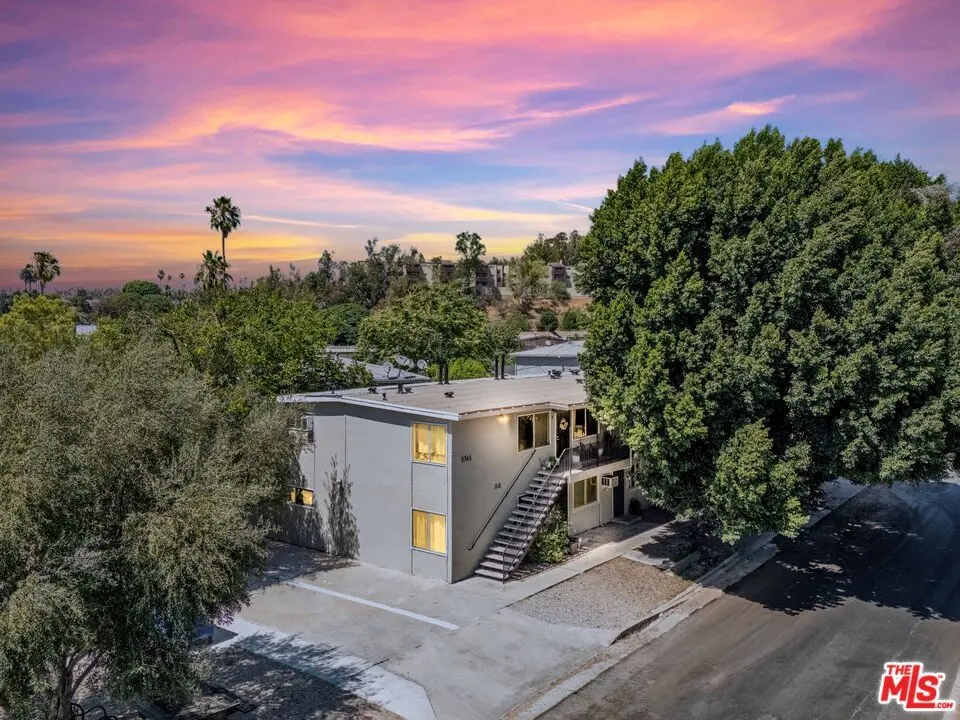
5745 Arroyo Dr · Los Angeles, CA
Flood risk 5/10 · Moderate
- FEMA flood zone
- X (unshaded)
- Chance of flooding over 30 yrs
- 0.38%
- Est. flood insurance / yr
- $507 – $1,088
Fire risk 2/10 · Minimal
- Est. fire insurance / yr
- $659 – $1,223
Heat risk 6/10 · Moderate
- Hot days now (above 96°F)
- 7 days/yr
- Hot days in 30 yrs
- 21 days/yr
Wind risk 1/10 · Minimal
- Chance of severe wind over 30 yrs
- —
Air-quality risk 6/10 · Moderate
- Unhealthy air days now
- 11 days/yr
- Unhealthy air days in 30 yrs
- 12 days/yr
Risk factors via First Street. Map © Google.
Why this score? — see what drove the B grade
The composite is a weighted blend of 9 inputs, each scored 0–100. Each bar is that input's sub-score; the figure is the points it added to the 100-point composite (weight × sub-score).
- Cash flow +27.3/30.0
- ARV discount +15.0/15.0
- DSCR +9.5/10.0
- 1% rule +7.5/10.0
- Schools +3.6/10.0
- Livability +3.4/5.0
- Rent growth +2.8/5.0
- Condition / age +2.5/5.0
- Appreciation +0.0/10.0
$1,200,000
🖨 Deal sheet 📄 Offer letter ✓ Due diligence
Multi-family units
County records classify this as Multi-Family (5+ Unit). Listing-text estimate: 6 units. confirmed
5+ unit building — per-unit beds/baths from public records are typically unavailable; the breakdown below (if shown) is an estimate from the listing text.
Listing remarks MLS
MOTIVATED SELLER * * * We are pleased to present 5745 Arroyo Drive, a 6 unit multifamily investment opportunity located in the highly desirable Highland Park neighborhood of Los Angeles, CA. The property consists of approximately 4,092 square feet of living space and features a unit mix of (6) two bedroom / one bathroom units. The property also offers on site parking, a valuable amenity in this high demand rental market. The asset presents a strong value add opportunity with approximately 83% rental upside, allowing an investor to significantly increase income and long term value. The property has benefited from approximately $100,000 in recent capital improvements, including exterior paint, partial roof replacement, upgraded trash systems, eco friendly irrigation, concrete work, and various unit repairs. Additionally, ownership has preliminary plans to add up to six ADUs, creating further upside through increased unit count and income potential. Located in one of Northeast Los Angeles' most vibrant neighborhoods, Highland Park continues to attract strong tenant demand due to its proximity to Downtown Los Angeles, Pasadena, and the thriving retail and dining corridors along York Boulevard and Figueroa Street. This is a rare opportunity to acquire a well located asset with strong in place income, substantial upside, and future development potential.
Key facts
- Exterior paint
- On-site parking
- 5,806 sq ft lot
Tags
Neighborhood map
What this means for you Summary
Snapshot
- This is a 6 × 2-bed/1.0-bath units multifamily listed at $1.20M.
Deal economics
- At list price, monthly cash flow is $3k ($42k/yr) — positive. Per door: $580/mo.
- The deal already cash-flows at list — no discount required.
- Meets the 1% rule at list price ($15k rent vs $1.20M).
- Recommended offer: $1.18M (1.5% below list) — sets the bar for market timing.
- Cap rate 9.8% vs local median 2.1% in Los Angeles — top-decile yield for the area; either an underpriced asset or a hidden risk that comps aren't pricing in. Stress-test before assuming the spread holds.
Location & tenants
- Location reads 68/100 on livability (#273 in CA) — a middle-class / working-renter tenant base. Strengths: amenities A+, commute A+, employment B; Watch: health & safety C-, schools D+, crime F.
- Los Angeles Unified (urban): math 29% / reading 54% proficiency, ranked #223 of 517 in CA (top 43%) — families likely to look elsewhere, expect single-tenant / working-renter base with shorter leases; 67% free/reduced lunch — lower-income household profile, screen leases tightly.
- Market conditions: Rents rising (+1.3%/yr); 180 active listings in the ZIP; solid renter incomes; 19,697 units permitted in Los Angeles County in 2024 (9,426 in 5+ unit buildings).
- At $14,963/mo this rent would consume 188% of the median local household income ($95k/yr) (locally 2699% of renters already pay >50% of income on rent) — very limited rent-growth headroom before tenants either downsize or default.
Forward outlook
- Local home prices are declining (-3.0%/yr); year-one equity from $8k of loan paydown is wiped out by about $36k of value loss. Plan a longer hold.
- Los Angeles County population projected at +9% by 2050 — modest demand growth; plan on rents tracking national, not racing it.
Negotiation context
- It's been on market 28 days — a 2% lower offer ($1.18M) is reasonable based on typical stale-listing flexibility.
- 12 sale attempts since 13y ago; this cycle's ask has dropped $95k (7%) from the opening price — seller is motivated, your offer sets the floor, not the list.
Risks & watch-outs
- Climate carrying-cost: moderate flood risk; extreme-heat days projected 7→21/yr by 2055 (HVAC capex compounding) — expect insurance premiums to compound above CPI over the hold.
Questions for the listing agent
- Can we see the unit-by-unit rent roll, current vacancy, and any below-market leases? What's the average tenancy length?
- What capital expenditures (roof, boiler, parking lot, exteriors) have been made in the last 5 years, and what's planned in the next 2?
- Built in 1961 — when were the roof, HVAC, electrical panel, plumbing, and water heater last replaced?
- Is there a deadline driving the sale (1031 exchange, divorce, estate, relocation)? That informs how much negotiation room exists.
- Schools are D-rated, which usually means shorter tenancies and higher turnover. Who's the typical renter profile here, and what's been the actual vacancy rate?
- Crime grade is F in this area — have there been break-ins, vandalism, or insurance claims at this property in the last 3 years? What carrier currently insures it and at what premium?
- What's the average days-on-market for RENTAL listings here right now (not sales)? A rising rental-DOM trend means longer vacancies and softer asking-rent achievability than the comps imply.
- What's the recent tenant-quality profile in this submarket — average credit score on applications, eviction rate, late-payment / NSF rate, and stable-employment percentage? A property-management company in the area should have these aggregated.
- How much new apartment / multifamily construction is in the pipeline within 1–3 miles? Heavy new supply (>2% of stock underway) typically softens rents 12–24 months out; light construction supports rent growth.
Investment metrics
- 1% rule
- 1.25% ✓
- Cap rate
- 9.78%
- Cash-on-cash
- 12.44%
- DSCR
- 1.55
- GRM
- 6.7
CMA / ARV
- ARV (median comp)
- $2,198,022
- List price
- $1,200,000
- Delta
- -43.36%
- Verdict
- UNDERPRICED
- Comps
- 1 within 2.0 mi
Projected returns pro-forma
-3.0% appreciation · 1.34% rent growth · sell at horizon
- IRR
- 0.2%
- Equity multiple
- 1.01×
- Total profit
- $3,013
- Equity at exit
- $178,924
- IRR
- 8.1%
- Equity multiple
- 1.57×
- Total profit
- $191,677
- Equity at exit
- $103,754
Cash invested: $336,000 (down + closing). Projections, not guarantees.
Landlord ↔ Tenant lean methodology
- Overall (CITY)
- 0 Strongly Tenant-Friendly
- State California
- 18 Strongly Tenant-Friendly · D+13
- County
- — inherits STATE
- City Los Angeles
- 0 Strongly Tenant-Friendly · D+22
ZIP-level market 90042
- Rents YoY
- 1.3%
- Active inventory
- 180
- Price-to-rent
- 40.1×
Monthly cashflow live
- Estimated rent
- $14,963 high interval (Pro) →
- Mortgage (P&I)
- −$6,293
- Tax from tax record
- −$1,545 /mo · $18,545/yr
- Insurance
- −$500
- HOA
- −$0
- Vacancy / Maint / Mgmt
- −$3,142
- Net cashflow
- $3,482
Break-even live
6-unit breakdown (identical units grouped — click to expand)
| Units | Beds | Baths | Est. rent |
|---|---|---|---|
| 6× units | 2 | 1 | $14,964 |
| #1 | 2 | 1 | $2,494 |
| #2 | 2 | 1 | $2,494 |
| #3 | 2 | 1 | $2,494 |
| #4 | 2 | 1 | $2,494 |
| #5 | 2 | 1 | $2,494 |
| #6 | 2 | 1 | $2,494 |
| Total (6 units) | $14,963 | ||
UW: 25.0% down · 7.5% · 30yr · 1.5% tax · 5.0% vac · 8.0% maint · 8.0% mgmt
Financing live
Cash to close
- Down payment
- $300,000
- Closing costs
- $36,000
- Reserves months
- —
- Total cash needed
- —
Loan-product check · same deal, 3 products live
Conventional
25% down · 7.5% · 30yr
- Down + closing
- —
- Monthly P&I
- —
- Monthly cashflow
- —
- DSCR
- —
- Eligible?
- —
Personal DTI + credit; lowest rate.
DSCR
20% down · 8.5% · 30yr
- Down + closing
- —
- Monthly P&I
- —
- Monthly cashflow
- —
- DSCR
- —
- Eligible?
- —
No personal income docs; deal must DSCR.
Hard money
10% down · 12.0% · 12mo
- Down + closing
- —
- Monthly P&I
- —
- Monthly cashflow
- —
- DSCR
- —
- Eligible?
- —
Short-term bridge; refi at stabilization.
Listing history 44 events
-
2026-06-18days on market $1,200,000 Active 28 DOM
-
2026-06-17days on market $1,200,000 Active 27 DOM
-
2026-06-16days on market $1,200,000 Active 26 DOM
-
2026-06-15days on market $1,200,000 Active 25 DOM
-
2026-06-13days on market $1,200,000 Active 23 DOM
-
2026-06-09days on market $1,200,000 Active 19 DOM
-
2026-06-08days on market $1,200,000 Active 18 DOM
-
2026-06-07days on market $1,200,000 Active 17 DOM
-
2026-06-04days on market $1,200,000 Active 14 DOM
-
2026-06-03days on market $1,200,000 Active 13 DOM
-
2026-06-02days on market $1,200,000 Active 12 DOM
-
2026-06-01days on market $1,200,000 Active 11 DOM
-
2026-05-31days on market $1,200,000 Active 10 DOM
-
2026-03-23price $1,245,000 1375-char remark
Show marketing remark (1375 chars)
MOTIVATED SELLER * * * We are pleased to present 5745 Arroyo Drive, a 6 unit multifamily investment opportunity located in the highly desirable Highland Park neighborhood of Los Angeles, CA. The property consists of approximately 4,092 square feet of living space and features a unit mix of (6) two bedroom / one bathroom units. The property also offers on site parking, a valuable amenity in this high demand rental market. The asset presents a strong value add opportunity with approximately 83% rental upside, allowing an investor to significantly increase income and long term value. The property has benefited from approximately $100,000 in recent capital improvements, including exterior paint, partial roof replacement, upgraded trash systems, eco friendly irrigation, concrete work, and various unit repairs. Additionally, ownership has preliminary plans to add up to six ADUs, creating further upside through increased unit count and income potential. Located in one of Northeast Los Angeles' most vibrant neighborhoods, Highland Park continues to attract strong tenant demand due to its proximity to Downtown Los Angeles, Pasadena, and the thriving retail and dining corridors along York Boulevard and Figueroa Street. This is a rare opportunity to acquire a well located asset with strong in place income, substantial upside, and future development potential.
-
2026-03-10$1,295,000 Active 1375-char remark
Show marketing remark (1375 chars)
MOTIVATED SELLER * * * We are pleased to present 5745 Arroyo Drive, a 6 unit multifamily investment opportunity located in the highly desirable Highland Park neighborhood of Los Angeles, CA. The property consists of approximately 4,092 square feet of living space and features a unit mix of (6) two bedroom / one bathroom units. The property also offers on site parking, a valuable amenity in this high demand rental market. The asset presents a strong value add opportunity with approximately 83% rental upside, allowing an investor to significantly increase income and long term value. The property has benefited from approximately $100,000 in recent capital improvements, including exterior paint, partial roof replacement, upgraded trash systems, eco friendly irrigation, concrete work, and various unit repairs. Additionally, ownership has preliminary plans to add up to six ADUs, creating further upside through increased unit count and income potential. Located in one of Northeast Los Angeles' most vibrant neighborhoods, Highland Park continues to attract strong tenant demand due to its proximity to Downtown Los Angeles, Pasadena, and the thriving retail and dining corridors along York Boulevard and Figueroa Street. This is a rare opportunity to acquire a well located asset with strong in place income, substantial upside, and future development potential.
-
2024-04-25Active
-
2023-07-14soldstatus $1,450,000 Closed Sale
-
2023-07-14soldstatus $1,450,000
-
2023-07-10status Pending Sale
-
2023-06-14historical Active Under Contract
-
2023-05-16status Active
-
2023-05-15price $1,450,000
-
2023-03-02$1,550,000 Active
-
2022-12-30historical
-
2022-11-11status Active
-
2022-06-25status Active
-
2022-06-24price $1,550,000
-
2022-05-11status Active
-
2022-05-11price $1,730,000
-
2022-02-22$1,919,000 Active
-
2015-12-15historical
-
2015-12-15soldstatus $920,000 Closed Sale
-
2015-12-15soldstatus $920,000
-
2015-12-11soldstatus $920,000
-
2015-10-29status Pending Sale
-
2015-10-13$888,800 Active
-
2015-10-13$888,800
-
2014-04-01historical
-
2014-03-10soldstatus $605,000 Closed
-
2014-02-27soldstatus $605,000
-
2014-01-27$600,000 Active
-
2013-01-24$648,000
-
2005-11-18soldstatus $730,000
-
1980-01-18soldstatus $86,500
ⓘ Source: listings_history table (triggers on properties + properties_extension) + one-shot
backfill from property_details.listing_events for pre-trigger history.
Tax reassessment forecast CA · Resets to sale price
- Current annual tax
- $18,545 · $1,545/mo
- Projected year-2 tax
- $18,545 · $1,545/mo
- Expected delta
- $0/yr ($0/mo · 0.0%)
ⓘ Screening estimate from a state-policy table — verify with the county assessor before closing.
Climate risk First Street
- Flood 5/10 Major FEMA zone X (unshaded) · 38% chance over 30 yrs
- Wildfire 2/10 Low
- Heat 6/10 Major 7 d/yr ≥96°F today · 21 d/yr by 30 yrs out
- Wind 1/10 Low
- Air quality 6/10 Major 11 unhealthy d/yr today · 12 by 30 yrs out
Nearby sold comps map
Loading sold comps map…
Walkable amenities ~0.75 mi
Loading nearby amenities…
Taxation est. · year 1
- Rental income
- $179,556
- − Mortgage interest
- −$67,219
- − Property taxes
- −$18,545
- − Insurance
- −$6,000
- − Repairs & maintenance
- −$14,364
- − Management
- −$14,364
- − Depreciation
- −$34,909
- Taxable income
- $24,154
- Est. tax owed @ 24.0%
- −$5,797
- After-tax cash flow
- $35,992/yr
For passive investors: Depreciation is non-cash, so a rental often shows a tax loss while cash-flowing — sheltering income. Rental losses are passive: they offset passive income freely, and up to $25,000/yr can offset ordinary (W-2) income if you actively participate and your MAGI is under $100k (phasing out to $0 by $150k); unused losses carry forward. On sale, claimed depreciation is recaptured at up to 25%, and gains may owe capital-gains tax (a 1031 exchange can defer both). Figures are a year-1 estimate at your 24.0% rate — not tax advice; consult a CPA.
Schools (NCES district)
- District
- Los Angeles Unified
- NCES district ID
- 0622710
- Math proficiency
- 29% ▼ -4.00%
- Reading proficiency
- 54% ▲ 10.00%
- Median HH income
- $50,403
- Composite
- 35.67/100
- National rank
- #4875
- State rank
- #223 of 517 in CA
Livability — Los Angeles
- Score
- 68/100
- State rank
- #273
- US rank
- #9237
Category grades
Schools grade is shown separately in the Schools card above.
Census & demographics
- Census place
- Los Angeles, CA
- County
- Los Angeles County · 9,444,647 people
- City population
- 3,838,149
- Metro
- Los Angeles-Long Beach-Anaheim, CA
- Population (ZIP)
- 56,835
- Household income
- $95,282
- Rent vs Own
- Severe rent burden
- 2699.0
Population outlook (Los Angeles County) Hauer SSP2
- Today (2025)
- 10,940,515 people
- By 2030
- 11,256,481 · +2.9%
- By 2040
- 11,729,929 · +7.2%
- By 2050
- 11,948,407 · +9.2%
- By 2075
- 11,818,114 · +8.0%
- By 2100
- 10,842,928 · -0.9%
Race, ethnicity, and origin ACS 2023
- Neighborhood character
- Diverse neighborhood (Simpson 0.60)
- Race & ethnicity
- Hispanic / Latino 56% White 24% Two or more races 22% Asian 13% Native American 3% Black 2%
- Hispanic origin (detail)
- Mexican 41%
- Common ancestry
- Lithuanian 2% Romanian 2% Slovak 1%
- Foreign-born
- 36% · Canada, China, South Korea
- Languages at home
- 40% English-only · Spanish 47% Tagalog/Filipino 5% Chinese 2%
Political lean MEDSL · Los Angeles
- 2024 margin
- Solid D (+32.9) · D 64.8% · R 31.9% · Other 3.3%
- 2008→2024 swing
- -7.4pp toward R · 2008: 40.4pp · 2024: 32.9pp
- All cycles
- 2024: D+32.9 2020: D+44.2 2016: D+48.0 2012: D+40.0 2008: D+40.4
Not yet ingested
- Civics
- —
Market trends
- HPI YoY
- ▼ -1816.99%
- Current HPI
- 637.0324
- Rent YoY
- ▲ 1.34%
- Metro
- Los Angeles-Long Beach-Anaheim, CA
- State GDP YoY
- ▲ 3.21%
- F500 in state
- 116
Industry mix (Fortune 500 HQ in CA)
| Industry | F500 HQs | Revenue |
|---|---|---|
| Technology | 27 | $1,492B |
|
||
| Financial Services | 3 | $174B |
|
||
| Retail | 3 | $44B |
|
||
| Insurance | 3 | $26B |
|
||
| Media / Entertainment | 2 | $115B |
|
||
| Pharmaceuticals / Biotech | 2 | $62B |
|
||
Price history
+1339.3% since first listed31 events — show timeline
- 2026-03-23 Price Changed $1,245,000 TheMLS
- 2026-03-10 Listed $1,295,000 TheMLS
- 2024-04-25 Listed — TheMLS
- 2023-07-14 Sold (Public Records) $1,450,000 Public Records
- 2023-07-14 Sold (MLS) $1,450,000 CRMLS
- 2023-07-10 Pending — CRMLS
- 2023-06-14 Contingent — CRMLS
- 2023-05-16 Relisted — CRMLS
- 2023-05-15 Price Changed $1,450,000 CRMLS
- 2023-03-02 Listed $1,550,000 CRMLS
- 2022-12-30 Listing Removed — CRMLS
- 2022-11-11 Relisted — CRMLS
- 2022-06-25 Relisted — CRMLS
- 2022-06-24 Price Changed $1,550,000 CRMLS
- 2022-05-11 Relisted — CRMLS
- 2022-05-11 Price Changed $1,730,000 CRMLS
- 2022-02-22 Listed $1,919,000 CRMLS
- 2015-12-15 Listing Removed — CRMLS
- 2015-12-15 Sold (MLS) $920,000 SDMLS
- 2015-12-15 Sold (MLS) $920,000 CRMLS
- 2015-12-11 Sold (Public Records) $920,000 Public Records
- 2015-10-29 Pending — CRMLS
- 2015-10-13 Listed $888,800 CRMLS
- 2015-10-13 Listed $888,800 SDMLS
- 2014-04-01 Listing Removed — CRMLS
- 2014-03-10 Sold (MLS) $605,000 CRMLS
- 2014-02-27 Sold (Public Records) $605,000 Public Records
- 2014-01-27 Listed $600,000 CRMLS
- 2013-01-24 Listed $648,000 CRMLS
- 2005-11-18 Sold (Public Records) $730,000 Public Records
- 1980-01-18 Sold (Public Records) $86,500 Public Records
Property tax history
+3.9%/yrLatest (2025): $18,545 · +1.2% YoY. Source: county tax records.
Cash-flow waterfall
monthlySold comps — $/sqft
last 12 mo · ≤1 miLoading sold comps…