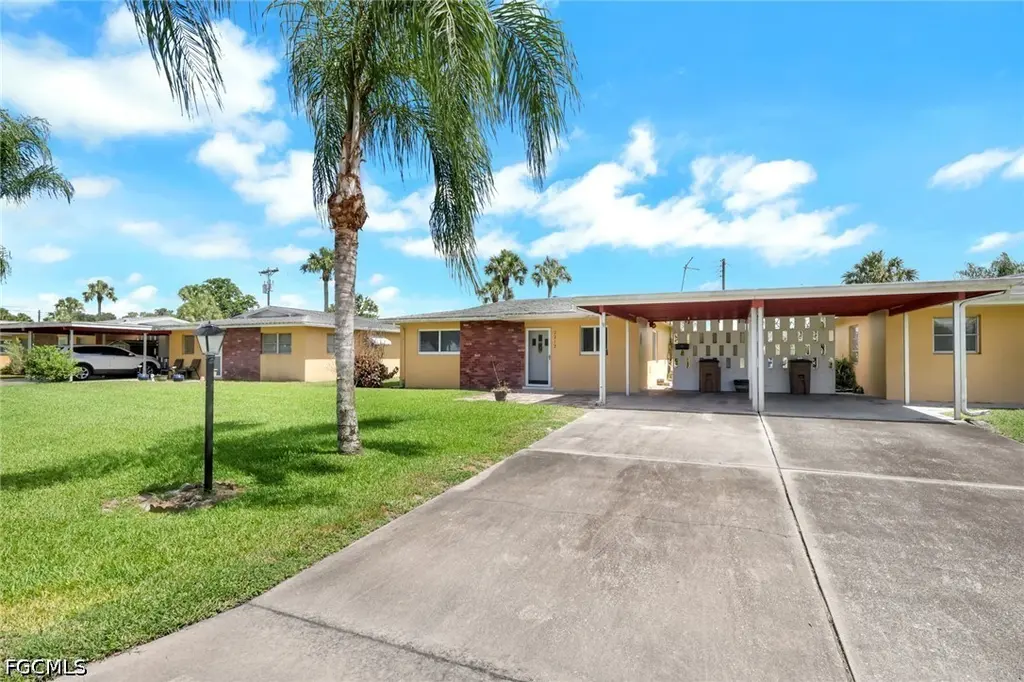
2212 E 6th St · Lehigh Acres, FL
Flood risk 1/10 · Minimal
- FEMA flood zone
- X (unshaded)
- Chance of flooding over 30 yrs
- 0.0%
- Est. flood insurance / yr
- $507 – $1,088
Fire risk 1/10 · Minimal
- Est. fire insurance / yr
- $947 – $1,759
Heat risk 9/10 · Severe
- Hot days now (above 108°F)
- 7 days/yr
- Hot days in 30 yrs
- 28 days/yr
Wind risk 10/10 · Severe
- Chance of severe wind over 30 yrs
- 99.0%
Air-quality risk 2/10 · Minimal
- Unhealthy air days now
- 1 days/yr
- Unhealthy air days in 30 yrs
- 2 days/yr
Risk factors via First Street. Map © Google.
Why this score? — see what drove the C grade
The composite is a weighted blend of 9 inputs, each scored 0–100. Each bar is that input's sub-score; the figure is the points it added to the 100-point composite (weight × sub-score).
- Cash flow +23.0/30.0
- 1% rule +9.3/10.0
- ARV discount +7.5/15.0
- DSCR +7.4/10.0
- Schools +4.1/10.0
- Livability +3.0/5.0
- Condition / age +2.5/5.0
- Rent growth +2.3/5.0
- Appreciation +0.0/10.0
$100,000
🖨 Deal sheet (PDF) 📄 Offer letter ✓ Due diligence
Listing remarks
Welcome to this charming 2-bedroom, 2-bath home with a den, located in a quiet 55+ community in Lehigh Acres. Equipped with a new HVAC system in 2026, and Water Heater in 2026. This well-kept property features terrazzo floors throughout, an inside laundry room, and a spacious layout designed for comfortable living. The large breakfast bar can easily host 4 or 5 seats. The dining area opens into the family room, creating a bright and inviting space. Enjoy the screened-in back patio with pavers just off the den area, perfect for morning coffee or enjoying the evening outside. The home also offers a spacious covered carport plus extra driveway parking for added convenience. A wonderful opport
Key facts
- Large breakfast bar
- Covered carport
- Inside laundry room
Tags
Property features AI
Finance
- HOA & community: Homeowners association with a $320 monthly fee; HOA covers irrigation water, grounds maintenance, and trash; Non-gated community
Exterior
- Parking: Attached carport (1 covered space)
- Security: Smoke detectors
- Utilities: Public water; Public sewer; Cable available; High-speed internet available
- Home design: Single-story; Faces north; Resale property; Zoned RM-2
- Construction: Built with block, concrete, and stone; Shingle roof
- Exterior features: Lanai / screened porch; Patio; Porch; Attached storage; Lake irrigation source; Rectangular lot; Lot exposures to the south
Interior
- Kitchen: Range; Microwave; Dishwasher; Disposal; Refrigerator; Freezer; Pantry; Breakfast bar
- Bedrooms: Master bedroom (15 x 10); Bedroom (10 x 11)
- Flooring: Terrazzo flooring
- Bathrooms: 2 full bathrooms
- Heating & cooling: Central heating (electric); Central air conditioning (electric); Ceiling fans
- Interior features: Single-hung and impact-resistant windows; Breakfast bar; Combined family and dining area; Living and dining room space; Pantry; Tub/shower; Cable TV-ready; Bar; Unfurnished
- Laundry & utility: Washer and dryer (inside)
Neighborhood map
What this means for you Summary
Snapshot
- This is a 2-bed/2.0-bath condo listed at $100k.
Deal economics
- At list price, monthly cash flow is $178 ($2k/yr) — positive.
- The deal already cash-flows at list — no discount required.
- Meets the 1% rule at list price ($1k rent vs $100k).
- Recommended offer: $98k (1.5% below list) — sets the bar for market timing.
- Cap rate 8.4% vs local median 4.7% in Lehigh Acres — top-decile yield for the area; either an underpriced asset or a hidden risk that comps aren't pricing in. Stress-test before assuming the spread holds.
Location & tenants
- Location reads 59/100 on livability (#826 in FL) — a working-class tenant base; expect higher turnover. Strengths: cost of living A+, housing A+; Watch: crime C-, employment D+, schools D-.
- Lee (suburban): math 47% / reading 50% proficiency, ranked #42 of 73 in FL (top 58%) — families likely to look elsewhere, expect single-tenant / working-renter base with shorter leases.
- Market conditions: Rents soft (-0.8%/yr); 641 active listings in the ZIP; 11 comparable units currently listed for rent nearby; rentals at typical pace (median 25d on market — plan ~3-4 weeks tenant-placement turnaround); 15,411 units permitted in Lee County in 2024 (4,686 in 5+ unit buildings).
- This rent runs 33% of the median local income ($51k/yr) — at the standard rent-burdened threshold; future hikes will face affordability resistance.
Forward outlook
- Local home prices are declining (-3.0%/yr); year-one equity from $691 of loan paydown is wiped out by about $3k of value loss. Plan a longer hold.
- Lee County population projected at +44% by 2050 — long-run rental-demand tailwind backs the buy-and-hold thesis.
Negotiation context
- It's been on market 19 days — a 2% lower offer ($98k) is reasonable based on typical stale-listing flexibility.
- 4 sale attempts since 2y ago with the ask held roughly flat each time — persistent listings suggest the price (not the market) is what's stuck; bring a comps-based counter.
- Current owner paid $49k; list at $100k implies a 105% gain — meaningful room to come down on a strong offer.
Risks & watch-outs
- Watch-outs: HOA is 22% of rent.
- Climate carrying-cost: severe wind risk, 99% chance of damaging wind over 30y; extreme-heat days projected 7→28/yr by 2055 (HVAC capex compounding) — expect insurance premiums to compound above CPI over the hold.
Questions for the listing agent
- Built in 1970 — when were the roof, HVAC, electrical panel, plumbing, and water heater last replaced?
- What does the HOA fee cover, when was the last increase, and are there any pending special assessments or reserve-fund shortfalls?
- Any open or pending special assessments — roof, HVAC, plumbing, elevator, façade? What's the per-unit balance and payoff schedule, and is the seller paying it off at close or rolling it to the buyer?
- Is there a deadline driving the sale (1031 exchange, divorce, estate, relocation)? That informs how much negotiation room exists.
- Schools are D-rated, which usually means shorter tenancies and higher turnover. Who's the typical renter profile here, and what's been the actual vacancy rate?
- What's the average days-on-market for RENTAL listings here right now (not sales)? A rising rental-DOM trend means longer vacancies and softer asking-rent achievability than the comps imply.
- What's the recent tenant-quality profile in this submarket — average credit score on applications, eviction rate, late-payment / NSF rate, and stable-employment percentage? A property-management company in the area should have these aggregated.
- How much new apartment / multifamily construction is in the pipeline within 1–3 miles? Heavy new supply (>2% of stock underway) typically softens rents 12–24 months out; light construction supports rent growth.
Investment metrics
- 1% rule
- 1.43% ✓
- Cap rate
- 8.43%
- Cash-on-cash
- 7.63%
- DSCR
- 1.34
- GRM
- 5.8
CMA / ARV
No comps found within radius.
Projected returns pro-forma
-3.0% appreciation · 0.0% rent growth · sell at horizon
- IRR
- -9.0%
- Equity multiple
- 0.68×
- Total profit
- $-8,879
- Equity at exit
- $14,910
- IRR
- -5.8%
- Equity multiple
- 0.69×
- Total profit
- $-8,615
- Equity at exit
- $8,646
Cash invested: $28,000 (down + closing). Projections, not guarantees.
Landlord ↔ Tenant lean methodology
- Overall (STATE)
- 87 Strongly Landlord-Friendly
- State Florida
- 87 Strongly Landlord-Friendly · R+3
- County
- — inherits STATE
- City
- — inherits STATE
ZIP-level market 33936
- Home prices YoY
- -19.9%
- Rents YoY
- -0.8%
- Active inventory
- 641
- Price-to-rent
- 5.8×
Monthly cashflow live
- Estimated rent
- $1,433 high interval (Pro) →
- Mortgage (P&I)
- −$524
- Tax from tax record
- −$68 /mo · $818/yr
- Insurance
- −$42
- HOA
- −$320
- Vacancy / Maint / Mgmt
- −$301
- Net cashflow
- $178
Break-even live
Sensitivity live
| Price | -10% $235 | -5% $206 | +0% $178 | +5% $150 | +10% $121 |
|---|---|---|---|---|---|
| Rent | -10% $65 | -5% $121 | +0% $178 | +5% $235 | +10% $291 |
| Rate | -1.0pp $228 | -0.5pp $204 | base $178 | +0.5pp $152 | +1.0pp $126 |
UW: 25.0% down · 7.5% · 30yr · 1.5% tax · 5.0% vac · 8.0% maint · 8.0% mgmt
Financing live
Cash to close
- Down payment
- $25,000
- Closing costs
- $3,000
- Reserves months
- —
- Total cash needed
- —
Loan-product check · same deal, 3 products live
Conventional
25% down · 7.5% · 30yr
- Down + closing
- —
- Monthly P&I
- —
- Monthly cashflow
- —
- DSCR
- —
- Eligible?
- —
Personal DTI + credit; lowest rate.
DSCR
20% down · 8.5% · 30yr
- Down + closing
- —
- Monthly P&I
- —
- Monthly cashflow
- —
- DSCR
- —
- Eligible?
- —
No personal income docs; deal must DSCR.
Hard money
10% down · 12.0% · 12mo
- Down + closing
- —
- Monthly P&I
- —
- Monthly cashflow
- —
- DSCR
- —
- Eligible?
- —
Short-term bridge; refi at stabilization.
Rent comps 11 comps
| Address | Beds | Baths | Sqft | Rent | $/sqft | DOM | Units | Dist |
|---|---|---|---|---|---|---|---|---|
| 2213 Gardenia Way Lehigh Acres, FL | 2.0 | 1.5 | 900 | $1,740 | $1.93 | 24d | 1 | 0.17mi |
| 2201 E 5th St #23 Lehigh Acres, FL | 2.0 | 2.0 | 1011 | $1,300 | $1.29 | 4d | 1 | 0.33mi |
| 732 Joel Blvd Lehigh Acres, FL | 2.0 | 2.0 | 788 | $1,200 | $1.52 | 24d | 1 | 0.47mi |
| 738 Joel Blvd Lehigh Acres, FL | 2.0 | 2.0 | 968 | $1,050 | $1.08 | 24d | 1 | 0.47mi |
| 343 Joel Blvd #111 Lehigh Acres, FL | 2.0 | 2.0 | 921 | $900 | $0.98 | 24d | 1 | 0.57mi |
| 333 Joel Blvd Lehigh Acres, FL | 2.0 | 1.0–2.0 | 877 | $1,048 | $1.19 | 17d | 2 | 0.63mi |
| 321 Dania St Lehigh Acres, FL | 2.0 | 2.0 | 915 | $1,800 | $1.97 | 24d | 1 | 0.86mi |
| 347 Richland Rd Lehigh Acres, FL | 2.0 | 2.0 | 1040 | $1,150 | $1.11 | 24d | 1 | 1.11mi |
| 198 Joel Blvd #6 Lehigh Acres, FL | 2.0 | 2.0 | 1036 | $1,200 | $1.16 | 4d | 1 | 1.11mi |
| 3803 E 6th St Lehigh Acres, FL | 3.0 | 2.0 | 1100 | $1,485 | $1.35 | 24d | 1 | 1.38mi |
| 807 Monroe Dr Lehigh Acres, FL | 3.0 | 2.0 | 965 | $1,750 | $1.81 | 4d | 1 | 1.46mi |
HOA detail condo
- Monthly dues
- $320 · $3,840/yr
- Likely covers
- water
- Assessments
- None detected in remarks — confirm with the listing agent.
Listing history 15 events
-
2026-06-18days on market $100,000 Active 19 DOM
-
2026-06-17days on market $100,000 Active 18 DOM
-
2026-06-16days on market $100,000 Active 17 DOM
-
2026-06-15days on market $100,000 Active 16 DOM
-
2026-06-13remarks 699-char remark
-
2026-06-13days on market $100,000 Active 14 DOM
-
2026-06-10days on market $100,000 Active 11 DOM
-
2026-06-09days on market $100,000 Active 10 DOM
-
2026-06-08days on market $100,000 Active 9 DOM
-
2026-06-07days on market $100,000 Active 8 DOM
-
2026-06-03days on market $100,000 Active 4 DOM
-
2026-06-02days on market $100,000 Active 3 DOM
-
2026-06-01days on market $100,000 Active 2 DOM
-
2026-05-31remarks 688-char remark
-
2026-05-31$100,000 Active 1 DOM
ⓘ Source: listings_history table (triggers on properties + properties_extension) + one-shot
backfill from property_details.listing_events for pre-trigger history.
Tax reassessment forecast FL · Resets to sale price
- Current annual tax
- $818 · $68/mo
- Projected year-2 tax
- $830 · $69/mo
- Expected delta
- +$12/yr (+$1/mo · 1.5%)
ⓘ Screening estimate from a state-policy table — verify with the county assessor before closing.
Climate risk First Street
- Flood 1/10 Low FEMA zone X (unshaded) · 0% chance over 30 yrs
- Wildfire 1/10 Low
- Heat 9/10 Extreme 7 d/yr ≥108°F today · 28 d/yr by 30 yrs out
- Wind 10/10 Extreme 99% chance of damaging wind over 30 yrs
- Air quality 2/10 Low 1 unhealthy d/yr today · 2 by 30 yrs out
Nearby sold comps map
Loading sold comps map…
Walkable amenities ~0.75 mi
Loading nearby amenities…
Taxation est. · year 1
- Rental income
- $17,199
- − Mortgage interest
- −$5,602
- − Property taxes
- −$818
- − Insurance
- −$500
- − Repairs & maintenance
- −$1,376
- − Management
- −$1,376
- − HOA
- −$3,840
- − Depreciation
- −$2,909
- Taxable income
- $779
- Est. tax owed @ 24.0%
- −$187
- After-tax cash flow
- $1,950/yr
For passive investors: Depreciation is non-cash, so a rental often shows a tax loss while cash-flowing — sheltering income. Rental losses are passive: they offset passive income freely, and up to $25,000/yr can offset ordinary (W-2) income if you actively participate and your MAGI is under $100k (phasing out to $0 by $150k); unused losses carry forward. On sale, claimed depreciation is recaptured at up to 25%, and gains may owe capital-gains tax (a 1031 exchange can defer both). Figures are a year-1 estimate at your 24.0% rate — not tax advice; consult a CPA.
Schools (NCES district)
- District
- Lee
- NCES district ID
- 1201080
- Math proficiency
- 47% ▼ -11.00%
- Reading proficiency
- 50% ▼ -4.00%
- Median HH income
- $49,518
- Composite
- 41.49/100
- National rank
- #3458
- State rank
- #42 of 73 in FL
Livability — Lehigh Acres
- Score
- 59/100
- State rank
- #826
- US rank
- #20055
Category grades
Schools grade is shown separately in the Schools card above.
Census & demographics
- Census place
- Lehigh Acres, FL
- County
- Lee County · 788,662 people
- City population
- 130,638
- Metro
- Cape Coral-Fort Myers, FL
- Population (ZIP)
- 27,967
- Household income
- $51,417
- Rent vs Own
- Severe rent burden
- 1027.0
Population outlook (Lee County) Hauer SSP2
- Today (2025)
- 871,946 people
- By 2030
- 955,468 · +9.6%
- By 2040
- 1,113,587 · +27.7%
- By 2050
- 1,256,891 · +44.1%
- By 2075
- 1,560,270 · +78.9%
- By 2100
- 1,726,848 · +98.0%
Race, ethnicity, and origin ACS 2023
- Neighborhood character
- Diverse neighborhood (Simpson 0.63)
- Race & ethnicity
- Hispanic / Latino 44% White 41% Two or more races 21% Black 9% Asian 1%
- Hispanic origin (detail)
- Mexican 7% Puerto Rican 9% Cuban 18% Dominican 2%
- Common ancestry
- Hispanic 3% Romanian 2% Lithuanian 1%
- Foreign-born
- 28% · Canada, Jamaica
- Languages at home
- 59% English-only · Spanish 36% French/Haitian/Cajun 3% Tagalog/Filipino 1%
Political lean MEDSL · Lee
- 2024 margin
- Strong R (+28.4) · D 35.5% · R 63.9%
- 2008→2024 swing
- -18.0pp toward R · 2008: -10.4pp · 2024: -28.4pp
- All cycles
- 2024: R+28.4 2020: R+19.2 2016: R+20.4 2012: R+16.6 2008: R+10.4
Not yet ingested
- Civics
- —
Market trends
- HPI YoY
- ▼ -86.78%
- Current HPI
- 348.8631
- Rent YoY
- ▼ -0.77%
- Metro
- Cape Coral-Fort Myers, FL
- State GDP YoY
- ▲ 3.28%
- F500 in state
- 36
Industry mix (Fortune 500 HQ in FL)
| Industry | F500 HQs | Revenue |
|---|---|---|
| Industrial Technology | 2 | $29B |
|
||
| Insurance | 2 | $17B |
|
||
| Retail | 1 | $60B |
|
||
| Technology Distribution | 1 | $58B |
|
||
| Homebuilding | 1 | $35B |
|
||
| Technology Manufacturing | 1 | $35B |
|
||
Price history
+280.2% since first listed13 events — show timeline
- 2026-05-18 Listed $100,000 FORTMLS
- 2026-05-17 Listing Removed — FORTMLS
- 2026-01-07 Listed $162,900 FORTMLS
- 2025-11-29 Listing Removed — FORTMLS
- 2025-10-31 Price Changed $162,900 FORTMLS
- 2025-08-14 Price Changed $169,900 FORTMLS
- 2025-05-29 Price Changed $174,900 FORTMLS
- 2025-05-29 Listed $179,900 FORTMLS
- 2025-05-27 Listing Removed — FORTMLS
- 2024-11-27 Listed $179,900 FORTMLS
- 2002-07-26 Sold (Public Records) $48,800 Public Records
- 1977-03-01 Sold (Public Records) $32,500 Public Records
- 1976-12-01 Sold (Public Records) $26,300 Public Records
Property tax history
+10.8%/yrLatest (2025): $818 · +18.8% YoY. Source: county tax records.
Cash-flow waterfall
monthlySold comps — $/sqft
last 12 mo · ≤1 miLoading sold comps…