1691 Seabring On Your Lot · Lake Havasu City, AZ
Flood risk No data
- FEMA flood zone
- —
- Chance of flooding over 30 yrs
- —
- Est. flood insurance / yr
- —
Fire risk No data
- Est. fire insurance / yr
- —
Heat risk No data
- Hot days now (above threshold)
- —
- Hot days in 30 yrs
- —
Wind risk No data
- Chance of severe wind over 30 yrs
- —
Air-quality risk No data
- Unhealthy air days now
- —
- Unhealthy air days in 30 yrs
- —
Risk factors via First Street. Map © Google.
Why this score? — see what drove the D grade
The composite is a weighted blend of 9 inputs, each scored 0–100. Each bar is that input's sub-score; the figure is the points it added to the 100-point composite (weight × sub-score).
- ARV discount +15.0/15.0
- Cash flow +8.7/30.0
- Rent growth +3.4/5.0
- Schools +3.4/10.0
- Livability +3.2/5.0
- 1% rule +2.7/10.0
- Condition / age +2.5/5.0
- DSCR +2.4/10.0
- Appreciation +0.0/10.0
$329,000
🖨 Deal sheet (PDF) 📄 Offer letter ✓ Due diligence
Listing remarks MLS
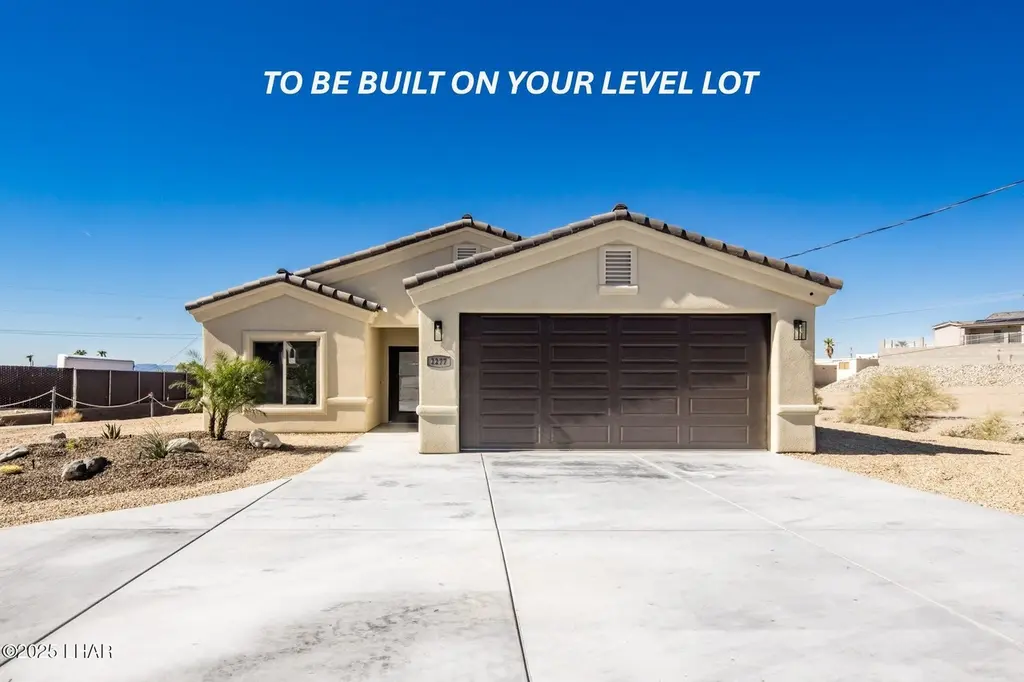
* * NEW HOME ON YOUR LEVEL LOT * * Tired of seeing homes that need full remodels, new windows, new roofs & a/c's? Look no further, this 1664 SQFT New Construction Home to be built on your level lot. Rare 4 bedroom, 2 bathroom, 32 foot deep 2 car garage. All cabinets are soft close, quartz countertops, tile throughout main living areas, carpet in bedrooms, Fireplace entertainment wall, hand textured walls, fully insulated garage, pre-wired for mini split. These houses are very narrow at only 40' wide x 70' deep so there should be plenty of room left for side parking. Stop by 864 Deepwater Drive to check out our models and all our other floor plans Monday-Sunday 10-4.
Key facts
- Quartz countertops
- Level lot
- Hand textured walls
Tags
Neighborhood map
What this means for you Summary
Snapshot
- This is a 4-bed/2.0-bath single-family listed at $329k.
Deal economics
- At list price, monthly cash flow is $-278 ($-3k/yr) — negative.
- To cash-flow at today's rent, offer at most $289k (12.2% below list).
- To meet the 1% rule (rent ≥ 1% of price), the offer needs to be $253k (23.2% below list).
- Recommended offer: $253k (23.2% below list) — sets the bar for 1% rule.
- Cap rate 5.3% vs local median 3.0% in Lake Havasu City — top-decile yield for the area; either an underpriced asset or a hidden risk that comps aren't pricing in. Stress-test before assuming the spread holds.
Location & tenants
- Location reads 63/100 on livability (#124 in AZ) — a middle-class / working-renter tenant base. Strengths: housing A; Watch: health & safety C-, amenities F, commute F.
- Lake Havasu Unified District (4368) (urban): math 39% / reading 41% proficiency, ranked #66 of 249 in AZ (top 26%) — families likely to look elsewhere, expect single-tenant / working-renter base with shorter leases.
- Zoned schools: Havasupai Elementary School (math 41% / reading 45%, grade F, #364 of 1,109 statewide, top 33%, 338 students, 55% FRL); Thunderbolt Middle School (math 27% / reading 34%, grade F, #81 of 218 statewide, top 37%, 851 students, 41% FRL); Lake Havasu High School (math 29% / reading 33%, grade F, #111 of 381 statewide, top 29%, 1,813 students, 31% FRL) — zoned schools at 42% FRL track the district average.
- Market conditions: Rents rising (+3.4%/yr); 393 active listings in the ZIP; 32 comparable units currently listed for rent nearby; rentals lingering (median 46d on market — plan ~5-8 weeks vacancy on turnover, expect pricing pressure); 72% of comp listings sitting > 30 days — soft ceiling on asking rent; 2,543 units permitted in Mohave County in 2024 (33 in 5+ unit buildings).
- At $2,527/mo this rent would consume 51% of the median local household income ($59k/yr) (locally 703% of renters already pay >50% of income on rent) — very limited rent-growth headroom before tenants either downsize or default.
Forward outlook
- Local home prices are declining (-3.0%/yr); year-one equity from $2k of loan paydown is wiped out by about $10k of value loss. Plan a longer hold.
- Mohave County population projected to shrink 6% by 2050 — rents likely to lag national; underwrite the cash flow, not the appreciation.
Negotiation context
- It's been on market 406 days — a 12% lower offer ($290k) is reasonable based on typical stale-listing flexibility.
- 2 sale attempts with the ask held roughly flat each time — persistent listings suggest the price (not the market) is what's stuck; bring a comps-based counter.
Questions for the listing agent
- What do current leases actually rent for vs. the listed asking? Can we see a recent rent roll and the last 12 months of T-12 income?
- It's been on market 406 days. Have you received any prior offers? Is the seller open to a 23% concession, seller financing, or rate buy-down credit?
- Why hasn't it sold? Are there any deal-killer items the seller is aware of (foundation, flood, title, zoning, code violations)?
- Is there a deadline driving the sale (1031 exchange, divorce, estate, relocation)? That informs how much negotiation room exists.
- Schools are B-rated — typically a magnet for longer-tenancy family renters. What's the average tenant stay here, and is there a school-zone premium baked into asking?
- The area grade is low — what's the realistic commute time and amenity access for the typical tenant pool here? Any planned neighborhood developments (good or bad) we should know about?
- What's the average days-on-market for RENTAL listings here right now (not sales)? A rising rental-DOM trend means longer vacancies and softer asking-rent achievability than the comps imply.
- What's the recent tenant-quality profile in this submarket — average credit score on applications, eviction rate, late-payment / NSF rate, and stable-employment percentage? A property-management company in the area should have these aggregated.
- How much new for-sale + rental construction is in the pipeline within 1–3 miles? Heavy new supply typically softens prices + rents 12–24 months out; constrained supply supports both.
Investment metrics
- 1% rule
- 0.77% ✗
- Cap rate
- 5.28%
- Cash-on-cash
- -3.62%
- DSCR
- 0.84
- GRM
- 10.9
CMA / ARV
- ARV (median comp)
- $495,357
- List price
- $329,000
- Delta
- -33.58%
- Verdict
- UNDERPRICED
- Comps
- 20 within 1.0 mi
Show comp detail 12 sales within ~0.75 mi
| Address | Dist | Beds/Ba | Sqft | Sold | Price | $/sf | Match |
|---|---|---|---|---|---|---|---|
| 2260 San Juan Dr | 0.06mi | 3/2.0 (-1) | 1,800 (+6%) | 1mo | $709,000 | $394 | 81 |
| 2435 Havasupai Blvd | 0.39mi | 4/3.0 | 1,674 (-1%) | 1mo | $469,900 | $281 | 76 |
| 2205 Sandwood Dr | 0.32mi | 3/2.0 (-1) | 1,648 (-2%) | 1mo | $450,000 | $273 | 75 |
| 2211 Sandwood Dr | 0.32mi | 3/2.0 (-1) | 1,621 (-4%) | 2mo | $455,000 | $281 | 72 |
| 2230 Runabout Dr | 0.12mi | 3/3.0 (-1) | 1,928 (+14%) | 1mo | $516,000 | $268 | 61 |
| 945 San Juan Ln | 0.25mi | 3/3.0 (-1) | 1,508 (-11%) | 1mo | $485,000 | $322 | 60 |
| 2349 Clarke Dr | 0.57mi | 3/3.0 (-1) | 1,681 (-1%) | 4mo | $405,000 | $241 | 60 |
| 2416 Fannin Dr | 0.63mi | 3/2.0 (-1) | 1,657 (-2%) | 4mo | $534,200 | $322 | 59 |
| 2571 Ascot Dr | 0.74mi | 3/2.0 (-1) | 1,711 (+1%) | 0mo | $625,000 | $365 | 58 |
| 2430 Angler Dr | 0.73mi | 3/2.0 (-1) | 1,772 (+5%) | 2mo | $415,000 | $234 | 52 |
| 2490 Fannin Dr | 0.75mi | 3/2.0 (-1) | 1,784 (+6%) | 2mo | $385,000 | $216 | 49 |
| 2534 Tanglewood Dr | 0.60mi | 3/2.0 (-1) | 1,462 (-14%) | 3mo | $541,500 | $370 | 42 |
Match score weights: distance 35% · size 25% · config 20% · recency 20%. Top-matched comps best support the ARV.
Projected returns pro-forma
-3.0% appreciation · 3.43% rent growth · sell at horizon
- IRR
- -21.9%
- Equity multiple
- 0.24×
- Total profit
- $-69,853
- Equity at exit
- $49,055
- IRR
- -14.7%
- Equity multiple
- 0.14×
- Total profit
- $-78,889
- Equity at exit
- $28,446
Cash invested: $92,120 (down + closing). Projections, not guarantees.
Landlord ↔ Tenant lean methodology
- Overall (STATE)
- 87 Strongly Landlord-Friendly
- State Arizona
- 87 Strongly Landlord-Friendly · R+3
- County
- — inherits STATE
- City
- — inherits STATE
ZIP-level market 86403
- Home prices YoY
- -33.5%
- Rents YoY
- 3.4%
- Active inventory
- 393
- Price-to-rent
- 10.9×
Monthly cashflow live
- Estimated rent
- $2,527 high interval (Pro) →
- Mortgage (P&I)
- −$1,725
- Tax est. 1.5%
- −$411 /mo · $4,935/yr
- Insurance
- −$137
- HOA
- −$0
- Vacancy / Maint / Mgmt
- −$531
- Net cashflow
- $-278
Break-even live
Sensitivity live
| Price | -10% $-50 | -5% $-164 | +0% $-278 | +5% $-391 | +10% $-505 |
|---|---|---|---|---|---|
| Rent | -10% $-477 | -5% $-377 | +0% $-278 | +5% $-178 | +10% $-78 |
| Rate | -1.0pp $-112 | -0.5pp $-194 | base $-278 | +0.5pp $-363 | +1.0pp $-450 |
UW: 25.0% down · 7.5% · 30yr · 1.5% tax · 5.0% vac · 8.0% maint · 8.0% mgmt
Financing live
Cash to close
- Down payment
- $82,250
- Closing costs
- $9,870
- Reserves months
- —
- Total cash needed
- —
Loan-product check · same deal, 3 products live
Conventional
25% down · 7.5% · 30yr
- Down + closing
- —
- Monthly P&I
- —
- Monthly cashflow
- —
- DSCR
- —
- Eligible?
- —
Personal DTI + credit; lowest rate.
DSCR
20% down · 8.5% · 30yr
- Down + closing
- —
- Monthly P&I
- —
- Monthly cashflow
- —
- DSCR
- —
- Eligible?
- —
No personal income docs; deal must DSCR.
Hard money
10% down · 12.0% · 12mo
- Down + closing
- —
- Monthly P&I
- —
- Monthly cashflow
- —
- DSCR
- —
- Eligible?
- —
Short-term bridge; refi at stabilization.
Rent comps 32 comps
| Address | Beds | Baths | Sqft | Rent | $/sqft | DOM | Units | Dist |
|---|---|---|---|---|---|---|---|---|
| 2261 Sahara Dr Lake Havasu City, AZ | 3.0 | 2.0 | 1800 | $3,500 | $1.94 | 45d | 1 | 0.33mi |
| 2524 Ascot Ct Lake Havasu City, AZ | 3.0 | 2.0 | 2195 | $2,600 | $1.18 | 46d | 1 | 0.58mi |
| 2410 Hillview Dr Lake Havasu City, AZ | 3.0 | 2.0 | 2008 | $2,500 | $1.25 | 45d | 1 | 0.60mi |
| 2557 Palisades Dr Lake Havasu City, AZ | 3.0 | 2.0 | 1265 | $1,750 | $1.38 | 23d | 1 | 0.71mi |
| 2271 Rainbow Ave N Lake Havasu City, AZ | 3.0 | 2.0 | 1296 | $2,500 | $1.93 | 45d | 1 | 0.72mi |
| 2620 Havasupai Blvd Lake Havasu City, AZ | 3.0 | 2.0 | 1236 | $1,800 | $1.46 | 45d | 1 | 0.72mi |
| 2449 Angler Dr Lake Havasu City, AZ | 3.0 | 2.0 | 1819 | $3,700 | $2.03 | 45d | 1 | 0.79mi |
| 2010 Bombay Dr Lake Havasu City, AZ | 3.0 | 2.0 | 1406 | $2,500 | $1.78 | 45d | 1 | 0.88mi |
| 1791 Rainbow Ave S Lake Havasu City, AZ | 3.0 | 2.0 | 1613 | $1,750 | $1.08 | 45d | 1 | 0.96mi |
| 2730 Palisades Dr #102 Lake Havasu City, AZ | 3.0 | 2.0 | 1435 | $2,149 | $1.50 | 45d | 1 | 0.96mi |
| 1697 Cardinal Dr Lake Havasu City, AZ | 3.0 | 2.0 | 1695 | $2,195 | $1.29 | 23d | 1 | 1.00mi |
| 388 Coral Dr Lake Havasu City, AZ | 3.0 | 2.5 | 1441 | $2,800 | $1.94 | 15d | 1 | 1.05mi |
| 2775 Papeete Dr Lake Havasu City, AZ | 3.0 | 2.5 | 1848 | $2,200 | $1.19 | 45d | 1 | 1.07mi |
| 1435 Beefeater Dr Lake Havasu City, AZ | 3.0 | 2.0 | 1450 | $2,300 | $1.59 | 23d | 1 | 1.08mi |
| 2265 Malahini Dr Lake Havasu City, AZ | 3.0 | 2.0 | 1437 | $2,300 | $1.60 | 45d | 1 | 1.19mi |
| 2460 Hummingbird Ln Lake Havasu City, AZ | 3.0 | 2.0 | 1349 | $1,900 | $1.41 | 15d | 1 | 1.21mi |
| 1865 Nugget Ct Lake Havasu City, AZ | 4.0 | 3.0 | 2085 | $2,500 | $1.20 | 45d | 1 | 1.22mi |
| 2875 Arabian Dr Lake Havasu City, AZ | 3.0 | 2.5 | 1696 | $2,600 | $1.53 | 23d | 1 | 1.24mi |
| 1815 Palo Verde Blvd S Lake Havasu City, AZ | 3.0 | 2.0 | 1442 | $3,000 | $2.08 | 45d | 1 | 1.32mi |
| 1945 Mimosa Dr Lake Havasu City, AZ | 3.0 | 2.0 | 1524 | $1,795 | $1.18 | 45d | 1 | 1.37mi |
| 1790 Piper Bay Lake Havasu City, AZ | 3.0 | 2.0 | 1550 | $2,800 | $1.81 | 45d | 1 | 1.37mi |
| 1497 Inverness Ct Lake Havasu City, AZ | 3.0 | 2.0 | 1529 | $2,300 | $1.50 | 45d | 1 | 1.37mi |
| 1942 Palo Verde Blvd N Lake Havasu City, AZ | 3.0 | 2.0 | 1623 | $3,500 | $2.16 | 45d | 1 | 1.38mi |
| 2328 Senita Dr Lake Havasu City, AZ | 3.0 | 2.0 | 1495 | $2,400 | $1.61 | 45d | 1 | 1.39mi |
| 212 Coral Dr Lake Havasu City, AZ | 3.0 | 2.0 | 1941 | $3,499 | $1.80 | 45d | 1 | 1.44mi |
| 610 Manzanita Dr Lake Havasu City, AZ | 3.0 | 2.0 | 1693 | $2,500 | $1.48 | 45d | 1 | 1.45mi |
| 2774 Minnow Pl Lake Havasu City, AZ | 3.0 | 2.0 | 1445 | $3,690 | $2.55 | 45d | 1 | 1.45mi |
| 2889 Hidden Valley Dr Lake Havasu City, AZ | 3.0 | 2.0 | 1264 | $2,000 | $1.58 | 15d | 1 | 1.45mi |
| 2270 Senita Dr Lake Havasu City, AZ | 3.0 | 3.0 | 1896 | $3,500 | $1.85 | 45d | 1 | 1.45mi |
| 3030 Winterhaven Dr Unit 102 Lake Havasu City, AZ | 3.0 | 2.0 | 1107 | $1,200 | $1.08 | 15d | 1 | 1.49mi |
| 2715 Shasta Ln Lake Havasu City, AZ | 3.0 | 2.0 | 1319 | $3,000 | $2.27 | 45d | 1 | 1.49mi |
| 3051 Simitan Dr Lake Havasu City, AZ | 3.0 | 3.0 | 1571 | $2,000 | $1.27 | 23d | 1 | 1.50mi |
Listing history 18 events
-
2026-06-21days on market $329,000 Active 406 DOM
-
2026-06-18days on market $329,000 Active 403 DOM
-
2026-06-17days on market $329,000 Active 402 DOM
-
2026-06-16days on market $329,000 Active 401 DOM
-
2026-06-15days on market $329,000 Active 400 DOM
-
2026-06-14days on market $329,000 Active 398 DOM
-
2026-06-13days on market $329,000 Active 397 DOM
-
2026-06-10days on market $329,000 Active 395 DOM
-
2026-06-09days on market $329,000 Active 394 DOM
-
2026-06-08days on market $329,000 Active 393 DOM
-
2026-06-07days on market $329,000 Active 392 DOM
-
2026-06-03days on market $329,000 Active 388 DOM
-
2026-06-02days on market $329,000 Active 387 DOM
-
2026-06-01days on market $329,000 Active 386 DOM
-
2026-05-31days on market $329,000 Active 385 DOM
-
2026-05-30days on market $329,000 Active 384 DOM
-
2026-02-19status Active 683-char remark
Show marketing remark (683 chars)
* * NEW HOME ON YOUR LEVEL LOT * * Tired of seeing homes that need full remodels, new windows, new roofs & a/c's? Look no further, this 1664 SQFT New Construction Home to be built on your level lot. Rare 4 bedroom, 2 bathroom, 32 foot deep 2 car garage. All cabinets are soft close, quartz countertops, tile throughout main living areas, carpet in bedrooms, Fireplace entertainment wall, hand textured walls, fully insulated garage, pre-wired for mini split. These houses are very narrow at only 40' wide x 70' deep so there should be plenty of room left for side parking. Stop by 864 Deepwater Drive to check out our models and all our other floor plans Monday-Sunday 10-4.
-
2025-04-22$329,000 Active 683-char remark
Show marketing remark (683 chars)
* * NEW HOME ON YOUR LEVEL LOT * * Tired of seeing homes that need full remodels, new windows, new roofs & a/c's? Look no further, this 1664 SQFT New Construction Home to be built on your level lot. Rare 4 bedroom, 2 bathroom, 32 foot deep 2 car garage. All cabinets are soft close, quartz countertops, tile throughout main living areas, carpet in bedrooms, Fireplace entertainment wall, hand textured walls, fully insulated garage, pre-wired for mini split. These houses are very narrow at only 40' wide x 70' deep so there should be plenty of room left for side parking. Stop by 864 Deepwater Drive to check out our models and all our other floor plans Monday-Sunday 10-4.
ⓘ Source: listings_history table (triggers on properties + properties_extension) + one-shot
backfill from property_details.listing_events for pre-trigger history.
Nearby sold comps map
Loading sold comps map…
Walkable amenities ~0.75 mi
Loading nearby amenities…
Taxation est. · year 1
- Rental income
- $30,321
- − Mortgage interest
- −$18,429
- − Property taxes
- −$4,935
- − Insurance
- −$1,645
- − Repairs & maintenance
- −$2,426
- − Management
- −$2,426
- − Depreciation
- −$9,571
- Taxable loss
- −$9,111
- Est. tax savings @ 24.0%
- +$2,187
- After-tax cash flow
- $-1,144/yr
For passive investors: Depreciation is non-cash, so a rental often shows a tax loss while cash-flowing — sheltering income. Rental losses are passive: they offset passive income freely, and up to $25,000/yr can offset ordinary (W-2) income if you actively participate and your MAGI is under $100k (phasing out to $0 by $150k); unused losses carry forward. On sale, claimed depreciation is recaptured at up to 25%, and gains may owe capital-gains tax (a 1031 exchange can defer both). Figures are a year-1 estimate at your 24.0% rate — not tax advice; consult a CPA.
Schools (NCES district)
- District
- Lake Havasu Unified District (4368)
- NCES district ID
- 0404280
- Math proficiency
- 39% ▼ -16.00%
- Reading proficiency
- 41% ▼ -8.00%
- Median HH income
- $43,993
- Composite
- 33.92/100
- National rank
- #5339
- State rank
- #66 of 249 in AZ
Livability — Lake Havasu City
- Score
- 63/100
- State rank
- #124
- US rank
- #15839
Category grades
Schools grade is shown separately in the Schools card above.
Census & demographics
- Census place
- Lake Havasu City, AZ
- County
- Mohave County · 181,906 people
- City population
- 62,596
- Metro
- Lake Havasu City-Kingman, AZ
- Population (ZIP)
- 18,295
- Household income
- $58,967
- Rent vs Own
- Severe rent burden
- 703.0
Population outlook (Mohave County) Hauer SSP2
- Today (2025)
- 209,184 people
- By 2030
- 209,674 · +0.2%
- By 2040
- 205,897 · -1.6%
- By 2050
- 196,810 · -5.9%
- By 2075
- 169,454 · -19.0%
- By 2100
- 136,630 · -34.7%
Race, ethnicity, and origin ACS 2023
- Neighborhood character
- Predominantly White (78%)
- Race & ethnicity
- White 78% Hispanic / Latino 19% Two or more races 12%
- Hispanic origin (detail)
- Mexican 15% Puerto Rican 2%
- Common ancestry
- Lithuanian 8% Portuguese 2% Slovak 2%
- Foreign-born
- 6% · Canada
- Languages at home
- 91% English-only · Spanish 8%
Political lean MEDSL · Mohave
- 2024 margin
- Solid R (+55.8) · D 21.8% · R 77.6%
- 2008→2024 swing
- -22.9pp toward R · 2008: -32.9pp · 2024: -55.8pp
- All cycles
- 2024: R+55.8 2020: R+51.3 2016: R+51.5 2012: R+42.6 2008: R+32.9
Not yet ingested
- Civics
- —
Market trends
- HPI YoY
- ▼ -194.25%
- Current HPI
- 384.7996
- Rent YoY
- ▲ 3.43%
- Metro
- Lake Havasu City-Kingman, AZ
- State GDP YoY
- ▲ 4.54%
- F500 in state
- 20
Industry mix (Fortune 500 HQ in AZ)
| Industry | F500 HQs | Revenue |
|---|---|---|
| Technology | 2 | $13B |
|
||
| Mining / Metals | 1 | $23B |
|
||
| Environmental Services | 1 | $16B |
|
||
| Metals / Steel | 1 | $14B |
|
||
| Technology Distribution | 1 | $9B |
|
||
| Homebuilding | 1 | $8B |
|
||
Price history
2 events — show timeline
- 2026-02-19 Relisted — LHAR
- 2025-04-22 Listed $329,000 LHAR
Cash-flow waterfall
monthlySold comps — $/sqft
last 12 mo · ≤1 miLoading sold comps…