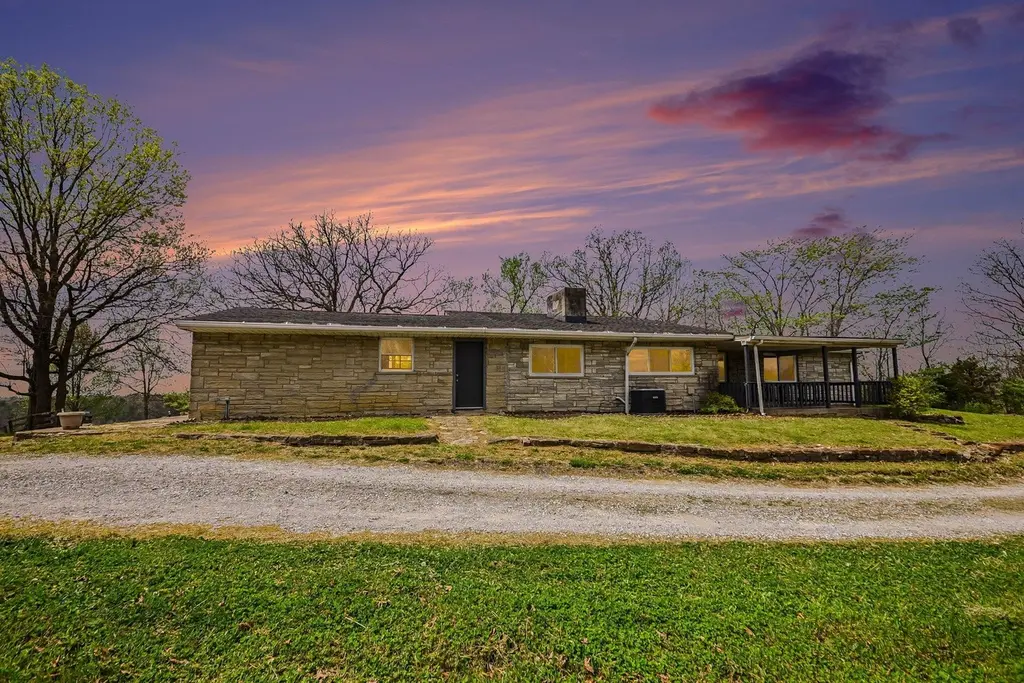
742 Smith Hiteman Rd · Claryville, KY
Flood risk 1/10 · Minimal
- FEMA flood zone
- X (unshaded)
- Chance of flooding over 30 yrs
- 0.0%
- Est. flood insurance / yr
- $507 – $1,088
Fire risk 3/10 · Minor
- Est. fire insurance / yr
- $839 – $1,559
Heat risk 4/10 · Minor
- Hot days now (above 103°F)
- 7 days/yr
- Hot days in 30 yrs
- 19 days/yr
Wind risk 2/10 · Minimal
- Chance of severe wind over 30 yrs
- 1.0%
Air-quality risk 3/10 · Minor
- Unhealthy air days now
- 2 days/yr
- Unhealthy air days in 30 yrs
- 4 days/yr
Risk factors via First Street. Map © Google.
Why this score? — see what drove the C+ grade
The composite is a weighted blend of 9 inputs, each scored 0–100. Each bar is that input's sub-score; the figure is the points it added to the 100-point composite (weight × sub-score).
- Cash flow +25.8/30.0
- DSCR +8.7/10.0
- ARV discount +7.5/15.0
- 1% rule +7.1/10.0
- Schools +4.0/10.0
- Livability +3.2/5.0
- Rent growth +2.5/5.0
- Condition / age +2.5/5.0
- Appreciation +0.0/10.0
$169,900
🖨 Deal sheet (PDF) 📄 Offer letter ✓ Due diligence
Listing remarks
3 Bedroom Ranch Style Home with stone exterior on 1 acre, new carpet & baseboard trim, beautiful new entry doors & first floor laundry. Updated furnace and central air. No VA or FHA loans Cash or conventional loans only. Sold as is.
Key facts
- New carpet
- Baseboard trim
- First floor laundry
Tags
Property features AI
Exterior
- Parking: Driveway; Attached garage (1 car)
- Utilities: Public water; Septic tank; Propane
- Home design: Single-family residence; One level
- Construction: Built in 1962; Stone and vinyl siding exterior; Shingle roof; Block foundation
- Exterior features: Sloped, wooded lot; Irregular lot dimensions
Interior
- Kitchen: Dishwasher; Kitchen (10 x 13)
- Bedrooms: Primary bedroom (10 x 15); Bedroom 2 (11 x 11); Bedroom 3 (10 x 11)
- Bathrooms: 1 full bathroom (primary bath 8 x 8)
- Heating & cooling: Forced air heating; Central air conditioning
- Interior features: Stone wood-burning fireplace; Partial basement
- Laundry & utility: Laundry on main level and in basement
Neighborhood map
What this means for you Summary
Snapshot
- This is a 4-bed/2.5-bath single-family listed at $170k.
Deal economics
- At list price, monthly cash flow is $415 ($5k/yr) — positive.
- The deal already cash-flows at list — no discount required.
- Meets the 1% rule at list price ($2k rent vs $170k).
- Recommended offer: $165k (3.0% below list) — sets the bar for market timing.
- Cap rate 9.2% vs local median 2.8% in Claryville — top-decile yield for the area; either an underpriced asset or a hidden risk that comps aren't pricing in. Stress-test before assuming the spread holds.
Location & tenants
- Location reads 64/100 on livability (#302 in KY) — a middle-class / working-renter tenant base. Strengths: crime A+, employment A+, cost of living A+; Watch: amenities F, commute F, health & safety F.
- Campbell County (suburban): math 43% / reading 47% proficiency, ranked #15 of 165 in KY (top 9%) — families likely to look elsewhere, expect single-tenant / working-renter base with shorter leases.
- Zoned schools: Grant'S Lick Elementary School (math 77% / reading 52%, grade B, #19 of 676 statewide, top 3%, 356 students, 41% FRL); Campbell County Middle School (math 37% / reading 45%, grade F, #54 of 217 statewide, top 25%, 1,184 students, 45% FRL); Campbell County High School (math 35% / reading 43%, grade F, #51 of 254 statewide, top 21%, 1,551 students, 41% FRL).
- Market conditions: 172 active listings in the ZIP; solid renter incomes; 247 units permitted in Campbell County in 2024 (77 in 5+ unit buildings).
Forward outlook
- Local home prices are declining (-3.0%/yr); year-one equity from $1k of loan paydown is wiped out by about $5k of value loss. Plan a longer hold.
Negotiation context
- It's been on market 44 days — a 3% lower offer ($165k) is reasonable based on typical stale-listing flexibility.
- 2 sale attempts; this cycle's ask has dropped $10k (6%) from the opening price — seller is motivated, your offer sets the floor, not the list.
- Current owner paid $55k; list at $170k implies a 208% gain — meaningful room to come down on a strong offer.
Questions for the listing agent
- It's been on market 44 days. Have you received any prior offers? Is the seller open to a 3% concession, seller financing, or rate buy-down credit?
- Built in 1962 — when were the roof, HVAC, electrical panel, plumbing, and water heater last replaced?
- Is there a deadline driving the sale (1031 exchange, divorce, estate, relocation)? That informs how much negotiation room exists.
- Schools are F-rated, which usually means shorter tenancies and higher turnover. Who's the typical renter profile here, and what's been the actual vacancy rate?
- What's the average days-on-market for RENTAL listings here right now (not sales)? A rising rental-DOM trend means longer vacancies and softer asking-rent achievability than the comps imply.
- What's the recent tenant-quality profile in this submarket — average credit score on applications, eviction rate, late-payment / NSF rate, and stable-employment percentage? A property-management company in the area should have these aggregated.
- How much new for-sale + rental construction is in the pipeline within 1–3 miles? Heavy new supply typically softens prices + rents 12–24 months out; constrained supply supports both.
Investment metrics
- 1% rule
- 1.21% ✓
- Cap rate
- 9.22%
- Cash-on-cash
- 10.46%
- DSCR
- 1.47
- GRM
- 6.9
CMA / ARV
- ARV (on-the-fly)
- $381,600
- Comps found
- 4
Show comp detail 4 sales within ~0.75 mi
| Address | Dist | Beds/Ba | Sqft | Sold | Price | $/sf | Match |
|---|---|---|---|---|---|---|---|
| 767 Smith Hiteman Rd | 0.11mi | 3/3.0 (-1) | 1,698 (-6%) | 1mo | $475,000 | $280 | 77 |
| 803 Smith Hiteman Rd | 0.23mi | 3/2.5 (-1) | 1,674 (-7%) | 7mo | $355,000 | $212 | 67 |
| 744 Kenton Station Rd | 0.70mi | 5/2.0 (+1) | 1,796 (-0%) | 9mo | $337,000 | $188 | 53 |
| 750 Kenton Station Rd | 0.68mi | 4/3.0 | 1,612 (-10%) | 16mo | $275,000 | $171 | 35 |
Match score weights: distance 35% · size 25% · config 20% · recency 20%. Top-matched comps best support the ARV.
Projected returns pro-forma
-3.0% appreciation · 3.0% rent growth · sell at horizon
- IRR
- -0.6%
- Equity multiple
- 0.98×
- Total profit
- $-1,061
- Equity at exit
- $25,333
- IRR
- 9.1%
- Equity multiple
- 1.70×
- Total profit
- $33,308
- Equity at exit
- $14,690
Cash invested: $47,572 (down + closing). Projections, not guarantees.
Landlord ↔ Tenant lean methodology
- Overall (STATE)
- 83 Strongly Landlord-Friendly
- State Kentucky
- 83 Strongly Landlord-Friendly · R+16
- County
- — inherits STATE
- City
- — inherits STATE
ZIP-level market 41001
- Active inventory
- 172
- Price-to-rent
- 6.9×
Monthly cashflow live
- Estimated rent
- $2,056 medium interval (Pro) →
- Mortgage (P&I)
- −$891
- Tax from tax record
- −$248 /mo · $2,976/yr
- Insurance
- −$71
- HOA
- −$0
- Vacancy / Maint / Mgmt
- −$432
- Net cashflow
- $415
Break-even live
Sensitivity live
| Price | -10% $511 | -5% $463 | +0% $415 | +5% $367 | +10% $319 |
|---|---|---|---|---|---|
| Rent | -10% $252 | -5% $334 | +0% $415 | +5% $496 | +10% $577 |
| Rate | -1.0pp $500 | -0.5pp $458 | base $415 | +0.5pp $371 | +1.0pp $326 |
UW: 25.0% down · 7.5% · 30yr · 1.5% tax · 5.0% vac · 8.0% maint · 8.0% mgmt
Financing live
Cash to close
- Down payment
- $42,475
- Closing costs
- $5,097
- Reserves months
- —
- Total cash needed
- —
Loan-product check · same deal, 3 products live
Conventional
25% down · 7.5% · 30yr
- Down + closing
- —
- Monthly P&I
- —
- Monthly cashflow
- —
- DSCR
- —
- Eligible?
- —
Personal DTI + credit; lowest rate.
DSCR
20% down · 8.5% · 30yr
- Down + closing
- —
- Monthly P&I
- —
- Monthly cashflow
- —
- DSCR
- —
- Eligible?
- —
No personal income docs; deal must DSCR.
Hard money
10% down · 12.0% · 12mo
- Down + closing
- —
- Monthly P&I
- —
- Monthly cashflow
- —
- DSCR
- —
- Eligible?
- —
Short-term bridge; refi at stabilization.
Listing history 10 events
-
2026-06-21pricestatusdays on market $169,900 Active 44 DOM
-
2026-06-07statusdays on market $179,900 Pending 42 DOM
-
2026-06-03days on market $179,900 Active 40 DOM
-
2026-06-02days on market $179,900 Active 39 DOM
-
2026-06-01days on market $179,900 Active 38 DOM
-
2026-05-31days on market $179,900 Active 37 DOM
-
2026-05-14status Active
-
2026-05-06status Pending
-
2026-04-15$179,900 Active
-
2005-11-28soldstatus $55,172
ⓘ Source: listings_history table (triggers on properties + properties_extension) + one-shot
backfill from property_details.listing_events for pre-trigger history.
Tax reassessment forecast KY · Resets to sale price
- Current annual tax
- $2,976 · $248/mo
- Projected year-2 tax
- $2,976 · $248/mo
- Expected delta
- $0/yr ($0/mo · 0.0%)
ⓘ Screening estimate from a state-policy table — verify with the county assessor before closing.
Climate risk First Street
- Flood 1/10 Low FEMA zone X (unshaded) · 0% chance over 30 yrs
- Wildfire 3/10 Moderate
- Heat 4/10 Moderate 7 d/yr ≥103°F today · 19 d/yr by 30 yrs out
- Wind 2/10 Low 100% chance of damaging wind over 30 yrs
- Air quality 3/10 Moderate 2 unhealthy d/yr today · 4 by 30 yrs out
Nearby sold comps map
Loading sold comps map…
Walkable amenities ~0.75 mi
Loading nearby amenities…
Taxation est. · year 1
- Rental income
- $24,677
- − Mortgage interest
- −$9,517
- − Property taxes
- −$2,976
- − Insurance
- −$850
- − Repairs & maintenance
- −$1,974
- − Management
- −$1,974
- − Depreciation
- −$4,943
- Taxable income
- $2,443
- Est. tax owed @ 24.0%
- −$586
- After-tax cash flow
- $4,391/yr
For passive investors: Depreciation is non-cash, so a rental often shows a tax loss while cash-flowing — sheltering income. Rental losses are passive: they offset passive income freely, and up to $25,000/yr can offset ordinary (W-2) income if you actively participate and your MAGI is under $100k (phasing out to $0 by $150k); unused losses carry forward. On sale, claimed depreciation is recaptured at up to 25%, and gains may owe capital-gains tax (a 1031 exchange can defer both). Figures are a year-1 estimate at your 24.0% rate — not tax advice; consult a CPA.
Schools (NCES district)
- District
- Campbell County
- NCES district ID
- 2100900
- Math proficiency
- 43% ▼ -11.00%
- Reading proficiency
- 47% ▼ -14.00%
- Median HH income
- $62,891
- Composite
- 39.86/100
- National rank
- #3864
- State rank
- #15 of 165 in KY
Livability — Claryville
- Score
- 64/100
- State rank
- #302
- US rank
- #14455
Category grades
Schools grade is shown separately in the Schools card above.
Census & demographics
- County
- Campbell County · 84,793 people
- City population
- 19,206
- Metro
- Cincinnati, OH-KY-IN
- Population (ZIP)
- 19,323
- Household income
- $102,447
- Rent vs Own
- Severe rent burden
- 129.0
Population outlook (Campbell County) Hauer SSP2
- Today (2025)
- 95,668 people
- By 2030
- 96,886 · +1.3%
- By 2040
- 97,734 · +2.2%
- By 2050
- 96,413 · +0.8%
- By 2075
- 90,211 · -5.7%
- By 2100
- 79,434 · -17.0%
Race, ethnicity, and origin ACS 2023
- Neighborhood character
- Predominantly White (93%)
- Race & ethnicity
- White 93% Two or more races 3% Hispanic / Latino 2% Asian 2% Black 1%
- Common ancestry
- Slovak 4% Lithuanian 2% Italian 2%
- Foreign-born
- 2%
- Languages at home
- 97% English-only · Other Indo-European 1% Other Asian/Pacific 1% Spanish 0%
Political lean MEDSL · Campbell
- 2024 margin
- R (+19.7) · D 39.2% · R 58.9% · Other 1.9%
- 2008→2024 swing
- +1.2pp toward D · 2008: -20.9pp · 2024: -19.7pp
- All cycles
- 2024: R+19.7 2020: R+18.6 2016: R+24.5 2012: R+22.8 2008: R+20.9
Not yet ingested
- Civics
- —
Market trends
- HPI YoY
- ▼ -120.32%
- Current HPI
- 189.7464
- Rent YoY
- —
- Metro
- Cincinnati, OH-KY-IN
- State GDP YoY
- ▲ 1.81%
- F500 in state
- 4
Industry mix (Fortune 500 HQ in KY)
| Industry | F500 HQs | Revenue |
|---|---|---|
| Healthcare | 1 | $118B |
|
||
| Food / Beverage | 1 | $7B |
|
||
Price history
+226.1% since first listed4 events — show timeline
- 2026-05-14 Relisted — NKMLS
- 2026-05-06 Pending — NKMLS
- 2026-04-15 Listed $179,900 NKMLS
- 2005-11-28 Sold (Public Records) $55,172 Public Records
Property tax history
+3.5%/yrLatest (2025): $2,976 · +21.5% YoY. Source: county tax records.
Cash-flow waterfall
monthlySold comps — $/sqft
last 12 mo · ≤1 miLoading sold comps…