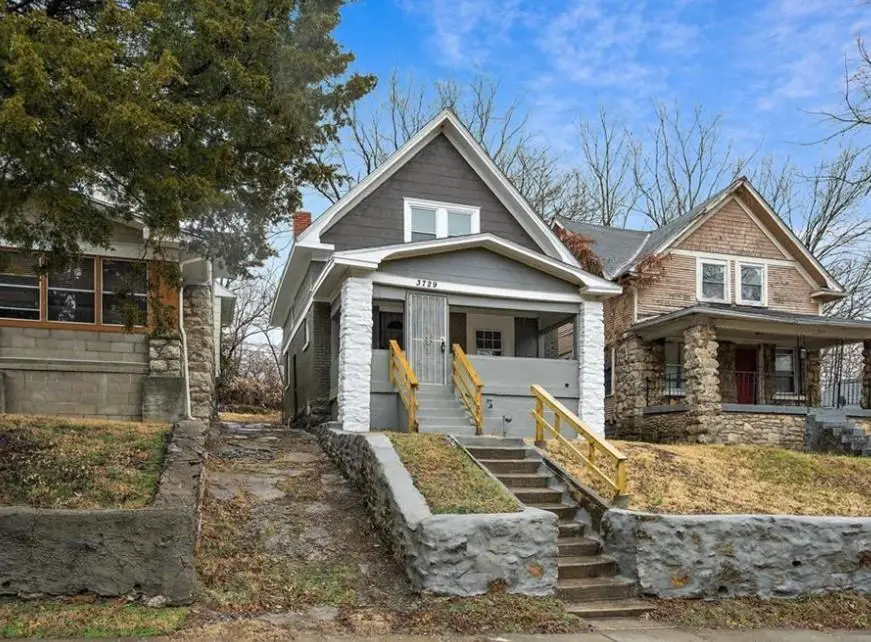
3729 Olive St · Kansas City, MO
Flood risk 1/10 · Minimal
- FEMA flood zone
- X (unshaded)
- Chance of flooding over 30 yrs
- 0.0%
- Est. flood insurance / yr
- $473 – $860
Fire risk 1/10 · Minimal
- Est. fire insurance / yr
- $1,054 – $1,958
Heat risk 4/10 · Minor
- Hot days now (above 107°F)
- 7 days/yr
- Hot days in 30 yrs
- 16 days/yr
Wind risk 2/10 · Minimal
- Chance of severe wind over 30 yrs
- —
Air-quality risk 3/10 · Minor
- Unhealthy air days now
- 2 days/yr
- Unhealthy air days in 30 yrs
- 3 days/yr
Risk factors via First Street. Map © Google.
Why this score? — see what drove the C+ grade
The composite is a weighted blend of 9 inputs, each scored 0–100. Each bar is that input's sub-score; the figure is the points it added to the 100-point composite (weight × sub-score).
- Cash flow +30.0/30.0
- DSCR +10.0/10.0
- 1% rule +7.8/10.0
- Rent growth +4.9/5.0
- ARV discount +4.5/15.0
- Livability +3.9/5.0
- Condition / age +2.5/5.0
- Schools +1.5/10.0
- Appreciation +0.0/10.0
$105,000
🖨 Deal sheet (PDF) 📄 Offer letter ✓ Due diligence
Listing remarks MLS
If you’ve been looking for an opportunity in a location with strong access to Downtown Kansas City, the Plaza, and major highways—this property is one to consider. This 3-bedroom home offers a functional layout and sits in an area where continued investment and redevelopment are taking place, making it a potential fit for the right buyer with vision. The property has been utilized as a rental over the past several years and has a consistent rental history, previously generating approximately $1,400 per month with HUD approval in place. The home will require updates, including interior finishes such as paint, and is priced accordingly to reflect the condition. This presents an opportunity for an investor or buyer looking to renovate and build equity over time. From the exterior, the home features a covered front porch and elevated position, adding to its traditional Kansas City character. If you’re looking for a property you can improve, reposition, or add to your portfolio—this is one worth reviewing.
Key facts
- 3,927 sq ft lot
- Built 1909
- Listed 72 days
Neighborhood map
What this means for you Summary
Snapshot
- This is a 3-bed/1.0-bath single-family listed at $105k.
Deal economics
- At list price, monthly cash flow is $421 ($5k/yr) — positive.
- The deal already cash-flows at list — no discount required.
- Meets the 1% rule at list price ($1k rent vs $105k).
- Recommended offer: $99k (6.0% below list) — sets the bar for market timing.
- Cap rate 11.1% vs local median 3.9% in Kansas City — top-decile yield for the area; either an underpriced asset or a hidden risk that comps aren't pricing in. Stress-test before assuming the spread holds.
Location & tenants
- Location reads 78/100 on livability (#28 in MO, #2,671 nationally) — a middle-class / working-renter tenant base. Strengths: amenities A+, commute A+, cost of living A+; Watch: crime F.
- Kansas City 33 (urban): math 12% / reading 24% proficiency, ranked #308 of 324 in MO (top 95%) — low school quality limits family demand, transient renter base, plan for 1-2y turnover; 75% free/reduced lunch — lower-income household profile, screen leases tightly.
- Zoned schools: M. L. King Elementary (math 2% / reading 8%, grade F, #1,072 of 1,115 statewide, top 98%, 665 students, 100% FRL); Central Middle School (math 0% / reading 9%, grade F, #388 of 391 statewide, top 99%, 428 students, 99% FRL); Southeast High School (math 2% / reading 12%, grade F, #512 of 521 statewide, top 99%, 487 students, 99% FRL) — zoned schools average 99% FRL vs 75% district-wide (24 pts higher); higher-poverty schools than district average — tighter screening recommended.
- Zoned-school proficiency averages 6% at this address vs 18% district-wide (-12 pts) — the specific schools serving this property underperform the Kansas City 33 average; the district grade overstates school quality for this exact location.
- Market conditions: Rents rising fast (+9.5%/yr); 98 active listings in the ZIP; 40 comparable units currently listed for rent nearby; rentals at typical pace (median 26d on market — plan ~3-4 weeks tenant-placement turnaround); lower-income renter base — watch delinquency; 4,002 units permitted in Jackson County in 2024 (2,271 in 5+ unit buildings).
- This rent runs 38% of the median local income ($42k/yr) — at the standard rent-burdened threshold; future hikes will face affordability resistance.
Forward outlook
- Local home prices are declining (-3.0%/yr); year-one equity from $726 of loan paydown is wiped out by about $3k of value loss. Plan a longer hold.
- Jackson County population projected at +4% by 2050 — modest demand growth; plan on rents tracking national, not racing it.
- At projected returns (-3.0% appreciation + 8.0% rent growth), your $29k cash investment doubles in ~6 years — after that, you're playing with house money.
Negotiation context
- It's been on market 73 days — a 6% lower offer ($99k) is reasonable based on typical stale-listing flexibility.
- 9 sale attempts since 19y ago; this cycle's ask has dropped $10k (9%) from the opening price — seller is motivated, your offer sets the floor, not the list.
Risks & watch-outs
- Watch-outs: built in 1909 — expect roof / HVAC / electrical / plumbing capex.
Questions for the listing agent
- It's been on market 73 days. Have you received any prior offers? Is the seller open to a 6% concession, seller financing, or rate buy-down credit?
- Built in 1909 — when were the roof, HVAC, electrical panel, plumbing, and water heater last replaced?
- Why hasn't it sold? Are there any deal-killer items the seller is aware of (foundation, flood, title, zoning, code violations)?
- Is there a deadline driving the sale (1031 exchange, divorce, estate, relocation)? That informs how much negotiation room exists.
- Crime grade is F in this area — have there been break-ins, vandalism, or insurance claims at this property in the last 3 years? What carrier currently insures it and at what premium?
- What's the average days-on-market for RENTAL listings here right now (not sales)? A rising rental-DOM trend means longer vacancies and softer asking-rent achievability than the comps imply.
- What's the recent tenant-quality profile in this submarket — average credit score on applications, eviction rate, late-payment / NSF rate, and stable-employment percentage? A property-management company in the area should have these aggregated.
- How much new for-sale + rental construction is in the pipeline within 1–3 miles? Heavy new supply typically softens prices + rents 12–24 months out; constrained supply supports both.
Investment metrics
- 1% rule
- 1.28% ✓
- Cap rate
- 11.11%
- Cash-on-cash
- 17.19%
- DSCR
- 1.76
- GRM
- 6.5
CMA / ARV
- ARV (median comp)
- $98,358
- List price
- $105,000
- Delta
- 6.75%
- Verdict
- FAIR
- Comps
- 20 within 1.0 mi
Show comp detail 12 sales within ~0.75 mi
| Address | Dist | Beds/Ba | Sqft | Sold | Price | $/sf | Match |
|---|---|---|---|---|---|---|---|
| 3838 S Benton Ave | 0.33mi | 3/1.0 | 1,066 (+4%) | 3mo | $90,000 | $84 | 76 |
| 3915 Brooklyn Ave | 0.26mi | 2/1.0 (-1) | 1,020 (-1%) | 8mo | $45,000 | $44 | 76 |
| 3711 Bellefontaine Ave | 0.43mi | 3/1.0 | 1,007 (-2%) | 5mo | $120,000 | $119 | 73 |
| 3936 Wabash Ave | 0.30mi | 3/2.0 | 1,099 (+7%) | 2mo | $89,900 | $82 | 69 |
| 3536 College Ave | 0.57mi | 3/1.0 | 1,086 (+6%) | 6mo | $96,000 | $88 | 58 |
| 3335 Park Ave | 0.47mi | 2/1.0 (-1) | 1,115 (+9%) | 4mo | $115,000 | $103 | 55 |
| 6208 Willow Ave | 0.45mi | 3/2.0 | 1,104 (+8%) | 9mo | $129,900 | $118 | 54 |
| 2303 E 41st St E | 0.46mi | 2/1.0 (-1) | 918 (-10%) | 4mo | $80,000 | $87 | 53 |
| 3920 S Benton Ave | 0.37mi | 2/1.5 (-1) | 1,160 (+13%) | 5mo | $65,000 | $56 | 50 |
| 4128 Agnes Ave | 0.62mi | 2/1.0 (-1) | 1,098 (+7%) | 7mo | $42,000 | $38 | 49 |
| 3637 Indiana Ave | 0.62mi | 3/1.0 | 1,147 (+12%) | 9mo | $100,000 | $87 | 44 |
| 3904 Bales Ave | 0.68mi | 3/1.0 | 1,152 (+12%) | 10mo | $120,000 | $104 | 40 |
Match score weights: distance 35% · size 25% · config 20% · recency 20%. Top-matched comps best support the ARV.
Projected returns pro-forma
-3.0% appreciation · 8.0% rent growth · sell at horizon
- IRR
- 13.6%
- Equity multiple
- 1.57×
- Total profit
- $16,859
- Equity at exit
- $15,656
- IRR
- 25.8%
- Equity multiple
- 3.77×
- Total profit
- $81,334
- Equity at exit
- $9,078
Cash invested: $29,400 (down + closing). Projections, not guarantees.
Landlord ↔ Tenant lean methodology
- Overall (STATE)
- 81 Strongly Landlord-Friendly
- State Missouri
- 81 Strongly Landlord-Friendly · R+10
- County
- — inherits STATE
- City
- — inherits STATE
ZIP-level market 64109
- Rents YoY
- 9.5%
- Active inventory
- 98
- Price-to-rent
- 6.5×
Monthly cashflow live
- Estimated rent
- $1,341 high interval (Pro) →
- Mortgage (P&I)
- −$551
- Tax from tax record
- −$44 /mo · $527/yr
- Insurance
- −$44
- HOA
- −$0
- Vacancy / Maint / Mgmt
- −$282
- Net cashflow
- $421
Break-even live
Sensitivity live
| Price | -10% $481 | -5% $451 | +0% $421 | +5% $391 | +10% $362 |
|---|---|---|---|---|---|
| Rent | -10% $315 | -5% $368 | +0% $421 | +5% $474 | +10% $527 |
| Rate | -1.0pp $474 | -0.5pp $448 | base $421 | +0.5pp $394 | +1.0pp $366 |
UW: 25.0% down · 7.5% · 30yr · 1.5% tax · 5.0% vac · 8.0% maint · 8.0% mgmt
Financing live
Cash to close
- Down payment
- $26,250
- Closing costs
- $3,150
- Reserves months
- —
- Total cash needed
- —
Loan-product check · same deal, 3 products live
Conventional
25% down · 7.5% · 30yr
- Down + closing
- —
- Monthly P&I
- —
- Monthly cashflow
- —
- DSCR
- —
- Eligible?
- —
Personal DTI + credit; lowest rate.
DSCR
20% down · 8.5% · 30yr
- Down + closing
- —
- Monthly P&I
- —
- Monthly cashflow
- —
- DSCR
- —
- Eligible?
- —
No personal income docs; deal must DSCR.
Hard money
10% down · 12.0% · 12mo
- Down + closing
- —
- Monthly P&I
- —
- Monthly cashflow
- —
- DSCR
- —
- Eligible?
- —
Short-term bridge; refi at stabilization.
Rent comps 40 comps
| Address | Beds | Baths | Sqft | Rent | $/sqft | DOM | Units | Dist |
|---|---|---|---|---|---|---|---|---|
| 3710 Wabash Ave Unit 2S Kansas City, MO | 2.0 | 1.0 | 875 | $850 | $0.97 | 25d | 1 | 0.08mi |
| 3841 Olive St Kansas City, MO | 2.0 | 1.0 | 792 | $985 | $1.24 | 16d | 1 | 0.15mi |
| 3902 Wabash Ave Kansas City, MO | 4.0 | 2.0 | 1400 | $1,850 | $1.32 | 46d | 1 | 0.19mi |
| 3604 Park Ave Kansas City, MO | 3.0 | 1.5 | 1320 | $1,550 | $1.17 | 0d | 1 | 0.22mi |
| 3817 S Benton Ave Kansas City, MO | 4.0 | 1.5 | 1380 | $1,650 | $1.20 | 25d | 1 | 0.30mi |
| 3630 Agnes Ave Kansas City, MO | 3.0 | 2.0 | 1448 | $1,500 | $1.04 | 12d | 1 | 0.33mi |
| 4014 Park Ave Kansas City, MO | 3.0 | 2.0 | 1271 | $1,273 | $1.00 | 46d | 1 | 0.35mi |
| 3840 Bellefontaine Ave Kansas City, MO | 3.0 | 1.0 | 1500 | $1,500 | $1.00 | 18d | 1 | 0.41mi |
| 2002 E 35th St Kansas City, MO | 3.0 | 2.0 | 1426 | $1,250 | $0.88 | 0d | 1 | 0.44mi |
| 3417 Brooklyn Ave Kansas City, MO | 3.0 | 1.5 | 945 | $1,595 | $1.69 | 0d | 1 | 0.44mi |
| 2305 E 41st St Kansas City, MO | 2.0 | 1.0 | 750 | $1,000 | $1.33 | 9d | 1 | 0.44mi |
| 4107 Olive St Kansas City, MO | 3.0 | 1.5 | 1271 | $1,578 | $1.24 | 9d | 1 | 0.44mi |
| 3524 Bellefontaine Ave Kansas City, MO | 3.0 | 1.0 | 1228 | $1,350 | $1.10 | 46d | 1 | 0.45mi |
| 3609 Wayne Ave Kansas City, MO | 3.0 | 1.5 | 1118 | $1,900 | $1.70 | 25d | 1 | 0.55mi |
| 3346 Agnes Ave Kansas City, MO | 3.0 | 1.0 | 1400 | $1,200 | $0.86 | 9d | 1 | 0.55mi |
| 3818 Indiana Ave Kansas City, MO | 3.0 | 1.5 | 1223 | $1,147 | $0.94 | 46d | 1 | 0.57mi |
| 3330 Agnes Ave Kansas City, MO | 3.0 | 1.0 | 1000 | $1,410 | $1.41 | 46d | 1 | 0.59mi |
| 4116 Bellefontaine Ave Kansas City, MO | 3.0 | 1.0 | 1234 | $1,000 | $0.81 | 25d | 1 | 0.60mi |
| 3233 Park Ave Unit 1 Kansas City, MO | 2.0 | 1.0 | 950 | $1,075 | $1.13 | 46d | 1 | 0.60mi |
| 3233 Park Ave Unit 2 Kansas City, MO | 2.0 | 1.0 | 950 | $1,000 | $1.05 | 25d | 1 | 0.60mi |
| 3304 Agnes Ave Unit Downstairs Kansas City, MO | 3.0 | 1.0 | 1150 | $1,095 | $0.95 | 46d | 1 | 0.64mi |
| 3739 Bales Ave Kansas City, MO | 3.0 | 2.0 | 1400 | $1,575 | $1.12 | 25d | 1 | 0.65mi |
| 4005 Bales Ave Kansas City, MO | 2.0 | 1.0 | 792 | $1,050 | $1.33 | 46d | 1 | 0.73mi |
| 4144 College Ave Kansas City, MO | 3.0 | 1.0 | 1108 | $1,095 | $0.99 | 25d | 1 | 0.73mi |
| 3310 College Ave Kansas City, MO | 3.0 | 1.0 | 874 | $995 | $1.14 | 46d | 1 | 0.74mi |
| 2120 Linwood Blvd Kansas City, MO | 3.0 | 1.0 | 1326 | $1,400 | $1.06 | 46d | 1 | 0.74mi |
| 4209 Flora Ave Kansas City, MO | 2.0 | 1.0 | 778 | $1,200 | $1.54 | 18d | 1 | 0.82mi |
| 3713 Cleveland Ave Kansas City, MO | 4.0 | 1.0 | 1256 | $1,250 | $1.00 | 18d | 1 | 0.84mi |
| 3310 Askew Ave Kansas City, MO | 3.0 | 2.0 | 1484 | $1,500 | $1.01 | 0d | 1 | 0.87mi |
| 4309 College Ave Kansas City, MO | 3.0 | 2.0 | 1040 | $1,550 | $1.49 | 18d | 1 | 0.88mi |
| 3305 Askew Ave Kansas City, MO | 3.0 | 1.5 | 1428 | $1,450 | $1.02 | 25d | 1 | 0.91mi |
| 4427 Agnes Ave Kansas City, MO | 3.0 | 1.0 | 1100 | $1,350 | $1.23 | 18d | 1 | 0.93mi |
| 3300 Virginia Ave Unit 2S Kansas City, MO | 2.0 | 1.0 | 900 | $1,000 | $1.11 | 46d | 1 | 0.94mi |
| 1111 E Armour Blvd Kansas City, MO | 2.0 | 1.0–2.0 | 812 | $1,660 | $2.04 | 46d | 9 | 0.94mi |
| 1111 E Armour Blvd Kansas City, MO | 2.0 | 1.0–2.0 | 788 | $1,660 | $2.11 | 4d | 9 | 0.94mi |
| 3009 Garfield Ave Kansas City, MO | 3.0 | 1.5 | 1334 | $1,425 | $1.07 | 46d | 1 | 0.95mi |
| 4117 Forest Ave Kansas City, MO | 2.0 | 2.0 | 1300 | $1,390 | $1.07 | 25d | 1 | 0.95mi |
| 1108 E Armour Blvd Kansas City, MO | 2.0 | 1.0–2.0 | 780 | $1,745 | $2.24 | 46d | 5 | 0.95mi |
| 1108 E Armour Blvd Kansas City, MO | 2.0 | 1.0–2.0 | 773 | $1,745 | $2.26 | 4d | 11 | 0.95mi |
| 4119 Forest Ave Kansas City, MO | 2.0 | 1.0 | 950 | $1,400 | $1.47 | 14d | 1 | 0.96mi |
Listing history 47 events
-
2026-06-21days on market $105,000 Active 73 DOM
-
2026-06-18days on market $105,000 Active 70 DOM
-
2026-06-17days on market $105,000 Active 69 DOM
-
2026-06-16days on market $105,000 Active 68 DOM
-
2026-06-15days on market $105,000 Active 67 DOM
-
2026-06-13days on market $105,000 Active 65 DOM
-
2026-06-09days on market $105,000 Active 61 DOM
-
2026-06-08days on market $105,000 Active 60 DOM
-
2026-06-07days on market $105,000 Active 59 DOM
-
2026-06-05days on market $105,000 Active 56 DOM
-
2026-06-03days on market $105,000 Active 55 DOM
-
2026-06-02days on market $105,000 Active 54 DOM
-
2026-06-01days on market $105,000 Active 53 DOM
-
2026-05-31days on market $105,000 Active 52 DOM
-
2026-04-24price $105,000 1040-char remark
Show marketing remark (1040 chars)
If you’ve been looking for an opportunity in a location with strong access to Downtown Kansas City, the Plaza, and major highways—this property is one to consider. This 3-bedroom home offers a functional layout and sits in an area where continued investment and redevelopment are taking place, making it a potential fit for the right buyer with vision. The property has been utilized as a rental over the past several years and has a consistent rental history, previously generating approximately $1,400 per month with HUD approval in place. The home will require updates, including interior finishes such as paint, and is priced accordingly to reflect the condition. This presents an opportunity for an investor or buyer looking to renovate and build equity over time. From the exterior, the home features a covered front porch and elevated position, adding to its traditional Kansas City character. If you’re looking for a property you can improve, reposition, or add to your portfolio—this is one worth reviewing.
-
2026-04-10$114,900 Active 1040-char remark
Show marketing remark (1040 chars)
If you’ve been looking for an opportunity in a location with strong access to Downtown Kansas City, the Plaza, and major highways—this property is one to consider. This 3-bedroom home offers a functional layout and sits in an area where continued investment and redevelopment are taking place, making it a potential fit for the right buyer with vision. The property has been utilized as a rental over the past several years and has a consistent rental history, previously generating approximately $1,400 per month with HUD approval in place. The home will require updates, including interior finishes such as paint, and is priced accordingly to reflect the condition. This presents an opportunity for an investor or buyer looking to renovate and build equity over time. From the exterior, the home features a covered front porch and elevated position, adding to its traditional Kansas City character. If you’re looking for a property you can improve, reposition, or add to your portfolio—this is one worth reviewing.
-
2026-04-06historical $114,900 1040-char remark
Show marketing remark (1040 chars)
If you’ve been looking for an opportunity in a location with strong access to Downtown Kansas City, the Plaza, and major highways—this property is one to consider. This 3-bedroom home offers a functional layout and sits in an area where continued investment and redevelopment are taking place, making it a potential fit for the right buyer with vision. The property has been utilized as a rental over the past several years and has a consistent rental history, previously generating approximately $1,400 per month with HUD approval in place. The home will require updates, including interior finishes such as paint, and is priced accordingly to reflect the condition. This presents an opportunity for an investor or buyer looking to renovate and build equity over time. From the exterior, the home features a covered front porch and elevated position, adding to its traditional Kansas City character. If you’re looking for a property you can improve, reposition, or add to your portfolio—this is one worth reviewing.
-
2024-01-20historical $1,397
-
2023-12-19price $1,397
-
2023-12-01price $1,225
-
2023-11-02price $1,250
-
2023-10-21$1,295
-
2023-10-13historical $1,295
-
2023-08-29price $1,295
-
2023-07-19price $1,375
-
2023-05-31historical
-
2023-03-28price $137,000
-
2023-02-02price $140,000
-
2022-11-07$145,000 Active
-
2022-07-07soldstatus Closed
-
2022-06-10historical Active Under Contract
-
2022-06-06$79,900 Active
-
2021-07-02soldstatus Closed
-
2021-04-20status Pending
-
2021-04-18status Active
-
2021-04-14status Pending
-
2021-04-07status Active
-
2020-12-10status Pending
-
2020-12-09$50,000 Active
-
2015-10-28soldstatus
-
2009-06-01historical
-
2009-04-24soldstatus
-
2009-02-03$32,000
-
2008-03-13soldstatus
-
2007-11-29$9,900
-
2003-04-07soldstatus
-
1982-07-01soldstatus
ⓘ Source: listings_history table (triggers on properties + properties_extension) + one-shot
backfill from property_details.listing_events for pre-trigger history.
Tax reassessment forecast MO · Resets to sale price
- Current annual tax
- $527 · $44/mo
- Projected year-2 tax
- $1,018 · $85/mo
- Expected delta
- +$492/yr (+$41/mo · 93.3%)
ⓘ Screening estimate from a state-policy table — verify with the county assessor before closing.
Climate risk First Street
- Flood 1/10 Low FEMA zone X (unshaded) · 0% chance over 30 yrs
- Wildfire 1/10 Low
- Heat 4/10 Moderate 7 d/yr ≥107°F today · 16 d/yr by 30 yrs out
- Wind 2/10 Low
- Air quality 3/10 Moderate 2 unhealthy d/yr today · 3 by 30 yrs out
Nearby sold comps map
Loading sold comps map…
Walkable amenities ~0.75 mi
Loading nearby amenities…
Taxation est. · year 1
- Rental income
- $16,092
- − Mortgage interest
- −$5,882
- − Property taxes
- −$527
- − Insurance
- −$525
- − Repairs & maintenance
- −$1,287
- − Management
- −$1,287
- − Depreciation
- −$3,055
- Taxable income
- $3,529
- Est. tax owed @ 24.0%
- −$847
- After-tax cash flow
- $4,206/yr
For passive investors: Depreciation is non-cash, so a rental often shows a tax loss while cash-flowing — sheltering income. Rental losses are passive: they offset passive income freely, and up to $25,000/yr can offset ordinary (W-2) income if you actively participate and your MAGI is under $100k (phasing out to $0 by $150k); unused losses carry forward. On sale, claimed depreciation is recaptured at up to 25%, and gains may owe capital-gains tax (a 1031 exchange can defer both). Figures are a year-1 estimate at your 24.0% rate — not tax advice; consult a CPA.
Schools (NCES district)
- District
- Kansas City 33
- NCES district ID
- 2916400
- Math proficiency
- 12% ▼ -8.00%
- Reading proficiency
- 24% ▬ 0.00%
- Median HH income
- $35,227
- Composite
- 14.8/100
- National rank
- #9387
- State rank
- #308 of 324 in MO
Livability — Kansas City
- Score
- 78/100
- State rank
- #28
- US rank
- #2671
Category grades
Schools grade is shown separately in the Schools card above.
Census & demographics
- Census place
- Kansas City, MO
- County
- Jackson County · 687,798 people
- City population
- 439,467
- Metro
- Kansas City, MO-KS
- Population (ZIP)
- 10,043
- Household income
- $41,943
- Rent vs Own
- Severe rent burden
- 853.0
Population outlook (Jackson County) Hauer SSP2
- Today (2025)
- 719,589 people
- By 2030
- 731,456 · +1.6%
- By 2040
- 746,689 · +3.8%
- By 2050
- 749,289 · +4.1%
- By 2075
- 736,227 · +2.3%
- By 2100
- 668,210 · -7.1%
Race, ethnicity, and origin ACS 2023
- Neighborhood character
- Diverse neighborhood (Simpson 0.64)
- Race & ethnicity
- Black 45% White 39% Hispanic / Latino 9% Two or more races 4% Asian 2%
- Hispanic origin (detail)
- Mexican 7%
- Common ancestry
- Slovak 1% Romanian 1% Lithuanian 1%
- Foreign-born
- 7% · Canada, Philippines, China
- Languages at home
- 88% English-only · Spanish 5% Other Asian/Pacific 3% Arabic 1%
Political lean MEDSL · Jackson
- 2024 margin
- D (+19.3) · D 58.9% · R 39.5% · Other 1.6%
- 2008→2024 swing
- -6.1pp toward R · 2008: 25.4pp · 2024: 19.3pp
- All cycles
- 2024: D+19.3 2020: D+22.0 2016: D+16.6 2012: D+19.0 2008: D+25.4
Not yet ingested
- Civics
- —
Market trends
- HPI YoY
- ▼ -275.12%
- Current HPI
- 243.6094
- Rent YoY
- ▲ 9.50%
- Metro
- Kansas City, MO-KS
- State GDP YoY
- ▲ 1.84%
- F500 in state
- 20
Industry mix (Fortune 500 HQ in MO)
| Industry | F500 HQs | Revenue |
|---|---|---|
| Healthcare | 1 | $163B |
|
||
| Insurance | 1 | $21B |
|
||
| Industrial Technology | 1 | $17B |
|
||
| Retail | 1 | $16B |
|
||
| Industrial Distribution | 1 | $10B |
|
||
| Utilities | 1 | $9B |
|
||
Price history
+960.6% since first listed33 events — show timeline
- 2026-04-24 Price Changed $105,000 Heartland MLS as Distributed by MLS Grid
- 2026-04-10 Listed $114,900 Heartland MLS as Distributed by MLS Grid
- 2026-04-06 Coming Soon $114,900 Heartland MLS as Distributed by MLS Grid
- 2024-01-20 Rental Removed $1,397 APPFOLIO
- 2023-12-19 Price Changed $1,397 APPFOLIO
- 2023-12-01 Price Changed $1,225 APPFOLIO
- 2023-11-02 Price Changed $1,250 APPFOLIO
- 2023-10-21 Listed for Rent $1,295 APPFOLIO
- 2023-10-13 Rental Removed $1,295 APPFOLIO
- 2023-08-29 Price Changed $1,295 APPFOLIO
- 2023-07-19 Price Changed $1,375 APPFOLIO
- 2023-05-31 Listing Removed — Heartland MLS as Distributed by MLS Grid
- 2023-03-28 Price Changed $137,000 Heartland MLS as Distributed by MLS Grid
- 2023-02-02 Price Changed $140,000 Heartland MLS as Distributed by MLS Grid
- 2022-11-07 Listed $145,000 Heartland MLS as Distributed by MLS Grid
- 2022-07-07 Sold (MLS) — Heartland MLS as Distributed by MLS Grid
- 2022-06-10 Contingent — Heartland MLS as Distributed by MLS Grid
- 2022-06-06 Listed $79,900 Heartland MLS as Distributed by MLS Grid
- 2021-07-02 Sold (MLS) — Heartland MLS as Distributed by MLS Grid
- 2021-04-20 Pending — Heartland MLS as Distributed by MLS Grid
- 2021-04-18 Relisted — Heartland MLS as Distributed by MLS Grid
- 2021-04-14 Pending — Heartland MLS as Distributed by MLS Grid
- 2021-04-07 Relisted — Heartland MLS as Distributed by MLS Grid
- 2020-12-10 Pending — Heartland MLS as Distributed by MLS Grid
- 2020-12-09 Listed $50,000 Heartland MLS as Distributed by MLS Grid
- 2015-10-28 Sold (Public Records) — Public Records
- 2009-06-01 Listing Removed — Heartland MLS as Distributed by MLS Grid
- 2009-04-24 Sold (Public Records) — Public Records
- 2009-02-03 Listed $32,000 Heartland MLS as Distributed by MLS Grid
- 2008-03-13 Sold (MLS) — Heartland MLS as Distributed by MLS Grid
- 2007-11-29 Listed $9,900 Heartland MLS as Distributed by MLS Grid
- 2003-04-07 Sold (Public Records) — Public Records
- 1982-07-01 Sold (Public Records) — Public Records
Property tax history
+8.6%/yrLatest (2025): $527 · -49.2% YoY. Source: county tax records.
Cash-flow waterfall
monthlySold comps — $/sqft
last 12 mo · ≤1 miLoading sold comps…