144 Twins Trl · Hutto, TX
Flood risk No data
- FEMA flood zone
- —
- Chance of flooding over 30 yrs
- —
- Est. flood insurance / yr
- —
Fire risk No data
- Est. fire insurance / yr
- —
Heat risk No data
- Hot days now (above threshold)
- —
- Hot days in 30 yrs
- —
Wind risk No data
- Chance of severe wind over 30 yrs
- —
Air-quality risk No data
- Unhealthy air days now
- —
- Unhealthy air days in 30 yrs
- —
Risk factors via First Street. Map © Google.
Why this score? — see what drove the D- grade
The composite is a weighted blend of 9 inputs, each scored 0–100. Each bar is that input's sub-score; the figure is the points it added to the 100-point composite (weight × sub-score).
- ARV discount +13.8/15.0
- Cash flow +9.5/30.0
- Livability +3.9/5.0
- Schools +3.3/10.0
- DSCR +2.7/10.0
- Condition / age +2.5/5.0
- 1% rule +2.2/10.0
- Rent growth +1.9/5.0
- Appreciation +0.0/10.0
$278,999
🖨 Deal sheet (PDF) 📄 Offer letter ✓ Due diligence
Listing remarks
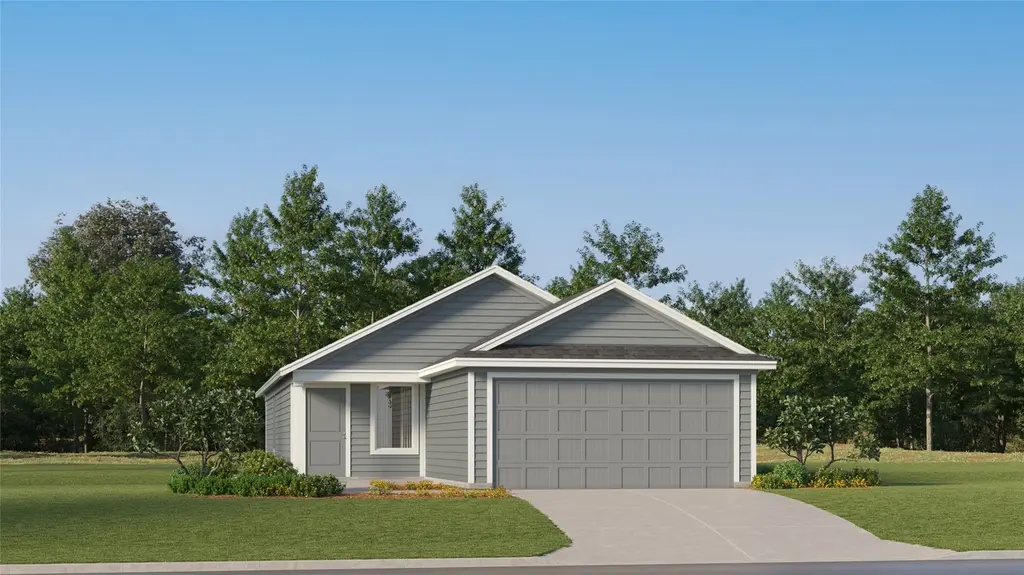
The Kitson - This single-level home showcases a spacious open floorplan shared between the kitchen, dining area and family room for easy entertaining during gatherings. An owner’s suite enjoys a private location in a rear corner of the home, complemented by an en-suite bathroom and walk-in closet. There are two secondary bedrooms along the side of the home, which are comfortable spaces for household members and overnight guests. Photos are for illustrative purposes only. Estimated Completion August 2026. The completion date, prices and features may vary and are subject to change. Please verify with Lennar directly.
Key facts
- Walk-in closet
- Open floorplan
- Secondary bedrooms
Tags
Property features AI
Finance
- HOA & community: Homeowners association (Winfield Park HOA), $68 monthly covering common area maintenance; Community playground and sport court(s)
Exterior
- Parking: Attached garage with 2 covered parking spaces (2 total)
- Utilities: Electricity available; Public water connected; Public sewer connected
- Home design: Single-story; New construction by Lennar; Faces northwest; Slab foundation
- Construction: Built by builder (new construction); Brick and cement siding with HardiPlank-type siding; Composition roof
- Exterior features: Private yard; Front porch; Back yard; Front yard; Interior lot; Privacy wood fencing; Community pool
Interior
- Kitchen: Dishwasher; Range
- Bedrooms: 3 main-level bedrooms
- Flooring: Carpet; Vinyl
- Bathrooms: 2 full bathrooms
- Heating & cooling: Central heating; Central air conditioning
- Interior features: Kitchen island; Open floor plan; Walk-in closet(s)
- Laundry & utility: Laundry inside on the main level
Neighborhood map
What this means for you Summary
Snapshot
- This is a 3-bed/2.0-bath other listed at $279k.
Deal economics
- At list price, monthly cash flow is $-193 ($-2k/yr) — negative.
- To cash-flow at today's rent, offer at most $245k (12.2% below list).
- To meet the 1% rule (rent ≥ 1% of price), the offer needs to be $200k (28.4% below list).
- Recommended offer: $200k (28.4% below list) — sets the bar for 1% rule.
- Cap rate 5.5% vs local median 3.6% in Hutto — top-decile yield for the area; either an underpriced asset or a hidden risk that comps aren't pricing in. Stress-test before assuming the spread holds.
Location & tenants
- Location reads 77/100 on livability (#79 in TX, #2,794 nationally) — a middle-class / working-renter tenant base. Strengths: crime A+, housing A+, health & safety A+; Watch: amenities C-, commute F.
- Hutto ISD (rural): math 30% / reading 42% proficiency, ranked #438 of 826 in TX (top 53%) — families likely to look elsewhere, expect single-tenant / working-renter base with shorter leases.
- Zoned schools: Hutto El (math 33% / reading 45%, grade F, #1,651 of 4,322 statewide, top 39%, 744 students, 36% FRL); Hutto H S (math 35% / reading 54%, grade F, #652 of 1,632 statewide, top 43%, 2,010 students, 40% FRL) — zoned schools at 38% FRL track the district average.
- Market conditions: Rents soft (-2.4%/yr); 1039 active listings in the ZIP; 26 comparable units currently listed for rent nearby; rentals at typical pace (median 24d on market — plan ~3-4 weeks tenant-placement turnaround); high-income renter base; 7,543 units permitted in Williamson County in 2024 (1,425 in 5+ unit buildings).
Forward outlook
- Local home prices are declining (-3.0%/yr); year-one equity from $2k of loan paydown is wiped out by about $8k of value loss. Plan a longer hold.
- Williamson County population projected at +69% by 2050 — long-run rental-demand tailwind backs the buy-and-hold thesis.
Negotiation context
- It's been on market 30 days — a 2% lower offer ($275k) is reasonable based on typical stale-listing flexibility.
Questions for the listing agent
- What do current leases actually rent for vs. the listed asking? Can we see a recent rent roll and the last 12 months of T-12 income?
- What does the HOA fee cover, when was the last increase, and are there any pending special assessments or reserve-fund shortfalls?
- Is there a deadline driving the sale (1031 exchange, divorce, estate, relocation)? That informs how much negotiation room exists.
- The area grade is low — what's the realistic commute time and amenity access for the typical tenant pool here? Any planned neighborhood developments (good or bad) we should know about?
- What's the average days-on-market for RENTAL listings here right now (not sales)? A rising rental-DOM trend means longer vacancies and softer asking-rent achievability than the comps imply.
- What's the recent tenant-quality profile in this submarket — average credit score on applications, eviction rate, late-payment / NSF rate, and stable-employment percentage? A property-management company in the area should have these aggregated.
- How much new for-sale + rental construction is in the pipeline within 1–3 miles? Heavy new supply typically softens prices + rents 12–24 months out; constrained supply supports both.
Investment metrics
- 1% rule
- 0.72% ✗
- Cap rate
- 5.46%
- Cash-on-cash
- -2.97%
- DSCR
- 0.87
- GRM
- 11.6
CMA / ARV
- ARV (median comp)
- $324,397
- List price
- $278,999
- Delta
- -13.99%
- Verdict
- UNDERPRICED
- Comps
- 20 within 1.0 mi
Projected returns pro-forma
-3.0% appreciation · 0.0% rent growth · sell at horizon
- IRR
- -24.4%
- Equity multiple
- 0.19×
- Total profit
- $-63,424
- Equity at exit
- $41,600
- IRR
- -30.3%
- Equity multiple
- -0.20×
- Total profit
- $-93,945
- Equity at exit
- $24,123
Cash invested: $78,120 (down + closing). Projections, not guarantees.
Landlord ↔ Tenant lean methodology
- Overall (STATE)
- 87 Strongly Landlord-Friendly
- State Texas
- 87 Strongly Landlord-Friendly · R+5
- County
- — inherits STATE
- City
- — inherits STATE
ZIP-level market 78634
- Rents YoY
- -2.4%
- Active inventory
- 1039
- Price-to-rent
- 11.6×
Monthly cashflow live
- Estimated rent
- $1,996 high interval (Pro) →
- Mortgage (P&I)
- −$1,463
- Tax from tax record
- −$123 /mo · $1,475/yr
- Insurance
- −$116
- HOA
- −$68
- Vacancy / Maint / Mgmt
- −$419
- Net cashflow
- $-193
Break-even live
Sensitivity live
| Price | -10% $-35 | -5% $-114 | +0% $-193 | +5% $-272 | +10% $-351 |
|---|---|---|---|---|---|
| Rent | -10% $-351 | -5% $-272 | +0% $-193 | +5% $-114 | +10% $-35 |
| Rate | -1.0pp $-53 | -0.5pp $-122 | base $-193 | +0.5pp $-265 | +1.0pp $-339 |
UW: 25.0% down · 7.5% · 30yr · 1.5% tax · 5.0% vac · 8.0% maint · 8.0% mgmt
Financing live
Cash to close
- Down payment
- $69,750
- Closing costs
- $8,370
- Reserves months
- —
- Total cash needed
- —
Loan-product check · same deal, 3 products live
Conventional
25% down · 7.5% · 30yr
- Down + closing
- —
- Monthly P&I
- —
- Monthly cashflow
- —
- DSCR
- —
- Eligible?
- —
Personal DTI + credit; lowest rate.
DSCR
20% down · 8.5% · 30yr
- Down + closing
- —
- Monthly P&I
- —
- Monthly cashflow
- —
- DSCR
- —
- Eligible?
- —
No personal income docs; deal must DSCR.
Hard money
10% down · 12.0% · 12mo
- Down + closing
- —
- Monthly P&I
- —
- Monthly cashflow
- —
- DSCR
- —
- Eligible?
- —
Short-term bridge; refi at stabilization.
Rent comps 26 comps
| Address | Beds | Baths | Sqft | Rent | $/sqft | DOM | Units | Dist |
|---|---|---|---|---|---|---|---|---|
| 202 Quail Cir Hutto, TX | 3.0 | 2.0 | 1434 | $1,700 | $1.19 | 23d | 1 | 0.60mi |
| 1015 Bluejack Way Hutto, TX | 3.0 | 2.0 | 1767 | $2,475 | $1.40 | 6d | 1 | 0.62mi |
| 741 Carol Dr Hutto, TX | 3.0 | 2.0 | 1819 | $2,150 | $1.18 | 45d | 1 | 0.63mi |
| 201 Quail Cir Hutto, TX | 3.0 | 2.0 | 1422 | $1,950 | $1.37 | 45d | 1 | 0.63mi |
| 741 Carol Dr Hutto, TX | 3.0 | 2.0 | 1819 | $2,150 | $1.18 | 19d | 1 | 0.63mi |
| 1001 Bluejack Way Hutto, TX | 4.0 | 2.0 | 1622 | $2,045 | $1.26 | 6d | 1 | 0.63mi |
| 117 Colthorpe Ln Hutto, TX | 3.0 | 2.0 | 1735 | $1,950 | $1.12 | 46d | 1 | 0.96mi |
| 401 County Road 199 Hutto, TX | 1.0–3.0 | 1.0–2.5 | 1013 | $2,443 | $2.41 | 0d | 65 | 1.10mi |
| 132 Canley Loop Hutto, TX | 3.0 | 2.0 | 1279 | $4,800 | $3.75 | 19d | 1 | 1.18mi |
| 112 Creekside Dr Hutto, TX | 3.0 | 2.5 | 1352 | $1,875 | $1.39 | 19d | 1 | 1.20mi |
| 1051 N Farm to Market 1660 Unit 03-1102 Hutto, TX | 2.0 | 2.0 | 1100 | $1,449 | $1.32 | 25d | 1 | 1.23mi |
| 108 Greenspire Ln Hutto, TX | 3.0 | 2.0 | 1853 | $2,100 | $1.13 | 45d | 1 | 1.31mi |
| 208 Skyfire ST Hutto, TX | 4.0 | 2.0 | 1600 | $1,995 | $1.25 | 45d | 1 | 1.31mi |
| 208 Skyfire ST Hutto, TX | 4.0 | 2.0 | 1600 | $1,995 | $1.25 | 25d | 1 | 1.31mi |
| 1051 N Farm to Market 1660 Unit B1 Hutto, TX | 2.0 | 2.0 | 1100 | $1,295 | $1.18 | 45d | 1 | 1.33mi |
| 1051 N Farm to Market 1660 Unit 116 Hutto, TX | 2.0 | 2.0 | 1100 | $1,375 | $1.25 | 45d | 1 | 1.33mi |
| 1051 FM 1660 Hutto, TX | 2.0 | 2.0 | 1100 | $1,495 | $1.36 | 19d | 1 | 1.33mi |
| 318 Canley Loop Hutto, TX | 3.0 | 2.0 | 1430 | $1,900 | $1.33 | 6d | 1 | 1.34mi |
| 126 Fairmeadow Downs Dr Hutto, TX | 4.0 | 2.0 | 1607 | $1,995 | $1.24 | 45d | 1 | 1.39mi |
| 203 E Pecan St Unit B Hutto, TX | 3.0 | 2.0 | 1688 | $1,900 | $1.13 | 16d | 1 | 1.40mi |
| 318 Durango Downs Dr Hutto, TX | 3.0 | 2.0 | 1311 | $1,850 | $1.41 | 45d | 1 | 1.41mi |
| 235 Sweetwater Creek Ln Hutto, TX | 3.0 | 2.0 | 1472 | $1,850 | $1.26 | 19d | 1 | 1.42mi |
| 124 Carrington St Hutto, TX | 3.0 | 2.0 | 1742 | $1,965 | $1.13 | 6d | 1 | 1.43mi |
| 607 Water Way Ave Hutto, TX | 4.0 | 2.0 | 1830 | $2,045 | $1.12 | 19d | 1 | 1.44mi |
| 231 Sweetwater Creek Ln Hutto, TX | 4.0 | 2.0 | 1839 | $2,290 | $1.25 | 19d | 1 | 1.45mi |
| 207 Coventry Dr Hutto, TX | 4.0 | 2.0 | 1622 | $1,950 | $1.20 | 45d | 1 | 1.45mi |
HOA detail
- Monthly dues
- $68 · $816/yr
Listing history 11 events
-
2026-06-13statusdays on market $278,999 Pending 30 DOM
-
2026-06-09pricedays on market $278,999 Active 29 DOM
-
2026-06-08days on market $283,999 Active 28 DOM
-
2026-06-07days on market $283,999 Active 27 DOM
-
2026-06-04days on market $283,999 Active 24 DOM
-
2026-06-03days on market $283,999 Active 23 DOM
-
2026-06-02days on market $283,999 Active 22 DOM
-
2026-06-01days on market $283,999 Active 21 DOM
-
2026-05-31days on market $283,999 Active 20 DOM
-
2026-05-12price $287,999 628-char remark
-
2026-05-11$295,999 Active 628-char remark
ⓘ Source: listings_history table (triggers on properties + properties_extension) + one-shot
backfill from property_details.listing_events for pre-trigger history.
Tax reassessment forecast TX · Resets to sale price
- Current annual tax
- $1,475 · $123/mo
- Projected year-2 tax
- $5,106 · $425/mo
- Expected delta
- +$3,631/yr (+$303/mo · 246.2%)
ⓘ Screening estimate from a state-policy table — verify with the county assessor before closing.
Nearby sold comps map
Loading sold comps map…
Walkable amenities ~0.75 mi
Loading nearby amenities…
Taxation est. · year 1
- Rental income
- $23,957
- − Mortgage interest
- −$15,628
- − Property taxes
- −$1,475
- − Insurance
- −$1,395
- − Repairs & maintenance
- −$1,917
- − Management
- −$1,917
- − HOA
- −$816
- − Depreciation
- −$8,116
- Taxable loss
- −$7,306
- Est. tax savings @ 24.0%
- +$1,754
- After-tax cash flow
- $-563/yr
For passive investors: Depreciation is non-cash, so a rental often shows a tax loss while cash-flowing — sheltering income. Rental losses are passive: they offset passive income freely, and up to $25,000/yr can offset ordinary (W-2) income if you actively participate and your MAGI is under $100k (phasing out to $0 by $150k); unused losses carry forward. On sale, claimed depreciation is recaptured at up to 25%, and gains may owe capital-gains tax (a 1031 exchange can defer both). Figures are a year-1 estimate at your 24.0% rate — not tax advice; consult a CPA.
Schools (NCES district)
- District
- Hutto ISD
- NCES district ID
- 4824100
- Math proficiency
- 30% ▼ -17.00%
- Reading proficiency
- 42% ▼ -5.00%
- Median HH income
- $72,961
- Composite
- 33.33/100
- National rank
- #5501
- State rank
- #438 of 826 in TX
Livability — Hutto
- Score
- 77/100
- State rank
- #79
- US rank
- #2794
Category grades
Schools grade is shown separately in the Schools card above.
Census & demographics
- County
- Williamson County · 680,029 people
- City population
- 46,413
- Metro
- Austin-Round Rock-Georgetown, TX
- Population (ZIP)
- 46,413
- Household income
- $114,426
- Rent vs Own
- Severe rent burden
- 410.0
Population outlook (Williamson County) Hauer SSP2
- Today (2025)
- 699,027 people
- By 2030
- 795,537 · +13.8%
- By 2040
- 990,683 · +41.7%
- By 2050
- 1,184,292 · +69.4%
- By 2075
- 1,623,825 · +132.3%
- By 2100
- 1,924,153 · +175.3%
Race, ethnicity, and origin ACS 2023
- Neighborhood character
- Diverse neighborhood (Simpson 0.62)
- Race & ethnicity
- White 50% Hispanic / Latino 35% Two or more races 18% Black 9% Asian 2%
- Hispanic origin (detail)
- Mexican 26% Puerto Rican 1%
- Common ancestry
- Slovak 2% Italian 2% Lithuanian 2%
- Foreign-born
- 13% · Canada
- Languages at home
- 71% English-only · Spanish 23% Other Indo-European 2% Arabic 1%
Political lean MEDSL · Williamson
- 2024 margin
- Toss-up / Even · D 48.0% · R 50.4% · Other 1.6%
- 2008→2024 swing
- +10.6pp toward D · 2008: -13.0pp · 2024: -2.5pp
- All cycles
- 2024: R+2.5 2020: D+1.4 2016: R+9.9 2012: R+21.5 2008: R+13.0
Not yet ingested
- Civics
- —
Market trends
- HPI YoY
- ▼ -106.56%
- Current HPI
- 194.2221
- Rent YoY
- ▼ -2.41%
- Metro
- Austin-Round Rock-Georgetown, TX
- State GDP YoY
- ▲ 3.95%
- F500 in state
- 110
Industry mix (Fortune 500 HQ in TX)
| Industry | F500 HQs | Revenue |
|---|---|---|
| Energy | 16 | $1,198B |
|
||
| Technology | 5 | $198B |
|
||
| Engineering / Construction | 4 | $72B |
|
||
| Energy Services | 3 | $60B |
|
||
| Utilities | 3 | $41B |
|
||
| Healthcare | 2 | $330B |
|
||
Price history
-5.7% since first listed6 events — show timeline
- 2026-06-11 Pending — Unlock MLS
- 2026-06-08 Price Changed $278,999 Unlock MLS
- 2026-05-28 Price Changed $283,999 Unlock MLS
- 2026-05-20 Price Changed $286,999 Unlock MLS
- 2026-05-12 Price Changed $287,999 Unlock MLS
- 2026-05-11 Listed $295,999 Unlock MLS
Property tax history
-9.8%/yrLatest (2026): $1,475 · -9.8% YoY. Source: county tax records.
Cash-flow waterfall
monthlySold comps — $/sqft
last 12 mo · ≤1 miLoading sold comps…