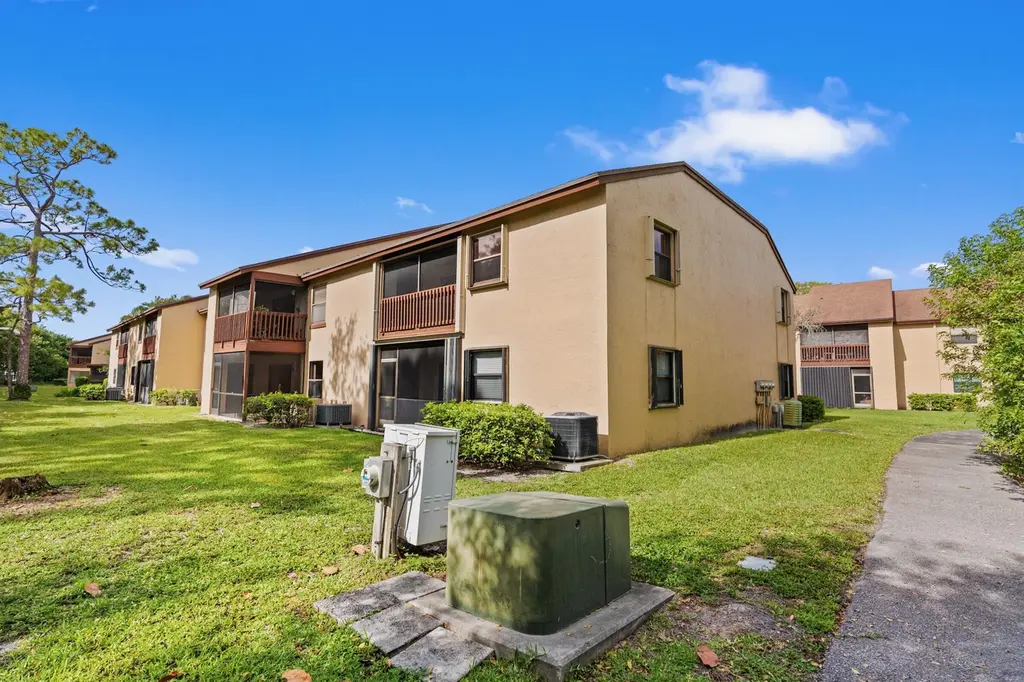
402 Lakeview Dr E · Royal Palm Beach, FL
Flood risk 1/10 · Minimal
- FEMA flood zone
- X (unshaded)
- Chance of flooding over 30 yrs
- 0.0%
- Est. flood insurance / yr
- $507 – $1,088
Fire risk 3/10 · Minor
- Est. fire insurance / yr
- $947 – $1,759
Heat risk 10/10 · Severe
- Hot days now (above 107°F)
- 7 days/yr
- Hot days in 30 yrs
- 26 days/yr
Wind risk 10/10 · Severe
- Chance of severe wind over 30 yrs
- 99.0%
Air-quality risk 2/10 · Minimal
- Unhealthy air days now
- 0 days/yr
- Unhealthy air days in 30 yrs
- 1 days/yr
Risk factors via First Street. Map © Google.
Why this score? — see what drove the C- grade
The composite is a weighted blend of 9 inputs, each scored 0–100. Each bar is that input's sub-score; the figure is the points it added to the 100-point composite (weight × sub-score).
- Cash flow +10.7/30.0
- Appreciation +10.0/10.0
- ARV discount +7.5/15.0
- 1% rule +6.1/10.0
- Schools +4.3/10.0
- Livability +4.0/5.0
- DSCR +3.1/10.0
- Rent growth +2.7/5.0
- Condition / age +2.5/5.0
$204,900
🖨 Deal sheet 📄 Offer letter ✓ Due diligence
Listing remarks
Welcome to this beautifully maintained condo offering comfort, space, and serene views! This bright and airy unit features a dining area with high ceilings, creating a spacious feel perfect for both relaxing and entertaining. Natural light pours in through large windows, highlighting the modern finishes and inviting layout. The kitchen is well-appointed with ample cabinet space and a functional design, making meal prep a breeze. Bedrooms are generously sized, with the primary suite offering a peaceful retreat and plenty of storage. Bathrooms are clean and well-kept with updated fixtures. Step outside to your private screened-in balcony and enjoy tranquil views of lush greenery—perfect
Key facts
- Large windows
- Dining area
- Ample cabinet space
Tags
Property features AI
Finance
- Other: Pets not allowed
- HOA & community: Homeowners association present; Monthly HOA fee of $407; HOA fee includes water; Association amenities listed as other
Exterior
- Parking: No carport; No designated parking total listed
- Utilities: Public water; Public sewer; Electricity connected
- Home design: Condominium; Resale; 2 stories total; Faces east
- Construction: CBS construction
- Exterior features: Not waterfront; Other roof type
Interior
- Kitchen: Dishwasher; Electric range; Microwave; Refrigerator
- Bedrooms: 2 bedrooms on the main level
- Flooring: Other flooring
- Bathrooms: 2 full bathrooms (both on the main level)
- Heating & cooling: Electric heating; Central air conditioning; Ceiling fan(s)
- Interior features: Electric water heater; Ceiling fans
- Laundry & utility: Washer/dryer hookup (utility information not explicitly listed but common with listed appliances)
Neighborhood map
What this means for you Summary
Snapshot
- This is a 2-bed/2.0-bath condo listed at $205k.
Deal economics
- At list price, monthly cash flow is $-98 ($-1k/yr) — negative.
- To cash-flow at today's rent, offer at most $188k (8.5% below list).
- Meets the 1% rule at list price ($2k rent vs $205k).
- Recommended offer: $188k (8.5% below list) — sets the bar for cash-flow.
Location & tenants
- Location reads 79/100 on livability (#135 in FL, #2,039 nationally) — a middle-class / working-renter tenant base. Strengths: employment A+, housing A+, health & safety A+; Watch: cost of living C-, amenities F, commute F.
- Palm Beach (suburban): math 46% / reading 53% proficiency, ranked #34 of 73 in FL (top 47%) — families likely to look elsewhere, expect single-tenant / working-renter base with shorter leases.
- Zoned schools: Royal Palm Beach Elementary School (math 58% / reading 62%, grade B-, #680 of 2,144 statewide, top 32%, 662 students, 40% FRL); Crestwood Community Middle (math 49% / reading 52%, grade C, #246 of 571 statewide, top 44%, 724 students, 50% FRL); Royal Palm Beach High School (math 22% / reading 38%, grade F, #441 of 667 statewide, top 67%, 2,343 students, 57% FRL) — zoned schools at 49% FRL track the district average.
- Market conditions: Rents flat; 574 active listings in the ZIP; 40 comparable units currently listed for rent nearby; rentals at typical pace (median 22d on market — plan ~3-4 weeks tenant-placement turnaround); solid renter incomes; 3,974 units permitted in Palm Beach County in 2024 (1,012 in 5+ unit buildings).
Forward outlook
- In year one you build about $22k of equity ($1k loan paydown + $20k appreciation (10.0% local appreciation)).
- Palm Beach County population projected at +30% by 2050 — long-run rental-demand tailwind backs the buy-and-hold thesis.
- By year 2, paydown + projected appreciation supports a ~$35k cash-out refi (75% LTV) — recoverable capital for the next deal without selling this one.
Negotiation context
- It's been on market 21 days — a 2% lower offer ($202k) is reasonable based on typical stale-listing flexibility.
- 9 sale attempts since 27y ago with the ask held roughly flat each time — persistent listings suggest the price (not the market) is what's stuck; bring a comps-based counter.
- Current owner paid $137k; 50% above their basis — modest negotiation headroom, anchor on the comps not their cost.
Risks & watch-outs
- Climate carrying-cost: severe wind risk, 99% chance of damaging wind over 30y; extreme-heat days projected 7→26/yr by 2055 (HVAC capex compounding) — expect insurance premiums to compound above CPI over the hold.
Questions for the listing agent
- What do current leases actually rent for vs. the listed asking? Can we see a recent rent roll and the last 12 months of T-12 income?
- What does the HOA fee cover, when was the last increase, and are there any pending special assessments or reserve-fund shortfalls?
- Any open or pending special assessments — roof, HVAC, plumbing, elevator, façade? What's the per-unit balance and payoff schedule, and is the seller paying it off at close or rolling it to the buyer?
- Is there a deadline driving the sale (1031 exchange, divorce, estate, relocation)? That informs how much negotiation room exists.
- Schools are B-rated — typically a magnet for longer-tenancy family renters. What's the average tenant stay here, and is there a school-zone premium baked into asking?
- What's the average days-on-market for RENTAL listings here right now (not sales)? A rising rental-DOM trend means longer vacancies and softer asking-rent achievability than the comps imply.
- What's the recent tenant-quality profile in this submarket — average credit score on applications, eviction rate, late-payment / NSF rate, and stable-employment percentage? A property-management company in the area should have these aggregated.
- How much new apartment / multifamily construction is in the pipeline within 1–3 miles? Heavy new supply (>2% of stock underway) typically softens rents 12–24 months out; light construction supports rent growth.
Investment metrics
- 1% rule
- 1.11% ✓
- Cap rate
- 5.72%
- Cash-on-cash
- -2.06%
- DSCR
- 0.91
- GRM
- 7.5
CMA / ARV
No comps found within radius.
Projected returns pro-forma
10.0% appreciation · 0.85% rent growth · sell at horizon
- IRR
- 22.0%
- Equity multiple
- 2.76×
- Total profit
- $100,827
- Equity at exit
- $184,590
- IRR
- 19.2%
- Equity multiple
- 6.12×
- Total profit
- $293,532
- Equity at exit
- $398,076
Cash invested: $57,372 (down + closing). Projections, not guarantees.
Landlord ↔ Tenant lean methodology
- Overall (STATE)
- 87 Strongly Landlord-Friendly
- State Florida
- 87 Strongly Landlord-Friendly · R+3
- County
- — inherits STATE
- City
- — inherits STATE
ZIP-level market 33411
- Home prices YoY
- 1.9%
- Rents YoY
- 0.8%
- Active inventory
- 574
- Price-to-rent
- 7.5×
Monthly cashflow live
- Estimated rent
- $2,283 high interval (Pro) →
- Mortgage (P&I)
- −$1,075
- Tax from tax record
- −$335 /mo · $4,024/yr
- Insurance
- −$85
- HOA
- −$407
- Vacancy / Maint / Mgmt
- −$480
- Net cashflow
- $-98
Break-even live
UW: 25.0% down · 7.5% · 30yr · 1.5% tax · 5.0% vac · 8.0% maint · 8.0% mgmt
Financing live
Cash to close
- Down payment
- $51,225
- Closing costs
- $6,147
- Reserves months
- —
- Total cash needed
- —
Loan-product check · same deal, 3 products live
Conventional
25% down · 7.5% · 30yr
- Down + closing
- —
- Monthly P&I
- —
- Monthly cashflow
- —
- DSCR
- —
- Eligible?
- —
Personal DTI + credit; lowest rate.
DSCR
20% down · 8.5% · 30yr
- Down + closing
- —
- Monthly P&I
- —
- Monthly cashflow
- —
- DSCR
- —
- Eligible?
- —
No personal income docs; deal must DSCR.
Hard money
10% down · 12.0% · 12mo
- Down + closing
- —
- Monthly P&I
- —
- Monthly cashflow
- —
- DSCR
- —
- Eligible?
- —
Short-term bridge; refi at stabilization.
Rent comps 40 comps
| Address | Beds | Baths | Sqft | Rent | $/sqft | DOM | Units | Dist |
|---|---|---|---|---|---|---|---|---|
| 1407 Lakeview Dr E Royal Palm Beach, FL | 2.0 | 2.0 | 1165 | $2,300 | $1.97 | 8d | 1 | 0.15mi |
| 1601 Lakeview Dr W Unit 1601 Royal Palm Beach, FL | 3.0 | 2.5 | 1296 | $2,375 | $1.83 | 22d | 1 | 0.16mi |
| 182 Sparrow Dr Unit A Royal Palm Beach, FL | 3.0 | 2.0 | 1485 | $3,000 | $2.02 | 24d | 1 | 0.23mi |
| 1803 Palm Beach Trace Dr Royal Palm Beach, FL | 2.0 | 2.0 | 1201 | $2,000 | $1.67 | 19d | 1 | 0.30mi |
| 202 Sparrow Dr #1 Royal Palm Beach, FL | 3.0 | 2.0 | 1020 | $2,400 | $2.35 | 24d | 1 | 0.31mi |
| 210 Sparrow Dr #4 Royal Palm Beach, FL | 2.0 | 2.0 | 930 | $1,900 | $2.04 | 21d | 1 | 0.32mi |
| 1605 Palm Beach Trace Dr Royal Palm Beach, FL | 2.0 | 2.0 | 1201 | $2,100 | $1.75 | 13d | 1 | 0.32mi |
| 145 Prestige Dr Royal Palm Beach, FL | 3.0 | 2.0 | 1464 | $2,900 | $1.98 | 17d | 1 | 0.33mi |
| 905 Palm Beach Trace Dr Royal Palm Beach, FL | 1.0 | 2.0 | 1201 | $1,700 | $1.42 | 24d | 1 | 0.35mi |
| 139 Sparrow Dr Royal Palm Beach, FL | 2.0–3.0 | 1.5–2.5 | 1100 | $1,850 | $1.68 | 15d | 3 | 0.42mi |
| 180 Heatherwood Dr Royal Palm Beach, FL | 3.0 | 2.0 | 1462 | $2,710 | $1.85 | 5d | 1 | 0.48mi |
| 43 Essex Ct Unit A Royal Palm Beach, FL | 2.0 | 2.5 | 1398 | $2,500 | $1.79 | 24d | 1 | 0.58mi |
| 120 Sparrow Dr Royal Palm Beach, FL | 2.0 | 2.0–2.5 | 793 | $2,200 | $2.77 | 22d | 2 | 0.59mi |
| 120 Sparrow Dr #205 Royal Palm Beach, FL | 2.0 | 2.0 | 793 | $2,200 | $2.77 | 24d | 1 | 0.59mi |
| 216 Cordoba Cir Royal Palm Beach, FL | 3.0 | 2.0 | 1461 | $3,080 | $2.11 | 8d | 1 | 0.62mi |
| 36 Danbury Ct Unit B Royal Palm Beach, FL | 2.0 | 2.5 | 1398 | $2,300 | $1.65 | 11d | 1 | 0.64mi |
| 110 Weybridge Cir Unit A Royal Palm Beach, FL | 2.0 | 2.5 | 1470 | $2,350 | $1.60 | 22d | 1 | 0.65mi |
| 73 Macadamia Ct Royal Palm Beach, FL | 2.0 | 2.0 | 1112 | $2,000 | $1.80 | 11d | 1 | 0.73mi |
| 132 Weybridge Cir Royal Palm Beach, FL | 2.0 | 2.5 | 1470 | $3,000 | $2.04 | 24d | 1 | 0.79mi |
| 118 Bobwhite Rd Royal Palm Beach, FL | 3.0 | 2.0 | 1444 | $3,200 | $2.22 | 18d | 1 | 0.80mi |
| 151 Cordoba Cir Royal Palm Beach, FL | 3.0 | 2.0 | 1421 | $3,300 | $2.32 | 24d | 1 | 0.83mi |
| 10863 Dalmany Way Royal Palm Beach, FL | 3.0 | 2.0 | 1232 | $3,500 | $2.84 | 24d | 1 | 0.84mi |
| 263 Deerfield Ct Royal Palm Beach, FL | 2.0 | 2.0 | 1120 | $1,800 | $1.61 | 24d | 1 | 0.90mi |
| 7 Greenway Vlg N Royal Palm Beach, FL | 1.0–2.0 | 1.5–2.0 | 930 | $1,700 | $1.83 | 17d | 2 | 0.91mi |
| 7 Greenway Vlg N #107 Royal Palm Beach, FL | 1.0 | 1.5 | 780 | $1,650 | $2.12 | 5d | 1 | 0.91mi |
| 2 Greenway Vlg N #210 Royal Palm Beach, FL | 2.0 | 2.0 | 1080 | $2,000 | $1.85 | 24d | 1 | 0.92mi |
| 4 Greenway Vlg N #203 Royal Palm Beach, FL | 2.0 | 2.0 | 1080 | $2,000 | $1.85 | 24d | 1 | 0.96mi |
| 240 Bilbao St Royal Palm Beach, FL | 3.0 | 2.0 | 1440 | $3,400 | $2.36 | 24d | 1 | 1.00mi |
| 81 Westecunk Dr Royal Palm Beach, FL | 2.0 | 2.0 | 1347 | $2,550 | $1.89 | 18d | 1 | 1.02mi |
| 1049 Grandview Cir Royal Palm Beach, FL | 3.0 | 2.0 | 792 | $3,100 | $3.91 | 18d | 1 | 1.03mi |
| 12007 Poinciana Blvd #205 Royal Palm Beach, FL | 2.0 | 2.0 | 1088 | $1,590 | $1.46 | 15d | 1 | 1.06mi |
| 10336 Fox Trail Rd S #1305 West Palm Beach, FL | 2.0 | 2.0 | 1048 | $2,100 | $2.00 | 24d | 1 | 1.10mi |
| 12002 Poinciana Blvd #204 Royal Palm Beach, FL | 2.0 | 2.0 | 1048 | $1,750 | $1.67 | 24d | 1 | 1.10mi |
| 10354 Fox Trail Rd S #1501 West Palm Beach, FL | 2.0 | 2.0 | 1048 | $2,000 | $1.91 | 17d | 1 | 1.10mi |
| 10360 Fox Trail Rd S #1602 West Palm Beach, FL | 2.0 | 2.0 | 1048 | $1,920 | $1.83 | 21d | 1 | 1.10mi |
| 10324 Fox Trail Rd S Unit 324 Royal Palm Beach, FL | 2.0 | 2.0 | 1048 | $1,900 | $1.81 | 24d | 1 | 1.11mi |
| 10342 Fox Trail Rd S Unit 342 Royal Palm Beach, FL | 1.0 | 1.0 | 784 | $1,700 | $2.17 | 24d | 1 | 1.13mi |
| 10306 Fox Trail Rd S #912 West Palm Beach, FL | 1.0 | 1.0 | 775 | $1,700 | $2.19 | 3d | 1 | 1.17mi |
| 4 W Greenway Dr Unit 201 Royal Palm Beach, FL | 1.0 | 1.5 | 780 | $1,450 | $1.86 | 24d | 1 | 1.22mi |
| 10276 Fox Trail Rd S West Palm Beach, FL | 2.0 | 2.0 | 1051 | $1,900 | $1.81 | 24d | 2 | 1.22mi |
HOA detail condo
- Monthly dues
- $407 · $4,884/yr
- Assessments
- None detected in remarks — confirm with the listing agent.
Listing history 32 events
-
2026-05-04status Pending
-
2026-04-13$204,900 Active
-
2018-03-21soldstatus $137,000
-
2018-02-27status Pending
-
2018-02-27historical
-
2018-02-24price $140,000
-
2018-02-24price $137,000
-
2018-02-23status Active
-
2018-01-09historical
-
2018-01-08$145,900
-
2018-01-08historical
-
2018-01-01historical
-
2018-01-01$145,900 Active
-
2017-12-01price $144,900
-
2017-10-27$150,000 Active
-
2008-06-30soldstatus $125,000
-
2007-08-12historical
-
2007-03-13$181,500
-
2005-02-10soldstatus $149,900
-
2002-03-28soldstatus $78,000
-
2002-03-19soldstatus $78,000
-
2002-02-04historical
-
2002-01-30$79,900
-
2000-05-31soldstatus $55,900
-
2000-05-26soldstatus $55,900
-
2000-05-15historical
-
2000-03-14$59,900
-
1999-11-03soldstatus $53,000
-
1999-11-01soldstatus $53,000
-
1999-07-27historical
-
1999-06-22$55,900
-
1982-09-01soldstatus $72,500
ⓘ Source: listings_history table (triggers on properties + properties_extension) + one-shot
backfill from property_details.listing_events for pre-trigger history.
Tax reassessment forecast FL · Resets to sale price
- Current annual tax
- $4,024 · $335/mo
- Projected year-2 tax
- $4,024 · $335/mo
- Expected delta
- $0/yr ($0/mo · 0.0%)
ⓘ Screening estimate from a state-policy table — verify with the county assessor before closing.
Climate risk First Street
- Flood 1/10 Low FEMA zone X (unshaded) · 0% chance over 30 yrs
- Wildfire 3/10 Moderate
- Heat 10/10 Extreme 7 d/yr ≥107°F today · 26 d/yr by 30 yrs out
- Wind 10/10 Extreme 99% chance of damaging wind over 30 yrs
- Air quality 2/10 Low 0 unhealthy d/yr today · 1 by 30 yrs out
Nearby sold comps map
Loading sold comps map…
Walkable amenities ~0.75 mi
Loading nearby amenities…
Taxation est. · year 1
- Rental income
- $27,400
- − Mortgage interest
- −$11,478
- − Property taxes
- −$4,024
- − Insurance
- −$1,024
- − Repairs & maintenance
- −$2,192
- − Management
- −$2,192
- − HOA
- −$4,884
- − Depreciation
- −$5,961
- Taxable loss
- −$4,354
- Est. tax savings @ 24.0%
- +$1,045
- After-tax cash flow
- $-135/yr
For passive investors: Depreciation is non-cash, so a rental often shows a tax loss while cash-flowing — sheltering income. Rental losses are passive: they offset passive income freely, and up to $25,000/yr can offset ordinary (W-2) income if you actively participate and your MAGI is under $100k (phasing out to $0 by $150k); unused losses carry forward. On sale, claimed depreciation is recaptured at up to 25%, and gains may owe capital-gains tax (a 1031 exchange can defer both). Figures are a year-1 estimate at your 24.0% rate — not tax advice; consult a CPA.
Schools (NCES district)
- District
- Palm Beach
- NCES district ID
- 1201500
- Math proficiency
- 46% ▼ -16.00%
- Reading proficiency
- 53% ▼ -4.00%
- Median HH income
- $53,943
- Composite
- 42.72/100
- National rank
- #3160
- State rank
- #34 of 73 in FL
Livability — Royal Palm Beach
- Score
- 79/100
- State rank
- #135
- US rank
- #2039
Category grades
Schools grade is shown separately in the Schools card above.
Census & demographics
- Census place
- Royal Palm Beach, FL
- County
- Palm Beach County · 1,438,312 people
- City population
- 75,299
- Metro
- Miami-Fort Lauderdale-Pompano Beach, FL
- Population (ZIP)
- 76,863
- Household income
- $92,591
- Rent vs Own
- Severe rent burden
- 1870.0
Population outlook (Palm Beach County) Hauer SSP2
- Today (2025)
- 1,637,487 people
- By 2030
- 1,743,255 · +6.5%
- By 2040
- 1,948,712 · +19.0%
- By 2050
- 2,132,979 · +30.3%
- By 2075
- 2,530,027 · +54.5%
- By 2100
- 2,706,979 · +65.3%
Race, ethnicity, and origin ACS 2023
- Neighborhood character
- Diverse neighborhood (Simpson 0.70)
- Race & ethnicity
- White 44% Hispanic / Latino 24% Black 23% Two or more races 16% Asian 5%
- Hispanic origin (detail)
- Mexican 2% Puerto Rican 5% Cuban 4% Dominican 2%
- Common ancestry
- Hispanic 6% Romanian 2% Italian 1%
- Foreign-born
- 26% · Canada, Jamaica, China
- Languages at home
- 73% English-only · Spanish 17% French/Haitian/Cajun 4% Other Indo-European 2%
Political lean MEDSL · Palm Beach
- 2024 margin
- Toss-up / Even · D 50.0% · R 49.2%
- 2008→2024 swing
- -22.1pp toward R · 2008: 22.9pp · 2024: 0.8pp
- All cycles
- 2024: D+0.8 2020: D+12.8 2016: D+15.3 2012: D+17.0 2008: D+22.9
Not yet ingested
- Civics
- —
Market trends
- HPI YoY
- ▲ 17.04%
- Current HPI
- 903.78
- Rent YoY
- ▲ 0.85%
- Metro
- Miami-Fort Lauderdale-Pompano Beach, FL
- State GDP YoY
- ▲ 3.28%
- F500 in state
- 36
Industry mix (Fortune 500 HQ in FL)
| Industry | F500 HQs | Revenue |
|---|---|---|
| Industrial Technology | 2 | $29B |
|
||
| Insurance | 2 | $17B |
|
||
| Retail | 1 | $60B |
|
||
| Technology Distribution | 1 | $58B |
|
||
| Homebuilding | 1 | $35B |
|
||
| Technology Manufacturing | 1 | $35B |
|
||
Price history
+182.6% since first listed32 events — show timeline
- 2026-05-04 Pending — Beaches MLS
- 2026-04-13 Listed $204,900 Beaches MLS
- 2018-03-21 Sold (Public Records) $137,000 Public Records
- 2018-02-27 Pending — Beaches MLS
- 2018-02-27 Listing Removed — Beaches MLS
- 2018-02-24 Price Changed $140,000 Beaches MLS
- 2018-02-24 Price Changed $137,000 Beaches MLS
- 2018-02-23 Relisted — Beaches MLS
- 2018-01-09 Listing Removed — Beaches MLS
- 2018-01-08 Listing Removed — Beaches MLS
- 2018-01-08 Listed $145,900 Beaches MLS
- 2018-01-01 Listing Removed — Beaches MLS
- 2018-01-01 Listed $145,900 Beaches MLS
- 2017-12-01 Price Changed $144,900 Beaches MLS
- 2017-10-27 Listed $150,000 Beaches MLS
- 2008-06-30 Sold (Public Records) $125,000 Public Records
- 2007-08-12 Listing Removed — Beaches MLS
- 2007-03-13 Listed $181,500 Beaches MLS
- 2005-02-10 Sold (Public Records) $149,900 Public Records
- 2002-03-28 Sold (Public Records) $78,000 Public Records
- 2002-03-19 Sold (MLS) $78,000 Beaches MLS
- 2002-02-04 Listing Removed — Beaches MLS
- 2002-01-30 Listed $79,900 Beaches MLS
- 2000-05-31 Sold (Public Records) $55,900 Public Records
- 2000-05-26 Sold (MLS) $55,900 Beaches MLS
- 2000-05-15 Listing Removed — Beaches MLS
- 2000-03-14 Listed $59,900 Beaches MLS
- 1999-11-03 Sold (Public Records) $53,000 Public Records
- 1999-11-01 Sold (MLS) $53,000 Beaches MLS
- 1999-07-27 Listing Removed — Beaches MLS
- 1999-06-22 Listed $55,900 Beaches MLS
- 1982-09-01 Sold (Public Records) $72,500 Public Records
Property tax history
+8.4%/yrLatest (2025): $4,024 · +138.7% YoY. Source: county tax records.
Cash-flow waterfall
monthlySold comps — $/sqft
last 12 mo · ≤1 miLoading sold comps…