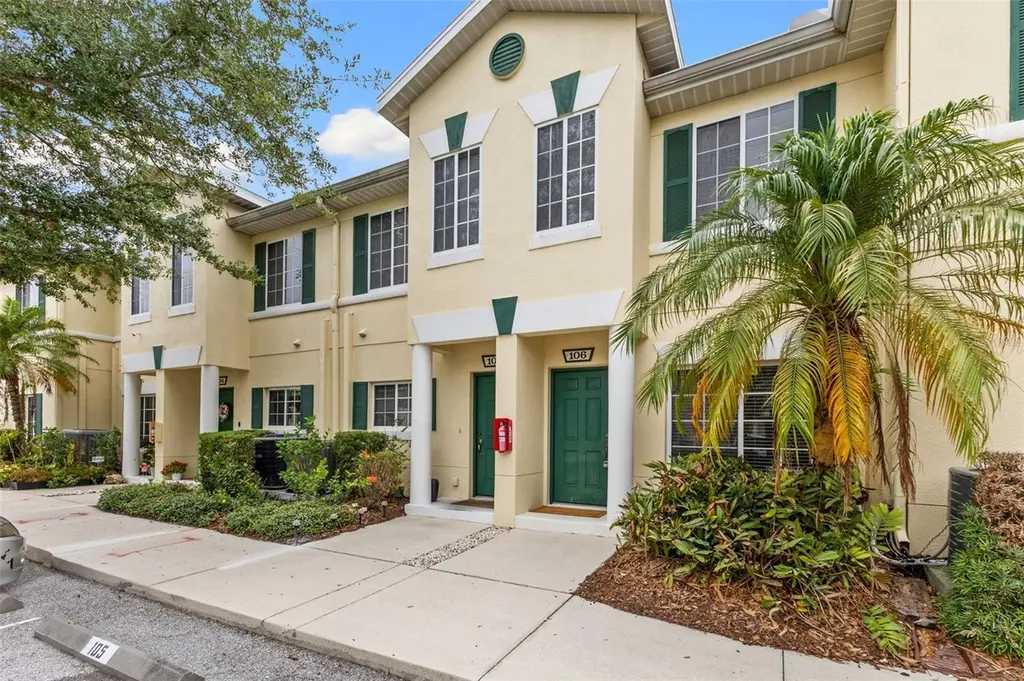
354 Cape Harbour Loop #106 · Bradenton, FL
Flood risk 6/10 · Moderate
- FEMA flood zone
- X (shaded)
- Chance of flooding over 30 yrs
- 0.56%
- Est. flood insurance / yr
- $507 – $1,088
Fire risk 1/10 · Minimal
- Est. fire insurance / yr
- $947 – $1,759
Heat risk 10/10 · Severe
- Hot days now (above 107°F)
- 7 days/yr
- Hot days in 30 yrs
- 30 days/yr
Wind risk 10/10 · Severe
- Chance of severe wind over 30 yrs
- 99.0%
Air-quality risk 3/10 · Minor
- Unhealthy air days now
- 3 days/yr
- Unhealthy air days in 30 yrs
- 3 days/yr
Risk factors via First Street. Map © Google.
Why this score? — see what drove the D- grade
The composite is a weighted blend of 9 inputs, each scored 0–100. Each bar is that input's sub-score; the figure is the points it added to the 100-point composite (weight × sub-score).
- Cash flow +7.9/30.0
- ARV discount +6.5/15.0
- 1% rule +4.5/10.0
- Schools +4.4/10.0
- Appreciation +4.1/10.0
- Livability +4.0/5.0
- Condition / age +2.5/5.0
- DSCR +2.0/10.0
- Rent growth +1.6/5.0
$235,000
🖨 Deal sheet (PDF) 📄 Offer letter ✓ Due diligence
Listing remarks MLS
* * BACK ON THE MARKET BUYER'S LENDING FELL THROUGH * * Welcome to Heritage Harbour, and the Highly desired Lighthouse Cove Townhomes. Centrally located near LECOM schools, several golf courses, nature trails, a nearby fishing pier, Lakewood Ranch, and the new Costco just down the road. As you enter the spacious living space downstairs you will easily flow into your living room, dining area, 1/2 bathroom, and kitchen with a serving window to your dining area. Upstairs are your 2 bedrooms, 2 full bathrooms, and a den area perfect for your in-home office or additional tv room upstairs. Move-in ready clean, freshly painted, beautiful bamboo flooring downstairs and upstairs also the AC has been recently serviced with a new switchboard installed. Inspection report available upon request. * * * Please Read Realtor Remarks * * *
Key facts
- Scenic nature trails
- Community amenities
- Newly replaced dryer
Tags
Property features AI
Finance
- Other: Lease restrictions apply
- Financial info: Total monthly fees reported $398; Total annual fees reported $4,776
- HOA & community: HOA required (monthly HOA approximately $374.67; quarterly fees reported); HOA covers pool, grounds maintenance, sewer, trash, and water; Community pool; No truck/RV/motorcycle parking restrictions; Pets allowed
Exterior
- Parking: Assigned parking
- Utilities: Public water; Public sewer; Cable available; Electricity available
- Home design: Townhouse; Residential property; Two stories; Faces north; Entry on two levels
- Construction: Block construction; Shingle roof; Slab foundation; Built as part of building numbered 354
- Exterior features: Rear screened porch; Patio/porch; Asphalt road access
Interior
- Kitchen: Microwave; Range; Refrigerator; Dishwasher
- Bedrooms: 2 bedrooms
- Flooring: Bamboo
- Bathrooms: 2 full baths; 1 half bath
- Heating & cooling: Electric heating; Central air conditioning
- Interior features: Blinds; Balcony; Storage; Media room; Family room; Inside utility
- Laundry & utility: Washer; Dryer; Laundry closet
Neighborhood map
What this means for you Summary
Snapshot
- This is a 2-bed/2.5-bath townhouse listed at $235k.
Deal economics
- At list price, monthly cash flow is $-248 ($-3k/yr) — negative.
- To cash-flow at today's rent, offer at most $191k (18.6% below list).
- To meet the 1% rule (rent ≥ 1% of price), the offer needs to be $223k (5.1% below list).
- Recommended offer: $191k (18.6% below list) — sets the bar for cash-flow.
- Cap rate 5.0% vs local median 3.6% in Bradenton — top-decile yield for the area; either an underpriced asset or a hidden risk that comps aren't pricing in. Stress-test before assuming the spread holds.
Location & tenants
- Location reads 81/100 on livability (#101 in FL, #1,528 nationally) — a professional / high-income tenant draw. Strengths: commute A+, cost of living A+, housing A+; Watch: employment D+, crime D, amenities F.
- Manatee (suburban): math 54% / reading 50% proficiency, ranked #26 of 73 in FL (top 36%) — acceptable for families but not a draw, mixed tenant base, ~2y average lease.
- Zoned schools: Freedom Elementary School (math 75% / reading 67%, grade A-, #320 of 2,144 statewide, top 15%, 574 students, 42% FRL); Carlos E. Haile Middle School (math 70% / reading 63%, grade A-, #84 of 571 statewide, top 16%, 737 students, 45% FRL); Braden River High School (math 44% / reading 52%, grade D, #201 of 667 statewide, top 30%, 1,774 students, 45% FRL).
- Market conditions: Rents falling (-3.4%/yr); 486 active listings in the ZIP; 40 comparable units currently listed for rent nearby; rentals at typical pace (median 25d on market — plan ~3-4 weeks tenant-placement turnaround); high-income renter base; 7,472 units permitted in Manatee County in 2024 (1,782 in 5+ unit buildings).
Forward outlook
- Local home prices are declining (-1.8%/yr); year-one equity from $2k of loan paydown is wiped out by about $4k of value loss. Plan a longer hold.
- Manatee County population projected at +43% by 2050 — long-run rental-demand tailwind backs the buy-and-hold thesis.
Negotiation context
- It's been on market 16 days — a 2% lower offer ($231k) is reasonable based on typical stale-listing flexibility.
- 3 sale attempts since 4y ago with the ask held roughly flat each time — persistent listings suggest the price (not the market) is what's stuck; bring a comps-based counter.
Risks & watch-outs
- Climate carrying-cost: major flood risk; severe wind risk, 99% chance of damaging wind over 30y; extreme-heat days projected 7→30/yr by 2055 (HVAC capex compounding) — expect insurance premiums to compound above CPI over the hold.
Questions for the listing agent
- What do current leases actually rent for vs. the listed asking? Can we see a recent rent roll and the last 12 months of T-12 income?
- What does the HOA fee cover, when was the last increase, and are there any pending special assessments or reserve-fund shortfalls?
- Is there a deadline driving the sale (1031 exchange, divorce, estate, relocation)? That informs how much negotiation room exists.
- Crime grade is D in this area — have there been break-ins, vandalism, or insurance claims at this property in the last 3 years? What carrier currently insures it and at what premium?
- The area grade is low — what's the realistic commute time and amenity access for the typical tenant pool here? Any planned neighborhood developments (good or bad) we should know about?
- What's the average days-on-market for RENTAL listings here right now (not sales)? A rising rental-DOM trend means longer vacancies and softer asking-rent achievability than the comps imply.
- What's the recent tenant-quality profile in this submarket — average credit score on applications, eviction rate, late-payment / NSF rate, and stable-employment percentage? A property-management company in the area should have these aggregated.
- How much new for-sale + rental construction is in the pipeline within 1–3 miles? Heavy new supply typically softens prices + rents 12–24 months out; constrained supply supports both.
Investment metrics
- 1% rule
- 0.95% ✗
- Cap rate
- 5.03%
- Cash-on-cash
- -4.52%
- DSCR
- 0.80
- GRM
- 8.8
CMA / ARV
- ARV (on-the-fly)
- $230,069
- Comps found
- 12
Show comp detail 12 sales within ~0.75 mi
| Address | Dist | Beds/Ba | Sqft | Sold | Price | $/sf | Match |
|---|---|---|---|---|---|---|---|
| 232 Cape Harbour Loop #106 | 0.12mi | 2/2.5 | 1,429 (0%) | 0mo | $228,000 | $160 | 94 |
| 329 Cape Harbour Loop #103 | 0.14mi | 2/2.5 | 1,429 (0%) | 0mo | $235,000 | $164 | 93 |
| 311 Cape Harbour Loop #103 | 0.22mi | 2/2.5 | 1,429 (0%) | 1mo | $195,000 | $136 | 89 |
| 245 Cape Harbour Loop #103 | 0.17mi | 2/2.5 | 1,429 (0%) | 7mo | $206,500 | $145 | 86 |
| 341 Cape Harbour Loop #105 | 0.08mi | 2/2.5 | 1,429 (0%) | 12mo | $227,500 | $159 | 86 |
| 238 Cape Harbour Loop #104 | 0.15mi | 2/2.5 | 1,429 (0%) | 11mo | $228,000 | $160 | 84 |
| 250 Cape Harbour Loop #106 | 0.20mi | 2/2.5 | 1,429 (0%) | 16mo | $230,000 | $161 | 77 |
| 280 Cape Harbour Loop #106 | 0.28mi | 2/2.5 | 1,429 (0%) | 17mo | $215,000 | $150 | 73 |
| 6807 Grand Estuary Trl #102 | 0.71mi | 2/2.0 | 1,561 (+9%) | 2mo | $288,000 | $184 | 48 |
| 6819 Grand Estuary Trl #203 | 0.71mi | 2/2.0 | 1,561 (+9%) | 2mo | $323,000 | $207 | 48 |
| 6807 Grand Estuary Trl #202 | 0.71mi | 2/2.0 | 1,561 (+9%) | 2mo | $313,500 | $201 | 47 |
| 6611 Grand Estuary Trl #105 | 0.73mi | 2/2.0 | 1,561 (+9%) | 2mo | $280,000 | $179 | 47 |
Match score weights: distance 35% · size 25% · config 20% · recency 20%. Top-matched comps best support the ARV.
Projected returns pro-forma
-1.82% appreciation · 0.0% rent growth · sell at horizon
- IRR
- -19.2%
- Equity multiple
- 0.27×
- Total profit
- $-48,299
- Equity at exit
- $47,617
- IRR
- -17.8%
- Equity multiple
- -0.15×
- Total profit
- $-75,887
- Equity at exit
- $42,594
Cash invested: $65,800 (down + closing). Projections, not guarantees.
Landlord ↔ Tenant lean methodology
- Overall (STATE)
- 87 Strongly Landlord-Friendly
- State Florida
- 87 Strongly Landlord-Friendly · R+3
- County
- — inherits STATE
- City
- — inherits STATE
ZIP-level market 34212
- Home prices YoY
- -0.7%
- Rents YoY
- -3.4%
- Active inventory
- 486
- Price-to-rent
- 8.8×
Monthly cashflow live
- Estimated rent
- $2,230 high interval (Pro) →
- Mortgage (P&I)
- −$1,232
- Tax from tax record
- −$281 /mo · $3,374/yr
- Insurance
- −$98
- HOA
- −$398
- Vacancy / Maint / Mgmt
- −$468
- Net cashflow
- $-248
Break-even live
Sensitivity live
| Price | -10% $-115 | -5% $-181 | +0% $-248 | +5% $-314 | +10% $-381 |
|---|---|---|---|---|---|
| Rent | -10% $-424 | -5% $-336 | +0% $-248 | +5% $-160 | +10% $-72 |
| Rate | -1.0pp $-129 | -0.5pp $-188 | base $-248 | +0.5pp $-309 | +1.0pp $-371 |
UW: 25.0% down · 7.5% · 30yr · 1.5% tax · 5.0% vac · 8.0% maint · 8.0% mgmt
Financing live
Cash to close
- Down payment
- $58,750
- Closing costs
- $7,050
- Reserves months
- —
- Total cash needed
- —
Loan-product check · same deal, 3 products live
Conventional
25% down · 7.5% · 30yr
- Down + closing
- —
- Monthly P&I
- —
- Monthly cashflow
- —
- DSCR
- —
- Eligible?
- —
Personal DTI + credit; lowest rate.
DSCR
20% down · 8.5% · 30yr
- Down + closing
- —
- Monthly P&I
- —
- Monthly cashflow
- —
- DSCR
- —
- Eligible?
- —
No personal income docs; deal must DSCR.
Hard money
10% down · 12.0% · 12mo
- Down + closing
- —
- Monthly P&I
- —
- Monthly cashflow
- —
- DSCR
- —
- Eligible?
- —
Short-term bridge; refi at stabilization.
Rent comps 40 comps
| Address | Beds | Baths | Sqft | Rent | $/sqft | DOM | Units | Dist |
|---|---|---|---|---|---|---|---|---|
| 360 Cape Harbour Loop #105 Bradenton, FL | 3.0 | 2.5 | 1429 | $2,200 | $1.54 | 25d | 1 | 0.04mi |
| 208 Cape Harbour Loop #101 Bradenton, FL | 3.0 | 2.5 | 1200 | $2,000 | $1.67 | 25d | 1 | 0.07mi |
| 250 Cape Harbour Loop #106 Bradenton, FL | 2.0 | 2.5 | 1429 | $1,775 | $1.24 | 16d | 1 | 0.22mi |
| 250 Cape Harbour Loop Bradenton, FL | 3.0 | 2.5 | 1200 | $1,800 | $1.50 | 25d | 1 | 0.22mi |
| 257 Cape Harbour Loop #101 Bradenton, FL | 3.0 | 2.5 | 1200 | $1,925 | $1.60 | 5d | 1 | 0.24mi |
| 257 Cape Harbour Loop #104 Bradenton, FL | 2.0 | 2.5 | 1429 | $1,700 | $1.19 | 25d | 1 | 0.24mi |
| 311 Cape Harbour Loop #103 Bradenton, FL | 2.0 | 2.5 | 1429 | $1,850 | $1.29 | 16d | 1 | 0.24mi |
| 267 Cape Harbour Loop #101 Bradenton, FL | 3.0 | 2.5 | 1200 | $1,700 | $1.42 | 25d | 1 | 0.26mi |
| 262 Cape Harbour Loop #102 Bradenton, FL | 3.0 | 2.5 | 1200 | $1,900 | $1.58 | 25d | 1 | 0.26mi |
| 7124 Grand Estuary Trl #104 Bradenton, FL | 3.0 | 2.0 | 1786 | $2,500 | $1.40 | 25d | 1 | 0.29mi |
| 280 Cape Harbour Loop #101 Bradenton, FL | 3.0 | 2.5 | 1400 | $2,100 | $1.50 | 17d | 1 | 0.30mi |
| 6510 Anchor Loop Bradenton, FL | 1.0–3.0 | 1.0–2.0 | 1135 | $1,782 | $1.57 | 3d | 32 | 0.34mi |
| 6760 Willowshire Way Bradenton, FL | 3.0 | 2.0 | 1387 | $3,500 | $2.52 | 25d | 1 | 0.43mi |
| 131 Babbling Brook Run Bradenton, FL | 3.0 | 2.0 | 1387 | $2,200 | $1.59 | 25d | 1 | 0.44mi |
| 7008 Grand Estuary Trl #104 Bradenton, FL | 3.0 | 2.0 | 1786 | $2,800 | $1.57 | 25d | 1 | 0.46mi |
| 6627 Candlestick Dr Bradenton, FL | 2.0 | 2.0 | 1541 | $5,500 | $3.57 | 25d | 1 | 0.55mi |
| 6614 Grand Estuary Trl #101 Bradenton, FL | 3.0 | 2.0 | 1786 | $3,200 | $1.79 | 25d | 1 | 0.67mi |
| 6819 Grand Estuary Trl #205 Bradenton, FL | 2.0 | 2.0 | 1561 | $2,499 | $1.60 | 25d | 1 | 0.69mi |
| 6715 Grand Estuary Trl #106 Bradenton, FL | 2.0 | 2.0 | 1600 | $5,000 | $3.12 | 25d | 1 | 0.70mi |
| 6705 Grand Estuary Trl #104 Bradenton, FL | 2.0 | 2.0 | 1561 | $2,500 | $1.60 | 25d | 1 | 0.71mi |
| 424 Winding Brook Ln #104 Bradenton, FL | 3.0 | 2.0 | 1786 | $2,995 | $1.68 | 17d | 1 | 0.72mi |
| 6611 Grand Estuary Trl #204 Bradenton, FL | 2.0 | 2.0 | 1561 | $2,500 | $1.60 | 17d | 1 | 0.72mi |
| 6611 Grand Estuary Trl Bradenton, FL | 2.0 | 2.0 | 1561 | $2,350 | $1.51 | 25d | 2 | 0.73mi |
| 6519 Grand Estuary Trl Bradenton, FL | 2.0 | 2.0 | 1156 | $3,000 | $2.60 | 25d | 2 | 0.75mi |
| 7005 River Hammock Dr #305 Bradenton, FL | 2.0 | 2.0 | 1121 | $2,500 | $2.23 | 25d | 1 | 0.77mi |
| 6515 Grand Estuary Trl #107 Bradenton, FL | 2.0 | 2.0 | 1156 | $3,950 | $3.42 | 25d | 1 | 0.77mi |
| 7019 River Hammock Dr Bradenton, FL | 2.0–3.0 | 2.0 | 1209 | $2,000 | $1.65 | 12d | 2 | 0.78mi |
| 7121 River Hammock Dr Bradenton, FL | 2.0 | 2.0 | 1176 | $2,248 | $1.91 | 25d | 2 | 0.78mi |
| 7121 River Hammock Dr Unit 1546059P Bradenton, FL | 2.0 | 2.0 | 1151 | $2,903 | $2.52 | 17d | 1 | 0.78mi |
| 6110 9th Avenue Cir NE Bradenton, FL | 2.0 | 1.5 | 1000 | $2,000 | $2.00 | 25d | 1 | 0.79mi |
| 6411 Grand Estuary Trl #401 Bradenton, FL | 2.0 | 2.0 | 1156 | $2,325 | $2.01 | 17d | 1 | 0.81mi |
| 7225 River Hammock Dr #202 Bradenton, FL | 2.0 | 2.0 | 1561 | $1,749 | $1.12 | 5d | 1 | 0.84mi |
| 7305 River Hammock Dr #206 Bradenton, FL | 2.0 | 2.0 | 1661 | $2,600 | $1.57 | 25d | 1 | 0.87mi |
| 7607 Grand Estuary Trl Bradenton, FL | 2.0 | 2.0 | 1226 | $2,900 | $2.37 | 25d | 2 | 1.00mi |
| 7705 Grand Estuary Trl Bradenton, FL | 2.0 | 2.0 | 1175 | $1,975 | $1.68 | 17d | 2 | 1.06mi |
| 7803 Grand Estuary Trl Bradenton, FL | 2.0 | 2.0 | 1371 | $2,650 | $1.93 | 25d | 2 | 1.10mi |
| 7911 Grand Estuary Trl Bradenton, FL | 2.0 | 2.0 | 1156 | $3,500 | $3.03 | 25d | 2 | 1.14mi |
| 8105 Grand Estuary Trl Bradenton, FL | 2.0 | 2.0 | 1138 | $2,875 | $2.53 | 5d | 3 | 1.21mi |
| 8205 Grand Estuary Trl Bradenton, FL | 2.0 | 2.0 | 1121 | $2,125 | $1.90 | 17d | 2 | 1.25mi |
| 8312 Grand Estuary Trl #104 Bradenton, FL | 3.0 | 2.0 | 1786 | $3,200 | $1.79 | 25d | 1 | 1.26mi |
HOA detail
- Monthly dues
- $398 · $4,776/yr
Listing history 12 events
-
2026-06-22days on market $235,000 Active 16 DOM
-
2026-06-18days on market $235,000 Active 13 DOM
-
2026-06-17days on market $235,000 Active 12 DOM
-
2026-06-16days on market $235,000 Active 11 DOM
-
2026-06-15days on market $235,000 Active 10 DOM
-
2026-06-13days on market $235,000 Active 8 DOM
-
2026-06-13days on market $235,000 Active 7 DOM
-
2026-06-10days on market $235,000 Active 5 DOM
-
2026-06-09days on market $235,000 Active 4 DOM
-
2026-06-08days on market $235,000 Active 3 DOM
-
2026-06-07remarks 699-char remark
-
2026-06-07$235,000 Active 2 DOM
ⓘ Source: listings_history table (triggers on properties + properties_extension) + one-shot
backfill from property_details.listing_events for pre-trigger history.
Tax reassessment forecast FL · Resets to sale price
- Current annual tax
- $3,374 · $281/mo
- Projected year-2 tax
- $3,374 · $281/mo
- Expected delta
- $0/yr ($0/mo · 0.0%)
ⓘ Screening estimate from a state-policy table — verify with the county assessor before closing.
Climate risk First Street
- Flood 6/10 Major FEMA zone X (shaded) · 56% chance over 30 yrs
- Wildfire 1/10 Low
- Heat 10/10 Extreme 7 d/yr ≥107°F today · 30 d/yr by 30 yrs out
- Wind 10/10 Extreme 99% chance of damaging wind over 30 yrs
- Air quality 3/10 Moderate 3 unhealthy d/yr today · 3 by 30 yrs out
Nearby sold comps map
Loading sold comps map…
Walkable amenities ~0.75 mi
Loading nearby amenities…
Taxation est. · year 1
- Rental income
- $26,761
- − Mortgage interest
- −$13,164
- − Property taxes
- −$3,374
- − Insurance
- −$1,175
- − Repairs & maintenance
- −$2,141
- − Management
- −$2,141
- − HOA
- −$4,776
- − Depreciation
- −$6,836
- Taxable loss
- −$6,846
- Est. tax savings @ 24.0%
- +$1,643
- After-tax cash flow
- $-1,329/yr
For passive investors: Depreciation is non-cash, so a rental often shows a tax loss while cash-flowing — sheltering income. Rental losses are passive: they offset passive income freely, and up to $25,000/yr can offset ordinary (W-2) income if you actively participate and your MAGI is under $100k (phasing out to $0 by $150k); unused losses carry forward. On sale, claimed depreciation is recaptured at up to 25%, and gains may owe capital-gains tax (a 1031 exchange can defer both). Figures are a year-1 estimate at your 24.0% rate — not tax advice; consult a CPA.
Schools (NCES district)
- District
- Manatee
- NCES district ID
- 1201230
- Math proficiency
- 54% ▼ -6.00%
- Reading proficiency
- 50% ▼ -2.00%
- Median HH income
- $49,607
- Composite
- 44.43/100
- National rank
- #2806
- State rank
- #26 of 73 in FL
Livability — Bradenton
- Score
- 81/100
- State rank
- #101
- US rank
- #1528
Category grades
Schools grade is shown separately in the Schools card above.
Census & demographics
- County
- Manatee County · 416,364 people
- City population
- 227,091
- Metro
- North Port-Sarasota-Bradenton, FL
- Population (ZIP)
- 25,536
- Household income
- $125,486
- Rent vs Own
- Severe rent burden
- 383.0
Population outlook (Manatee County) Hauer SSP2
- Today (2025)
- 447,342 people
- By 2030
- 488,911 · +9.3%
- By 2040
- 567,934 · +27.0%
- By 2050
- 637,995 · +42.6%
- By 2075
- 781,970 · +74.8%
- By 2100
- 848,272 · +89.6%
Race, ethnicity, and origin ACS 2023
- Neighborhood character
- Predominantly White (81%)
- Race & ethnicity
- White 81% Hispanic / Latino 10% Two or more races 8% Black 3% Asian 2%
- Hispanic origin (detail)
- Mexican 1% Puerto Rican 2% Cuban 1%
- Common ancestry
- Romanian 5% Lithuanian 3% Slovak 2%
- Foreign-born
- 9% · Canada, Vietnam, China
- Languages at home
- 89% English-only · Spanish 6% Other Indo-European 2% Vietnamese 2%
Political lean MEDSL · Manatee
- 2024 margin
- Strong R (+23.5) · D 37.9% · R 61.4%
- 2008→2024 swing
- -16.5pp toward R · 2008: -7.0pp · 2024: -23.5pp
- All cycles
- 2024: R+23.5 2020: R+16.1 2016: R+17.1 2012: R+12.5 2008: R+7.0
Not yet ingested
- Civics
- —
Market trends
- HPI YoY
- ▼ -1.82%
- Current HPI
- 276.7636
- Rent YoY
- ▼ -3.44%
- Metro
- North Port-Sarasota-Bradenton, FL
- State GDP YoY
- ▲ 3.28%
- F500 in state
- 36
Industry mix (Fortune 500 HQ in FL)
| Industry | F500 HQs | Revenue |
|---|---|---|
| Industrial Technology | 2 | $29B |
|
||
| Insurance | 2 | $17B |
|
||
| Retail | 1 | $60B |
|
||
| Technology Distribution | 1 | $58B |
|
||
| Homebuilding | 1 | $35B |
|
||
| Technology Manufacturing | 1 | $35B |
|
||
Price history
-17.5% since first listed8 events — show timeline
- 2026-06-05 Listed $235,000 Stellar MLS as Distributed by MLS Grid
- 2022-08-04 Sold (MLS) $285,000 Stellar MLS as Distributed by MLS Grid
- 2022-07-08 Pending — Stellar MLS as Distributed by MLS Grid
- 2022-06-27 Price Changed $295,000 Stellar MLS as Distributed by MLS Grid
- 2022-06-27 Price Changed $290,000 Stellar MLS as Distributed by MLS Grid
- 2022-06-27 Relisted — Stellar MLS as Distributed by MLS Grid
- 2022-05-27 Pending — Stellar MLS as Distributed by MLS Grid
- 2022-05-20 Listed $285,000 Stellar MLS as Distributed by MLS Grid
Property tax history
+7.6%/yrLatest (2025): $3,374 · -10.5% YoY. Source: county tax records.
Cash-flow waterfall
monthlySold comps — $/sqft
last 12 mo · ≤1 miLoading sold comps…