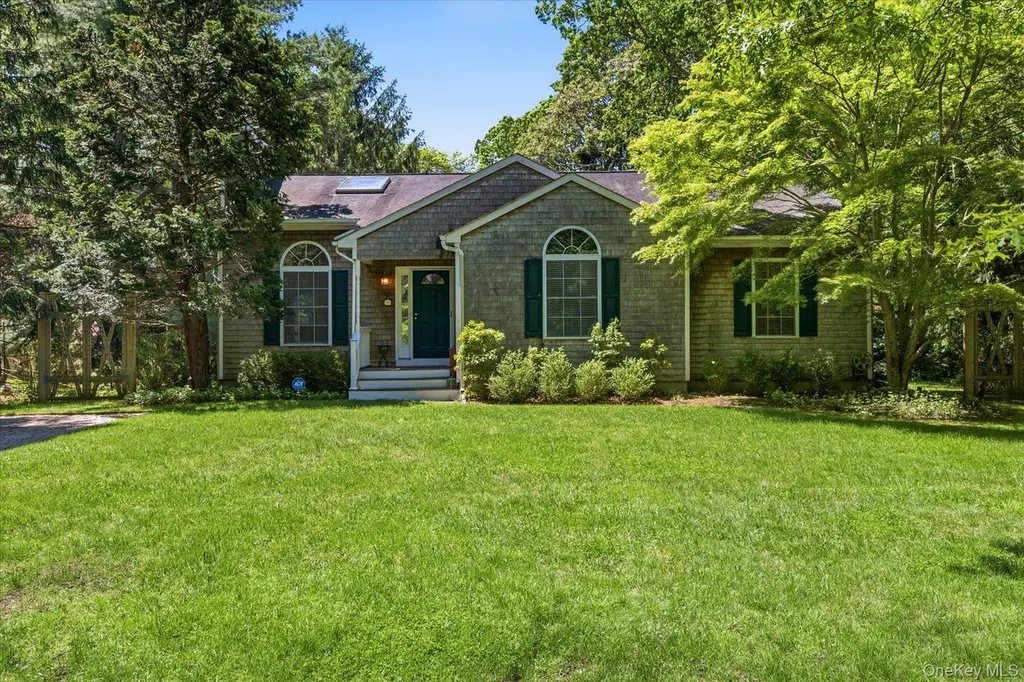
34 Waterhole Rd · Springs, NY
Flood risk 1/10 · Minimal
- FEMA flood zone
- X (unshaded)
- Chance of flooding over 30 yrs
- 0.0%
- Est. flood insurance / yr
- $473 – $860
Fire risk 1/10 · Minimal
- Est. fire insurance / yr
- $691 – $1,283
Heat risk 4/10 · Minor
- Hot days now (above 90°F)
- 7 days/yr
- Hot days in 30 yrs
- 19 days/yr
Wind risk 8/10 · Major
- Chance of severe wind over 30 yrs
- 80.0%
Air-quality risk 3/10 · Minor
- Unhealthy air days now
- 2 days/yr
- Unhealthy air days in 30 yrs
- 3 days/yr
Risk factors via First Street. Map © Google.
Why this score? — see what drove the B grade
The composite is a weighted blend of 9 inputs, each scored 0–100. Each bar is that input's sub-score; the figure is the points it added to the 100-point composite (weight × sub-score).
- Cash flow +30.0/30.0
- DSCR +10.0/10.0
- 1% rule +9.5/10.0
- ARV discount +9.2/15.0
- Schools +5.1/10.0
- Rent growth +5.0/5.0
- Livability +3.2/5.0
- Condition / age +2.5/5.0
- Appreciation +0.0/10.0
$1,395,000
🖨 Deal sheet (PDF) 📄 Offer letter ✓ Due diligence
Listing remarks
Immaculate and charming, this 3Bed/2Bath Clearwater Beach home with soaring ceilings and tons of natural light offers the opportunity to move right in and enjoy or a refresh with expansion/upgrade options with plenty of room for a pool, an expansive basement with high ceilings for additional living spaces and/or increase the home's current footprint. The living room with woodburning fireplace greets you as you enter with an adjacent dining area that opens to a wonderful kitchen, offering a comfortable space for entertaining. Down the hall you have two guest bedrooms and a guest bath along with a large primary bedroom suite which includes an ensuite bath with separate tub and shower along wi
Key facts
- Patio area
- Nice sized deck
- 0.43 acre lot
Tags
Property features AI
Exterior
- Parking: Driveway
- Utilities: Septic tank; No additional utilities listed
- Home design: Single family residence
- Construction: Shingle siding; Full unfinished basement
- Exterior features: Back yard; Front yard; Patio
Interior
- Kitchen: Dishwasher; Microwave; Oven; Range; Refrigerator
- Bedrooms: Total rooms: 7 (includes bedrooms and living spaces)
- Bathrooms: 2 full bathrooms
- Heating & cooling: Baseboard heating (oil); Central air conditioning
- Interior features: First-floor bedroom; First-floor full bathroom; Patio
- Laundry & utility: Washer; Dryer
Neighborhood map
What this means for you Summary
Snapshot
- This is a 3-bed/2.0-bath single-family listed at $1.40M.
Deal economics
- At list price, monthly cash flow is $8k ($90k/yr) — positive.
- The deal already cash-flows at list — no discount required.
- Meets the 1% rule at list price ($20k rent vs $1.40M).
Location & tenants
- Location reads 63/100 on livability (#809 in NY) — a middle-class / working-renter tenant base. Strengths: crime A+, employment A+; Watch: housing C-, amenities F, commute F.
- Springs Union Free School District (town): math 55% / reading 60% proficiency, ranked #239 of 590 in NY (top 40%) — acceptable for families but not a draw, mixed tenant base, ~2y average lease; only 9% free/reduced lunch — higher-income household profile.
- Zoned schools: Springs School (math 55% / reading 60%, grade C+, #839 of 2,108 statewide, top 40%, 689 students, 0% FRL).
- Market conditions: Rents rising fast (+12.3%/yr); 135 active listings in the ZIP; 6 comparable units currently listed for rent nearby; rentals lingering (median 46d on market — plan ~5-8 weeks vacancy on turnover, expect pricing pressure); 67% of comp listings sitting > 30 days — soft ceiling on asking rent; high-income renter base; 1,366 units permitted in Suffolk County in 2024 (216 in 5+ unit buildings).
- At $20,267/mo this rent would consume 187% of the median local household income ($130k/yr) (locally 896% of renters already pay >50% of income on rent) — very limited rent-growth headroom before tenants either downsize or default.
Forward outlook
- Local home prices are declining (-3.0%/yr); year-one equity from $10k of loan paydown is wiped out by about $42k of value loss. Plan a longer hold.
- Suffolk County population projected to shrink 5% by 2050 — rents likely to lag national; underwrite the cash flow, not the appreciation.
- At projected returns (-3.0% appreciation + 8.0% rent growth), your $391k cash investment doubles in ~5 years — after that, you're playing with house money.
Negotiation context
- Only 12 days on market — expect competitive offers; lowballing is unlikely to land.
- Current owner paid $720k; list at $1.40M implies a 94% gain — meaningful room to come down on a strong offer.
Risks & watch-outs
- Climate carrying-cost: severe wind risk, 80% chance of damaging wind over 30y — expect insurance premiums to compound above CPI over the hold.
Questions for the listing agent
- Is there a deadline driving the sale (1031 exchange, divorce, estate, relocation)? That informs how much negotiation room exists.
- Schools are D-rated, which usually means shorter tenancies and higher turnover. Who's the typical renter profile here, and what's been the actual vacancy rate?
- What's the average days-on-market for RENTAL listings here right now (not sales)? A rising rental-DOM trend means longer vacancies and softer asking-rent achievability than the comps imply.
- What's the recent tenant-quality profile in this submarket — average credit score on applications, eviction rate, late-payment / NSF rate, and stable-employment percentage? A property-management company in the area should have these aggregated.
- How much new for-sale + rental construction is in the pipeline within 1–3 miles? Heavy new supply typically softens prices + rents 12–24 months out; constrained supply supports both.
Investment metrics
- 1% rule
- 1.45% ✓
- Cap rate
- 12.76%
- Cash-on-cash
- 23.11%
- DSCR
- 2.03
- GRM
- 5.7
CMA / ARV
- ARV (on-the-fly)
- $1,451,250
- Comps found
- 1
Show comp detail 1 sale within ~0.75 mi
| Address | Dist | Beds/Ba | Sqft | Sold | Price | $/sf | Match |
|---|---|---|---|---|---|---|---|
| 111 Norfolk Dr | 0.29mi | 3/2.0 | 1,200 (-7%) | 22mo | $1,350,000 | $1,125 | 56 |
Match score weights: distance 35% · size 25% · config 20% · recency 20%. Top-matched comps best support the ARV.
Projected returns pro-forma
-3.0% appreciation · 8.0% rent growth · sell at horizon
- IRR
- 21.3%
- Equity multiple
- 1.92×
- Total profit
- $359,709
- Equity at exit
- $207,999
- IRR
- 32.4%
- Equity multiple
- 4.63×
- Total profit
- $1,415,947
- Equity at exit
- $120,614
Cash invested: $390,600 (down + closing). Projections, not guarantees.
Landlord ↔ Tenant lean methodology
- Overall (STATE)
- 15 Strongly Tenant-Friendly
- State New York
- 15 Strongly Tenant-Friendly · D+10
- County
- — inherits STATE
- City
- — inherits STATE
ZIP-level market 11937
- Rents YoY
- 12.3%
- Active inventory
- 135
- Price-to-rent
- 5.7×
Monthly cashflow live
- Estimated rent
- $20,267 medium interval (Pro) →
- Mortgage (P&I)
- −$7,316
- Tax from tax record
- −$593 /mo · $7,114/yr
- Insurance
- −$581
- HOA
- −$0
- Vacancy / Maint / Mgmt
- −$4,256
- Net cashflow
- $7,522
Break-even live
Sensitivity live
| Price | -10% $8,311 | -5% $7,916 | +0% $7,522 | +5% $7,127 | +10% $6,732 |
|---|---|---|---|---|---|
| Rent | -10% $5,920 | -5% $6,721 | +0% $7,522 | +5% $8,322 | +10% $9,123 |
| Rate | -1.0pp $8,224 | -0.5pp $7,876 | base $7,522 | +0.5pp $7,160 | +1.0pp $6,792 |
UW: 25.0% down · 7.5% · 30yr · 1.5% tax · 5.0% vac · 8.0% maint · 8.0% mgmt
Financing live
Cash to close
- Down payment
- $348,750
- Closing costs
- $41,850
- Reserves months
- —
- Total cash needed
- —
Loan-product check · same deal, 3 products live
Conventional
25% down · 7.5% · 30yr
- Down + closing
- —
- Monthly P&I
- —
- Monthly cashflow
- —
- DSCR
- —
- Eligible?
- —
Personal DTI + credit; lowest rate.
DSCR
20% down · 8.5% · 30yr
- Down + closing
- —
- Monthly P&I
- —
- Monthly cashflow
- —
- DSCR
- —
- Eligible?
- —
No personal income docs; deal must DSCR.
Hard money
10% down · 12.0% · 12mo
- Down + closing
- —
- Monthly P&I
- —
- Monthly cashflow
- —
- DSCR
- —
- Eligible?
- —
Short-term bridge; refi at stabilization.
Rent comps 6 comps
| Address | Beds | Baths | Sqft | Rent | $/sqft | DOM | Units | Dist |
|---|---|---|---|---|---|---|---|---|
| 1181 Springs Fireplace Rd East Hampton, NY | 3.0 | 2.0 | 1600 | $75,000 | $46.88 | 46d | 1 | 0.49mi |
| 85 Camberly Rd East Hampton, NY | 4.0 | 3.5 | 1700 | $40,000 | $23.53 | 26d | 1 | 0.51mi |
| 12 Underwood Dr East Hampton, NY | 3.0 | 2.0 | 1600 | $30,000 | $18.75 | 21d | 1 | 0.76mi |
| 19 Pond Ln East Hampton, NY | 3.0 | 2.0 | 1500 | $85,000 | $56.67 | 46d | 1 | 0.77mi |
| 197 Hog Creek Rd East Hampton, NY | 3.0 | 2.0 | 1700 | $20,000 | $11.76 | 46d | 1 | 0.84mi |
| 12 Maidstone Park Rd East Hampton, NY | 3.0 | 3.5 | 1800 | $75,000 | $41.67 | 46d | 1 | 1.03mi |
Listing history 9 events
-
2026-06-21days on market $1,395,000 Active 12 DOM
-
2026-06-18days on market $1,395,000 Active 9 DOM
-
2026-06-17days on market $1,395,000 Active 8 DOM
-
2026-06-16days on market $1,395,000 Active 7 DOM
-
2026-06-15days on market $1,395,000 Active 6 DOM
-
2026-06-13days on market $1,395,000 Active 4 DOM
-
2026-06-13days on market $1,395,000 Active 3 DOM
-
2026-06-10remarks 699-char remark
-
2026-06-10$1,395,000 Active 1 DOM
ⓘ Source: listings_history table (triggers on properties + properties_extension) + one-shot
backfill from property_details.listing_events for pre-trigger history.
Tax reassessment forecast NY · Partial reset (capped growth)
- Current annual tax
- $7,114 · $593/mo
- Projected year-2 tax
- $15,345 · $1,279/mo
- Expected delta
- +$8,231/yr (+$686/mo · 115.7%)
ⓘ Screening estimate from a state-policy table — verify with the county assessor before closing.
Climate risk First Street
- Flood 1/10 Low FEMA zone X (unshaded) · 0% chance over 30 yrs
- Wildfire 1/10 Low
- Heat 4/10 Moderate 7 d/yr ≥90°F today · 19 d/yr by 30 yrs out
- Wind 8/10 Severe 80% chance of damaging wind over 30 yrs
- Air quality 3/10 Moderate 2 unhealthy d/yr today · 3 by 30 yrs out
Nearby sold comps map
Loading sold comps map…
Walkable amenities ~0.75 mi
Loading nearby amenities…
Taxation est. · year 1
- Rental income
- $243,208
- − Mortgage interest
- −$78,142
- − Property taxes
- −$7,114
- − Insurance
- −$6,975
- − Repairs & maintenance
- −$19,457
- − Management
- −$19,457
- − Depreciation
- −$40,582
- Taxable income
- $71,482
- Est. tax owed @ 24.0%
- −$17,156
- After-tax cash flow
- $73,103/yr
For passive investors: Depreciation is non-cash, so a rental often shows a tax loss while cash-flowing — sheltering income. Rental losses are passive: they offset passive income freely, and up to $25,000/yr can offset ordinary (W-2) income if you actively participate and your MAGI is under $100k (phasing out to $0 by $150k); unused losses carry forward. On sale, claimed depreciation is recaptured at up to 25%, and gains may owe capital-gains tax (a 1031 exchange can defer both). Figures are a year-1 estimate at your 24.0% rate — not tax advice; consult a CPA.
Schools (NCES district)
- District
- Springs Union Free School District
- NCES district ID
- 3627900
- Math proficiency
- 55% ▲ 6.00%
- Reading proficiency
- 60% ▲ 10.00%
- Median HH income
- $75,413
- Composite
- 51.42/100
- National rank
- #1728
- State rank
- #239 of 590 in NY
Livability — Springs
- Score
- 63/100
- State rank
- #809
- US rank
- #15666
Category grades
Schools grade is shown separately in the Schools card above.
Census & demographics
- Census place
- Springs, NY
- County
- Suffolk County · 679,920 people
- Metro
- New York-Newark-Jersey City, NY-NJ-PA
- Population (ZIP)
- 21,882
- Household income
- $129,883
- Rent vs Own
- Severe rent burden
- 896.0
Population outlook (Suffolk County) Hauer SSP2
- Today (2025)
- 1,505,262 people
- By 2030
- 1,498,318 · -0.5%
- By 2040
- 1,471,101 · -2.3%
- By 2050
- 1,424,848 · -5.3%
- By 2075
- 1,337,157 · -11.2%
- By 2100
- 1,217,720 · -19.1%
Race, ethnicity, and origin ACS 2023
- Neighborhood character
- Majority White (61%)
- Race & ethnicity
- White 61% Hispanic / Latino 32% Two or more races 23% Black 2% Asian 2%
- Hispanic origin (detail)
- Mexican 2% Puerto Rican 1%
- Common ancestry
- Romanian 5% Scotch-Irish 4% Italian 2%
- Foreign-born
- 25% · Canada, Guatemala, Jamaica
- Languages at home
- 68% English-only · Spanish 28% Other Indo-European 1% Russian/Polish/Slavic 1%
Political lean MEDSL · Suffolk
- 2024 margin
- Lean R (+10.0) · D 45.0% · R 55.0%
- 2008→2024 swing
- -16.0pp toward R · 2008: 6.0pp · 2024: -10.0pp
- All cycles
- 2024: R+10.0 2020: R+0.0 2016: R+8.2 2012: D+2.9 2008: D+6.0
Not yet ingested
- Civics
- —
Market trends
- HPI YoY
- ▼ -285.21%
- Current HPI
- 444.1499
- Rent YoY
- ▲ 12.28%
- Metro
- New York-Newark-Jersey City, NY-NJ-PA
- State GDP YoY
- ▲ 2.60%
- F500 in state
- 92
Industry mix (Fortune 500 HQ in NY)
| Industry | F500 HQs | Revenue |
|---|---|---|
| Financial Services | 10 | $950B |
|
||
| Consumer Goods | 9 | $162B |
|
||
| Insurance | 4 | $225B |
|
||
| Telecommunications | 2 | $144B |
|
||
| Pharmaceuticals | 2 | $112B |
|
||
| Media / Entertainment | 2 | $69B |
|
||
Price history
+93.8% since first listed2 events — show timeline
- 2026-06-09 Listed $1,395,000 OneKey® MLS as Distributed by MLS Grid
- 2005-09-27 Sold (Public Records) $720,000 Public Records
Property tax history
+1.0%/yrLatest (2025): $7,114 · +0.0% YoY. Source: county tax records.
Cash-flow waterfall
monthlySold comps — $/sqft
last 12 mo · ≤1 miLoading sold comps…