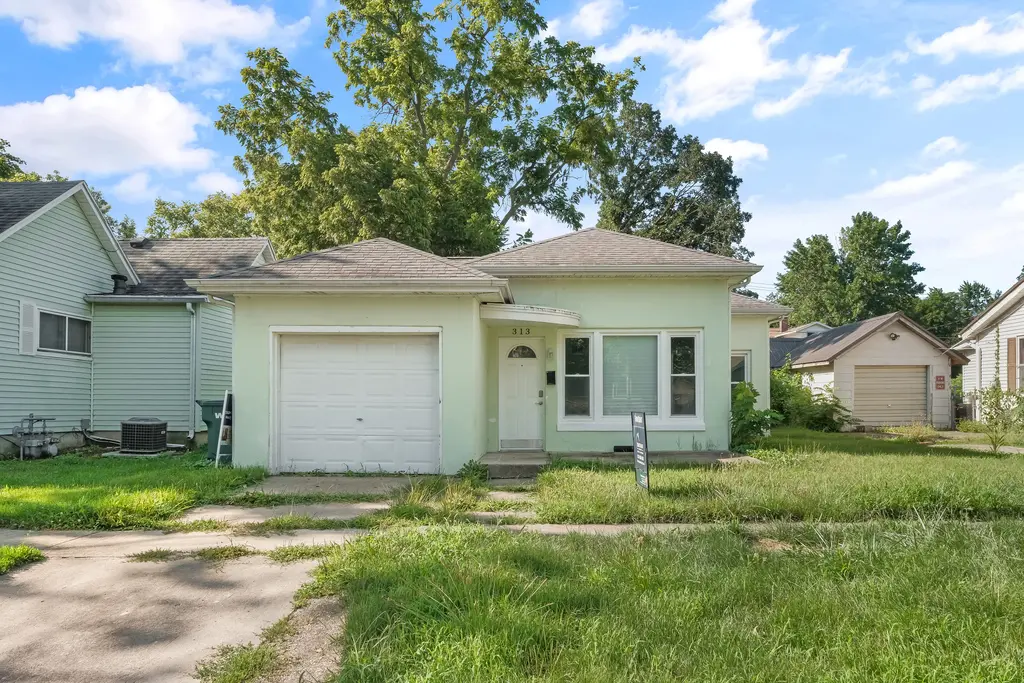
313 E Pembroke St · Tuscola, IL
Flood risk 1/10 · Minimal
- FEMA flood zone
- X (unshaded)
- Chance of flooding over 30 yrs
- 0.0%
- Est. flood insurance / yr
- $507 – $1,088
Fire risk 1/10 · Minimal
- Est. fire insurance / yr
- $804 – $1,492
Heat risk 3/10 · Minor
- Hot days now (above 106°F)
- 7 days/yr
- Hot days in 30 yrs
- 19 days/yr
Wind risk 2/10 · Minimal
- Chance of severe wind over 30 yrs
- 1.0%
Air-quality risk 2/10 · Minimal
- Unhealthy air days now
- 1 days/yr
- Unhealthy air days in 30 yrs
- 1 days/yr
Risk factors via First Street. Map © Google.
Why this score? — see what drove the D+ grade
The composite is a weighted blend of 9 inputs, each scored 0–100. Each bar is that input's sub-score; the figure is the points it added to the 100-point composite (weight × sub-score).
- ARV discount +15.0/15.0
- Cash flow +14.0/30.0
- DSCR +4.2/10.0
- 1% rule +3.8/10.0
- Livability +3.7/5.0
- Rent growth +2.5/5.0
- Condition / age +2.5/5.0
- Schools +2.0/10.0
- Appreciation +0.0/10.0
$120,000
🖨 Deal sheet (PDF) 📄 Offer letter ✓ Due diligence
Listing remarks MLS
Charming and efficient 3-bedroom, 1-bath ranch offering 1,054 square feet of comfortable living space. This home features hard surface flooring throughout, central air, and a functional layout ideal for both tenants and future owner-occupants. The attached 1-car garage adds convenience and additional storage. Currently leased through 10/03/2026 at $1,050 per month, this property presents a solid investment opportunity with immediate rental income. 24-hour notice is required for all showings. This home can also be purchased as part of a package at a discounted price with 701 S. Embarras Ave. and 812 E. Pembroke St. in Tuscola-an excellent opportunity to expand your portfolio.
Key facts
- 6,011 sq ft lot
- Garage
- Community pool
Neighborhood map
What this means for you Summary
Snapshot
- This is a 2-bed/1.0-bath single-family listed at $120k.
Deal economics
- At list price, monthly cash flow is $15 ($175/yr) — positive.
- The deal already cash-flows at list — no discount required.
- To meet the 1% rule (rent ≥ 1% of price), the offer needs to be $105k (12.3% below list).
- Recommended offer: $105k (12.3% below list) — sets the bar for 1% rule.
- Cap rate 6.4% vs local median 4.4% in Tuscola — top-decile yield for the area; either an underpriced asset or a hidden risk that comps aren't pricing in. Stress-test before assuming the spread holds.
Location & tenants
- Location reads 74/100 on livability (#257 in IL, #4,735 nationally) — a middle-class / working-renter tenant base. Strengths: cost of living A+, housing A+, employment B+; Watch: schools D+, amenities F, commute F.
- Tuscola CUSD 301 (town): math 16% / reading 28% proficiency, ranked #380 of 620 in IL (top 61%) — low school quality limits family demand, transient renter base, plan for 1-2y turnover.
- Market conditions: 20 active listings in the ZIP; 6 comparable units currently listed for rent nearby; rentals lingering (median 45d on market — plan ~5-8 weeks vacancy on turnover, expect pricing pressure); 83% of comp listings sitting > 30 days — soft ceiling on asking rent; 36 units permitted in Douglas County in 2024 (0 in 5+ unit buildings).
Forward outlook
- Local home prices are declining (-3.0%/yr); year-one equity from $830 of loan paydown is wiped out by about $4k of value loss. Plan a longer hold.
- Douglas County population projected to shrink 7% by 2050 — rents likely to lag national; underwrite the cash flow, not the appreciation.
Negotiation context
- It's been on market 50 days — a 3% lower offer ($116k) is reasonable based on typical stale-listing flexibility.
- 4 sale attempts since 3y ago with the ask held roughly flat each time — persistent listings suggest the price (not the market) is what's stuck; bring a comps-based counter.
- Current owner paid $53k; list at $120k implies a 126% gain — meaningful room to come down on a strong offer.
Risks & watch-outs
- Watch-outs: built in 1947 — expect roof / HVAC / electrical / plumbing capex.
Questions for the listing agent
- It's been on market 50 days. Have you received any prior offers? Is the seller open to a 12% concession, seller financing, or rate buy-down credit?
- Built in 1947 — when were the roof, HVAC, electrical panel, plumbing, and water heater last replaced?
- Is there a deadline driving the sale (1031 exchange, divorce, estate, relocation)? That informs how much negotiation room exists.
- Schools are D-rated, which usually means shorter tenancies and higher turnover. Who's the typical renter profile here, and what's been the actual vacancy rate?
- The area grade is low — what's the realistic commute time and amenity access for the typical tenant pool here? Any planned neighborhood developments (good or bad) we should know about?
- What's the average days-on-market for RENTAL listings here right now (not sales)? A rising rental-DOM trend means longer vacancies and softer asking-rent achievability than the comps imply.
- What's the recent tenant-quality profile in this submarket — average credit score on applications, eviction rate, late-payment / NSF rate, and stable-employment percentage? A property-management company in the area should have these aggregated.
- How much new for-sale + rental construction is in the pipeline within 1–3 miles? Heavy new supply typically softens prices + rents 12–24 months out; constrained supply supports both.
Investment metrics
- 1% rule
- 0.88% ✗
- Cap rate
- 6.44%
- Cash-on-cash
- 0.52%
- DSCR
- 1.02
- GRM
- 9.5
CMA / ARV
- ARV (median comp)
- $148,391
- List price
- $120,000
- Delta
- -19.13%
- Verdict
- UNDERPRICED
- Comps
- 20 within 1.0 mi
Show comp detail 12 sales within ~0.75 mi
| Address | Dist | Beds/Ba | Sqft | Sold | Price | $/sf | Match |
|---|---|---|---|---|---|---|---|
| 313 E Overton St | 0.06mi | 2/2.0 | 1,042 (+12%) | 1mo | $169,000 | $162 | 72 |
| 403 E Pinzon St | 0.51mi | 2/1.0 | 940 (+1%) | 3mo | $197,500 | $210 | 71 |
| 404 N Carico St | 0.29mi | 2/1.0 | 900 (-3%) | 14mo | $125,000 | $139 | 70 |
| 106 W Van Allen St | 0.45mi | 2/1.0 | 884 (-5%) | 5mo | $145,000 | $164 | 67 |
| 202 E Pembroke St | 0.14mi | 2/1.0 | 1,060 (+14%) | 7mo | $68,000 | $64 | 64 |
| 907 E Newkirk St | 0.48mi | 3/1.0 (+1) | 912 (-2%) | 9mo | $135,000 | $148 | 62 |
| 602 E Daggy St | 0.28mi | 3/1.0 (+1) | 1,050 (+13%) | 5mo | $121,000 | $115 | 56 |
| 702 E Daggy St | 0.32mi | 2/1.0 | 804 (-14%) | 8mo | $92,000 | $114 | 56 |
| 505 E Buckner St | 0.35mi | 2/1.0 | 1,004 (+8%) | 19mo | $24,000 | $24 | 54 |
| 706 E Buckner St | 0.44mi | 3/1.0 (+1) | 1,004 (+8%) | 19mo | $143,520 | $143 | 45 |
| 708 E Ficklin St | 0.61mi | 3/1.0 (+1) | 1,000 (+8%) | 13mo | $104,900 | $105 | 43 |
| 917 Timmons Dr | 0.49mi | 3/2.0 (+1) | 1,056 (+14%) | 6mo | $140,500 | $133 | 40 |
Match score weights: distance 35% · size 25% · config 20% · recency 20%. Top-matched comps best support the ARV.
Projected returns pro-forma
-3.0% appreciation · 3.0% rent growth · sell at horizon
- IRR
- -15.5%
- Equity multiple
- 0.45×
- Total profit
- $-18,511
- Equity at exit
- $17,892
- IRR
- -7.0%
- Equity multiple
- 0.56×
- Total profit
- $-14,894
- Equity at exit
- $10,375
Cash invested: $33,600 (down + closing). Projections, not guarantees.
Landlord ↔ Tenant lean methodology
- Overall (STATE)
- 43 Moderately Tenant-Leaning
- State Illinois
- 43 Moderately Tenant-Leaning · D+7
- County
- — inherits STATE
- City
- — inherits STATE
ZIP-level market 61953
- Home prices YoY
- -30.6%
- Active inventory
- 20
- Price-to-rent
- 9.5×
Monthly cashflow live
- Estimated rent
- $1,052 high interval (Pro) →
- Mortgage (P&I)
- −$629
- Tax from tax record
- −$137 /mo · $1,645/yr
- Insurance
- −$50
- HOA
- −$0
- Vacancy / Maint / Mgmt
- −$221
- Net cashflow
- $15
Break-even live
Sensitivity live
| Price | -10% $82 | -5% $49 | +0% $15 | +5% $-19 | +10% $-53 |
|---|---|---|---|---|---|
| Rent | -10% $-69 | -5% $-27 | +0% $15 | +5% $56 | +10% $98 |
| Rate | -1.0pp $75 | -0.5pp $45 | base $15 | +0.5pp $-17 | +1.0pp $-48 |
UW: 25.0% down · 7.5% · 30yr · 1.5% tax · 5.0% vac · 8.0% maint · 8.0% mgmt
Financing live
Cash to close
- Down payment
- $30,000
- Closing costs
- $3,600
- Reserves months
- —
- Total cash needed
- —
Loan-product check · same deal, 3 products live
Conventional
25% down · 7.5% · 30yr
- Down + closing
- —
- Monthly P&I
- —
- Monthly cashflow
- —
- DSCR
- —
- Eligible?
- —
Personal DTI + credit; lowest rate.
DSCR
20% down · 8.5% · 30yr
- Down + closing
- —
- Monthly P&I
- —
- Monthly cashflow
- —
- DSCR
- —
- Eligible?
- —
No personal income docs; deal must DSCR.
Hard money
10% down · 12.0% · 12mo
- Down + closing
- —
- Monthly P&I
- —
- Monthly cashflow
- —
- DSCR
- —
- Eligible?
- —
Short-term bridge; refi at stabilization.
Rent comps 6 comps
| Address | Beds | Baths | Sqft | Rent | $/sqft | DOM | Units | Dist |
|---|---|---|---|---|---|---|---|---|
| 704 N Main St Unit 704-203 Tuscola, IL | 1.0 | 1.0 | 650 | $1,000 | $1.54 | 44d | 1 | 0.41mi |
| 704 N Main St Tuscola, IL | 1.0–2.0 | 1.0–2.0 | 775 | $1,200 | $1.55 | 14d | 3 | 0.41mi |
| 704 N Main St Unit 704-308 Tuscola, IL | 1.0 | 1.0 | 600 | $900 | $1.50 | 44d | 1 | 0.41mi |
| 808 E Ficklin St Tuscola, IL | 3.0 | 1.0 | 940 | $1,425 | $1.52 | 44d | 1 | 0.65mi |
| 206 Nicholas Dr Unit A Tuscola, IL | 1.0 | 1.0 | 585 | $650 | $1.11 | 44d | 1 | 0.92mi |
| 206 Nicholas Dr Unit B Tuscola, IL | 2.0 | 1.0 | 700 | $725 | $1.04 | 44d | 1 | 0.92mi |
Listing history 27 events
-
2026-06-21days on market $120,000 Active 50 DOM
-
2026-06-18days on market $120,000 Active 48 DOM
-
2026-06-17days on market $120,000 Active 47 DOM
-
2026-06-16days on market $120,000 Active 46 DOM
-
2026-06-15days on market $120,000 Active 45 DOM
-
2026-06-13days on market $120,000 Active 43 DOM
-
2026-06-12days on market $120,000 Active 42 DOM
-
2026-06-09days on market $120,000 Active 39 DOM
-
2026-06-08days on market $120,000 Active 38 DOM
-
2026-06-07days on market $120,000 Active 37 DOM
-
2026-06-07days on market $120,000 Active 36 DOM
-
2026-06-04days on market $120,000 Active 33 DOM
-
2026-06-02days on market $120,000 Active 32 DOM
-
2026-06-01days on market $120,000 Active 31 DOM
-
2026-05-31days on market $120,000 Active 30 DOM
-
2026-05-31days on market $120,000 Active 29 DOM
-
2026-05-01$120,000 Active 683-char remark
Show marketing remark (683 chars)
Charming and efficient 3-bedroom, 1-bath ranch offering 1,054 square feet of comfortable living space. This home features hard surface flooring throughout, central air, and a functional layout ideal for both tenants and future owner-occupants. The attached 1-car garage adds convenience and additional storage. Currently leased through 10/03/2026 at $1,050 per month, this property presents a solid investment opportunity with immediate rental income. 24-hour notice is required for all showings. This home can also be purchased as part of a package at a discounted price with 701 S. Embarras Ave. and 812 E. Pembroke St. in Tuscola-an excellent opportunity to expand your portfolio.
-
2025-10-01historical
-
2025-05-26price
-
2025-04-02Active
-
2025-03-26historical
-
2025-03-06Active
-
2023-12-20historical $850
-
2023-11-20$850
-
2018-05-31soldstatus $53,000
-
2004-01-13soldstatus $41,500
-
1994-06-22soldstatus $12,500
ⓘ Source: listings_history table (triggers on properties + properties_extension) + one-shot
backfill from property_details.listing_events for pre-trigger history.
Tax reassessment forecast IL · Partial reset (capped growth)
- Current annual tax
- $1,645 · $137/mo
- Projected year-2 tax
- $2,185 · $182/mo
- Expected delta
- +$539/yr (+$45/mo · 32.8%)
ⓘ Screening estimate from a state-policy table — verify with the county assessor before closing.
Climate risk First Street
- Flood 1/10 Low FEMA zone X (unshaded) · 0% chance over 30 yrs
- Wildfire 1/10 Low
- Heat 3/10 Moderate 7 d/yr ≥106°F today · 19 d/yr by 30 yrs out
- Wind 2/10 Low 100% chance of damaging wind over 30 yrs
- Air quality 2/10 Low 1 unhealthy d/yr today · 1 by 30 yrs out
Nearby sold comps map
Loading sold comps map…
Walkable amenities ~0.75 mi
Loading nearby amenities…
Taxation est. · year 1
- Rental income
- $12,622
- − Mortgage interest
- −$6,722
- − Property taxes
- −$1,645
- − Insurance
- −$600
- − Repairs & maintenance
- −$1,010
- − Management
- −$1,010
- − Depreciation
- −$3,491
- Taxable loss
- −$1,856
- Est. tax savings @ 24.0%
- +$445
- After-tax cash flow
- $620/yr
For passive investors: Depreciation is non-cash, so a rental often shows a tax loss while cash-flowing — sheltering income. Rental losses are passive: they offset passive income freely, and up to $25,000/yr can offset ordinary (W-2) income if you actively participate and your MAGI is under $100k (phasing out to $0 by $150k); unused losses carry forward. On sale, claimed depreciation is recaptured at up to 25%, and gains may owe capital-gains tax (a 1031 exchange can defer both). Figures are a year-1 estimate at your 24.0% rate — not tax advice; consult a CPA.
Schools (NCES district)
- District
- Tuscola CUSD 301
- NCES district ID
- 1739600
- Math proficiency
- 16% ▼ -6.00%
- Reading proficiency
- 28% ▼ -18.00%
- Median HH income
- $50,982
- Composite
- 19.62/100
- National rank
- #8748
- State rank
- #380 of 620 in IL
Livability — Tuscola
- Score
- 74/100
- State rank
- #257
- US rank
- #4735
Category grades
Schools grade is shown separately in the Schools card above.
Census & demographics
- Census place
- Tuscola, IL
- Population (ZIP)
- 6,439
Population outlook (Douglas County) Hauer SSP2
- Today (2025)
- 19,209 people
- By 2030
- 18,940 · -1.4%
- By 2040
- 18,397 · -4.2%
- By 2050
- 17,829 · -7.2%
- By 2075
- 16,395 · -14.6%
- By 2100
- 14,329 · -25.4%
Race, ethnicity, and origin ACS 2023
- Neighborhood character
- Predominantly White (93%)
- Race & ethnicity
- White 93% Two or more races 3% Black 2%
- Common ancestry
- Italian 3% Slovak 2% Lithuanian 2%
- Foreign-born
- 2% · Canada
- Languages at home
- 92% English-only · German/W. Germanic 6% Other Indo-European 1% Spanish 1%
Political lean MEDSL · Douglas
- 2024 margin
- Solid R (+46.1) · D 26.1% · R 72.3% · Other 1.6%
- 2008→2024 swing
- -24.9pp toward R · 2008: -21.3pp · 2024: -46.1pp
- All cycles
- 2024: R+46.1 2020: R+44.4 2016: R+46.3 2012: R+36.8 2008: R+21.3
Not yet ingested
- Civics
- —
Market trends
- HPI YoY
- ▼ -84.74%
- Current HPI
- 192.1209
- Rent YoY
- —
- Metro
- —
- State GDP YoY
- ▲ 1.59%
- F500 in state
- 60
Industry mix (Fortune 500 HQ in IL)
| Industry | F500 HQs | Revenue |
|---|---|---|
| Insurance | 4 | $201B |
|
||
| Consumer Goods | 4 | $87B |
|
||
| Industrial Machinery | 3 | $64B |
|
||
| Healthcare | 2 | $55B |
|
||
| Retail / Pharmacy | 1 | $148B |
|
||
| Agriculture / Food | 1 | $86B |
|
||
Price history
+860.0% since first listed11 events — show timeline
- 2026-05-01 Listed $120,000 MRED as Distributed by MLS Grid
- 2025-10-01 Listing Removed — MRED as Distributed by MLS Grid
- 2025-05-26 Price Changed — MRED as Distributed by MLS Grid
- 2025-04-02 Listed — MRED as Distributed by MLS Grid
- 2025-03-26 Listing Removed — MRED as Distributed by MLS Grid
- 2025-03-06 Listed — MRED as Distributed by MLS Grid
- 2023-12-20 Rental Removed $850 TURBOTENANT
- 2023-11-20 Listed for Rent $850 TURBOTENANT
- 2018-05-31 Sold (Public Records) $53,000 Public Records
- 2004-01-13 Sold (Public Records) $41,500 Public Records
- 1994-06-22 Sold (Public Records) $12,500 Public Records
Property tax history
+0.3%/yrLatest (2024): $1,645 · +9.4% YoY. Source: county tax records.
Cash-flow waterfall
monthlySold comps — $/sqft
last 12 mo · ≤1 miLoading sold comps…